World - Butter - Market Analysis, Forecast, Size, Trends and Insights
Get instant access to more than 2 million reports, dashboards, and datasets on the IndexBox Platform.
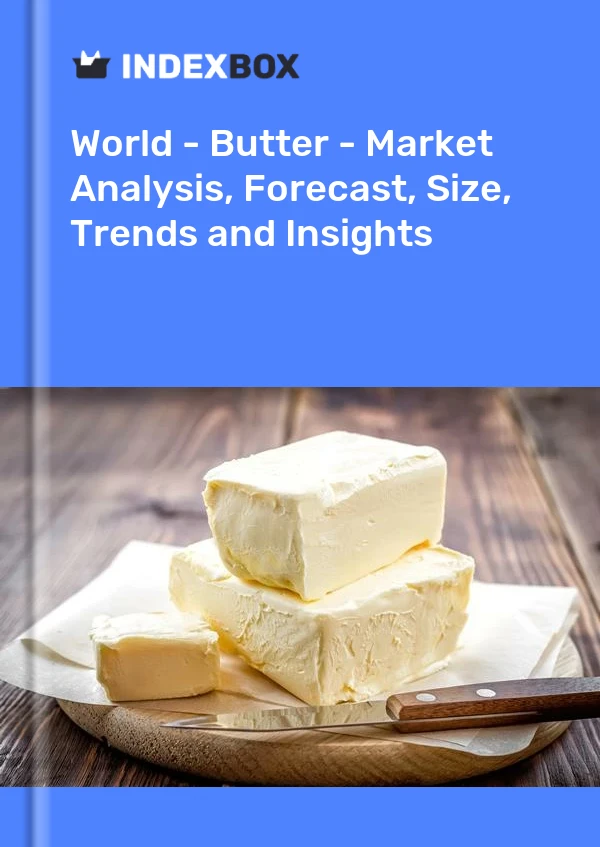
View PricingCurrent Price of Butter
Currently, the price of butter varies depending on several factors such as the country, region, brand, and quality. In order to provide a general overview, let's look at the average prices of butter in some major markets.
United States
In the United States, the price of butter has been relatively stable in recent years. As of now, the average price for a pound of butter ranges from $3.00 to $5.00. However, it's worth mentioning that organic or specialty butters may be priced higher, sometimes reaching up to $8.00 per pound.
United Kingdom
In the United Kingdom, the price of butter has experienced some fluctuations in the past few years. Currently, the average price is around £1.50 to £2.50 per 250 grams. Again, specialty butters or those marketed as organic tend to have higher price tags.
Europe
In Europe, butter prices can vary significantly depending on the country. For example, in Germany, the average price is approximately €1.50 to €2.50 per 250 grams. In France, the average price is slightly higher at around €2.00 to €3.00 per 250 grams. Prices in other European countries such as Italy, Spain, and the Netherlands are similar to the prices in Germany and France.
Australia
In Australia, the price of butter can be a bit higher compared to other countries due to factors such as shipping costs. On average, a 250-gram block of butter costs around AUD$2.50 to AUD$4.00.
Canada
Similar to the United States, the price of butter in Canada has remained relatively stable in recent years. Currently, the average price is between CAD$3.00 to CAD$5.00 per pound.
New Zealand
New Zealand is known for its dairy industry, and as such, the price of butter is relatively lower compared to many other countries. The average price for a 250-gram block of butter is around NZD$2.50 to NZD$3.50.
It's important to note that these prices are just averages and can vary based on factors such as sales, promotions, and local market conditions. Additionally, prices may also be influenced by the supply and demand dynamics of the dairy industry, fluctuations in currency exchange rates, and the cost of production.
While these prices provide a general idea of the current cost of butter, it's always recommended to check local stores, supermarkets, or online retailers for the most up-to-date and accurate prices in your specific location.
This report provides an in-depth analysis of the global butter market. Within it, you will discover the latest data on market trends and opportunities by country, consumption, production and price developments, as well as the global trade (imports and exports). The forecast exhibits the market prospects through 2030.
Product coverage:
- FCL 886 - Butter of Cow Milk
Country coverage:
Worldwide - the report contains statistical data for 200 countries and includes detailed profiles of the 50 largest consuming countries:
- USA
- China
- Japan
- Germany
- United Kingdom
- France
- Brazil
- Italy
- Russian Federation
- India
- Canada
- Australia
- Republic of Korea
- Spain
- Mexico
- Indonesia
- Netherlands
- Turkey
- Saudi Arabia
- Switzerland
- Sweden
- Nigeria
- Poland
- Belgium
- Argentina
- Norway
- Austria
- Thailand
- United Arab Emirates
- Colombia
- Denmark
- South Africa
- Malaysia
- Israel
- Singapore
- Egypt
- Philippines
- Finland
- Chile
- Ireland
- Pakistan
- Greece
- Portugal
- Kazakhstan
- Algeria
- Czech Republic
- Qatar
- Peru
- Romania
- Vietnam
+ the largest producing countries
Data coverage:
- Global market volume and value
- Per Capita consumption
- Forecast of the market dynamics in the medium term
- Global production, split by region and country
- Global trade (exports and imports)
- Export and import prices
- Market trends, drivers and restraints
- Key market players and their profiles
Company coverage:
Reasons to buy this report:
- Take advantage of the latest data
- Find deeper insights into current market developments
- Discover vital success factors affecting the market
This report is designed for manufacturers, distributors, importers, and wholesalers, as well as for investors, consultants and advisors.
In this report, you can find information that helps you to make informed decisions on the following issues:
- How to diversify your business and benefit from new market opportunities
- How to load your idle production capacity
- How to boost your sales on overseas markets
- How to increase your profit margins
- How to make your supply chain more sustainable
- How to reduce your production and supply chain costs
- How to outsource production to other countries
- How to prepare your business for global expansion
While doing this research, we combine the accumulated expertise of our analysts and the capabilities of artificial intelligence. The AI-based platform, developed by our data scientists, constitutes the key working tool for business analysts, empowering them to discover deep insights and ideas from the marketing data.
-
1. INTRODUCTION
Making Data-Driven Decisions to Grow Your Business
- REPORT DESCRIPTION
- RESEARCH METHODOLOGY AND AI PLATFORM
- DATA-DRIVEN DECISIONS FOR YOUR BUSINESS
- GLOSSARY AND SPECIFIC TERMS
-
2. EXECUTIVE SUMMARY
A Quick Overview of Market Performance
- KEY FINDINGS
- MARKET TRENDS This Chapter is Available Only for the Professional Edition PRO
-
3. MARKET OVERVIEW
Understanding the Current State of The Market and Its Prospects
- MARKET SIZE
- CONSUMPTION BY COUNTRY
- MARKET FORECAST TO 2030
-
4. MOST PROMISING PRODUCT
Finding New Products to Diversify Your Business
This Chapter is Available Only for the Professional Edition PRO- TOP PRODUCTS TO DIVERSIFY YOUR BUSINESS
- BEST-SELLING PRODUCTS
- MOST CONSUMED PRODUCT
- MOST TRADED PRODUCT
- MOST PROFITABLE PRODUCT FOR EXPORT
-
5. MOST PROMISING SUPPLYING COUNTRIES
Choosing the Best Countries to Establish Your Sustainable Supply Chain
This Chapter is Available Only for the Professional Edition PRO- TOP COUNTRIES TO SOURCE YOUR PRODUCT
- TOP PRODUCING COUNTRIES
- TOP EXPORTING COUNTRIES
- LOW-COST EXPORTING COUNTRIES
-
6. MOST PROMISING OVERSEAS MARKETS
Choosing the Best Countries to Boost Your Exports
This Chapter is Available Only for the Professional Edition PRO- TOP OVERSEAS MARKETS FOR EXPORTING YOUR PRODUCT
- TOP CONSUMING MARKETS
- UNSATURATED MARKETS
- TOP IMPORTING MARKETS
- MOST PROFITABLE MARKETS
7. GLOBAL PRODUCTION
The Latest Trends and Insights into The Industry
- PRODUCTION VOLUME AND VALUE
- PRODUCTION BY COUNTRY
8. GLOBAL IMPORTS
The Largest Importers on The Market and How They Succeed
- IMPORTS FROM 2012–2023
- IMPORTS BY COUNTRY
- IMPORT PRICES BY COUNTRY
9. GLOBAL EXPORTS
The Largest Exporters on The Market and How They Succeed
- EXPORTS FROM 2012–2023
- EXPORTS BY COUNTRY
- EXPORT PRICES BY COUNTRY
-
10. PROFILES OF MAJOR PRODUCERS
The Largest Producers on The Market and Their Profiles
This Chapter is Available Only for the Professional Edition PRO -
11. COUNTRY PROFILES
The Largest Markets And Their Profiles
This Chapter is Available Only for the Professional Edition PRO- United States
- China
- Japan
- Germany
- United Kingdom
- France
- Brazil
- Italy
- Russian Federation
- India
- Canada
- Australia
- Republic of Korea
- Spain
- Mexico
- Indonesia
- Netherlands
- Turkey
- Saudi Arabia
- Switzerland
- Sweden
- Nigeria
- Poland
- Belgium
- Argentina
- Norway
- Austria
- Thailand
- United Arab Emirates
- Colombia
- Denmark
- South Africa
- Malaysia
- Israel
- Singapore
- Egypt
- Philippines
- Finland
- Chile
- Ireland
- Pakistan
- Greece
- Portugal
- Kazakhstan
- Algeria
- Czech Republic
- Qatar
- Peru
- Romania
- Vietnam
-
LIST OF TABLES
- Key Findings In 2023
- Market Volume, In Physical Terms, 2012–2023
- Market Value, 2012–2023
- Per Capita Consumption, By Country, 2018–2023
- Production, In Physical Terms, By Country, 2012–2023
- Imports, In Physical Terms, By Country, 2012–2023
- Imports, In Value Terms, By Country, 2012–2023
- Import Prices, By Country Of Destination, 2012–2023
- Exports, In Physical Terms, By Country, 2012–2023
- Exports, In Value Terms, By Country, 2012–2023
- Export Prices, By Country Of Origin, 2012–2023
-
LIST OF FIGURES
- Market Volume, In Physical Terms, 2012–2023
- Market Value, 2012–2023
- Consumption, By Country, 2023
- Market Volume Forecast to 2030
- Market Value Forecast to 2030
- Products: Market Size And Growth, By Type
- Products: Average Per Capita Consumption, By Type
- Products: Exports And Growth, By Type
- Products: Export Prices And Growth, By Type
- Production Volume And Growth
- Exports And Growth
- Export Prices And Growth
- Market Size And Growth
- Per Capita Consumption
- Imports And Growth
- Import Prices
- Production, In Physical Terms, 2012–2023
- Production, In Value Terms, 2012–2023
- Production, By Country, 2023
- Production, In Physical Terms, By Country, 2012–2023
- Imports, In Physical Terms, 2012–2023
- Imports, In Value Terms, 2012–2023
- Imports, In Physical Terms, By Country, 2023
- Imports, In Physical Terms, By Country, 2012–2023
- Imports, In Value Terms, By Country, 2012–2023
- Import Prices, By Country, 2012–2023
- Exports, In Physical Terms, 2012–2023
- Exports, In Value Terms, 2012–2023
- Exports, In Physical Terms, By Country, 2023
- Exports, In Physical Terms, By Country, 2012–2023
- Exports, In Value Terms, By Country, 2012–2023
- Export Prices, 2012–2023
This report provides an in-depth analysis of the global butter market.
This report provides an in-depth analysis of the global butter and ghee market.
This report provides an in-depth analysis of the global market for butter and dairy spreads.
This report provides an in-depth analysis of the global ghee market.
This report provides an in-depth analysis of the global dairy produce market.
This report provides an in-depth analysis of the global dairy spread market.
This year global butter production is anticipated to keep up with ha last year, amounting to 5.6M tons. The EU is forecast to decrease butter exports due to a slight drop in production amid an increase in demand. Butter exports from New Zealand are not forecast to grow due to increased competition with UHT cream for food service being increasingly in demand.
The global trade in butter amounted to X million USD in 2015, fluctuating wildly over the period under review. A significant drop in 2009 was followed by a recovery over the next two years, until exports decreased again
New Zealand continued its dominance in the global butter trade. In 2014, New Zealand exported X thousand tons of butter totaling X million USD, X% over the previous year. Its primary trading partner was China, where it supplied X% of its tota
Global butter and ghee consumption amounted to X thousand tons in 2015, remaining constant against the previous year level.
Global butter and ghee exports amounted to X thousand tons in 2015, coming down by -X% against the previous year level.
Global butter and ghee imports amounted to X thousand tons in 2015, descending by -X% against the previous year level.
In 2015, the countries with the highest levels of butter and ghee production were Turkey (X thousand tons), Iran (X thousand tons), Syria (X thousand tons), together accounting for X% of total output.
The global butter and ghee market fluctuated wildly, finally rising from X billion USD in 2007 to X billion USD in 2015.
The market of butter and ghee fluctuated wildly, finally rising from X billion USD in 2007 to X billion USD in 2015. Over the last year, the market dropped by X% in value terms.
New Zealand seized control of the butter and ghee market. In 2014, New Zealand exported X thousand tons of butter and ghee totaling X USD, X% over the previous year. Its primary trading partner was China, where it supplied X% of its total but


