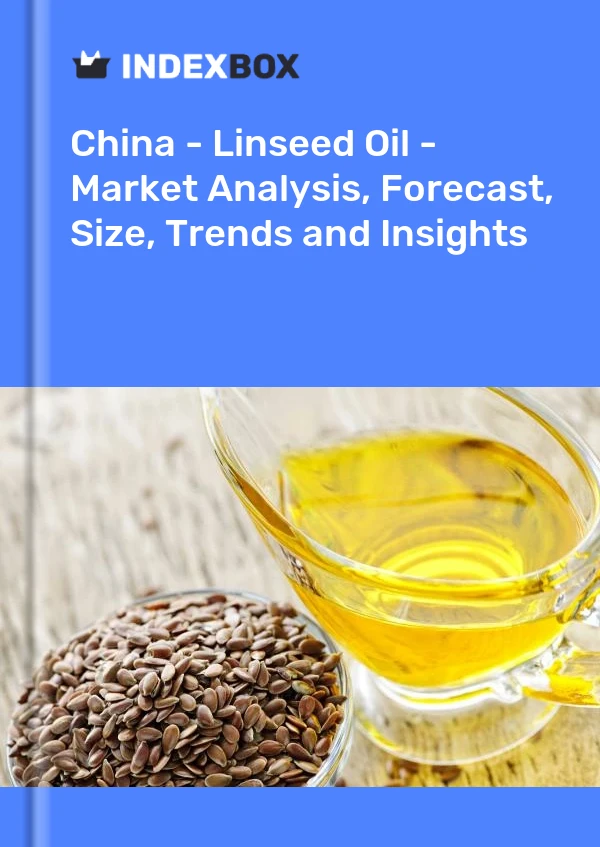
China - Linseed Oil - Market Analysis, Forecast, Size, Trends and Insights
Get instant access to more than 2 million reports, dashboards, and datasets on the IndexBox Platform.
View PricingLinseed Oil Price in China - 2023
Contents:
- Linseed Oil Price in China (CIF) - 2023
- Linseed Oil Price in China (FOB) - 2023
- Linseed Oil Imports in China
- Linseed Oil Exports in China
Linseed Oil Price in China (CIF) - 2023
In June 2023, the average linseed oil import price amounted to $898 per ton, dropping by -17.8% against the previous month. Over the period under review, the import price saw a deep setback. The most prominent rate of growth was recorded in February 2023 an increase of 30% against the previous month. The import price peaked at $1,948 per ton in June 2022; however, from July 2022 to June 2023, import prices remained at a lower figure.
Average prices varied noticeably amongst the major supplying countries. In June 2023, the country with the highest price was Russia ($902 per ton), while the price for Kazakhstan totaled $837 per ton.
From June 2022 to June 2023, the most notable rate of growth in terms of prices was attained by Russia (-4.7%), while the prices for the other major suppliers experienced a decline.
Linseed Oil Price in China (FOB) - 2023
In June 2023, the average linseed oil export price amounted to $3,377 per ton, which is down by -8.2% against the previous month. Overall, the export price saw a relatively flat trend pattern. The most prominent rate of growth was recorded in January 2023 an increase of 57% month-to-month. As a result, the export price attained the peak level of $5,945 per ton. From February 2023 to June 2023, the the average export prices remained at a lower figure.
There were significant differences in the average prices for the major overseas markets. In June 2023, the country with the highest price was Australia ($4,581 per ton), while the average price for exports to the Netherlands ($2,636 per ton) was amongst the lowest.
From June 2022 to June 2023, the most notable rate of growth in terms of prices was recorded for supplies to Canada (+11.2%), while the prices for the other major destinations experienced mixed trend patterns.
Linseed Oil Imports in China
In 2022, overseas purchases of linseed oil decreased by -41% to 28K tons, falling for the second year in a row after two years of growth. Overall, imports recorded a deep contraction. The most prominent rate of growth was recorded in 2020 when imports increased by 5.5% against the previous year. As a result, imports attained the peak of 58K tons. From 2021 to 2022, the growth of imports failed to regain momentum.
In value terms, linseed oil imports reduced notably to $45M in 2022. In general, imports recorded a pronounced downturn. The most prominent rate of growth was recorded in 2021 when imports increased by 23%. As a result, imports attained the peak of $69M, and then contracted rapidly in the following year.
| Import of Linseed Oil in China (Million USD) | |||||
|---|---|---|---|---|---|
| COUNTRY | 2019 | 2020 | 2021 | 2022 | CAGR, 2019-2022 |
| Russia | 8.6 | 18.6 | 26.1 | 24.1 | 41.0% |
| Kazakhstan | 23.1 | 23.3 | 27.2 | 14.2 | -15.0% |
| France | 0.3 | 0.8 | 2.6 | 1.8 | 81.7% |
| Belgium | 4.1 | 3.8 | 3.3 | 1.6 | -26.9% |
| Turkey | 7.3 | 2.1 | 1.9 | N/A | -49.0% |
| Others | 4.3 | 7.4 | 7.8 | 2.9 | -12.3% |
| Total | 47.6 | 56.1 | 68.8 | 44.5 | -2.2% |
Top Suppliers of Linseed Oil to China in 2022:
- Russia (15.1K tons)
- Kazakhstan (10.5K tons)
- France (1.7K tons)
- Belgium (0.8K tons)
Linseed Oil Exports in China
In 2022, exports of linseed oil from China fell slightly to 1.5K tons, remaining constant against 2021 figures. In general, total exports indicated a remarkable increase from 2019 to 2022: its volume increased at an average annual rate of +10.1% over the last three years. The trend pattern, however, indicated some noticeable fluctuations being recorded throughout the analyzed period. Based on 2022 figures, exports increased by +61.9% against 2020 indices. The most prominent rate of growth was recorded in 2021 when exports increased by 63% against the previous year. As a result, the exports reached the peak of 1.5K tons, leveling off in the following year.
In value terms, linseed oil exports soared to $5.7M in 2022. Overall, exports, however, continue to indicate a significant increase. The pace of growth appeared the most rapid in 2021 with an increase of 65%. Over the period under review, the exports reached the peak figure in 2022 and are likely to continue growth in the near future.
| Export of Linseed Oil in China (Thousand USD) | |||||
|---|---|---|---|---|---|
| COUNTRY | 2019 | 2020 | 2021 | 2022 | CAGR, 2019-2022 |
| United States | 2,167 | 1,638 | 2,574 | 3,290 | 14.9% |
| Canada | 183 | 130 | 477 | 634 | 51.3% |
| Australia | 85.5 | 164 | 314 | 505 | 80.8% |
| Netherlands | 145 | 238 | 99.3 | 447 | 45.5% |
| Japan | 103 | 137 | 114 | 282 | 39.9% |
| South Korea | 5.5 | 4.1 | 19.2 | 151 | 201.7% |
| Others | 394 | 414 | 910 | 422 | 2.3% |
| Total | 3,083 | 2,725 | 4,509 | 5,732 | 23.0% |
Top Export Markets for Linseed Oil from China in 2022:
- United States (864.1 tons)
- Canada (157.6 tons)
- Australia (139.2 tons)
- Netherlands (112.9 tons)
- Japan (77.3 tons)
- South Korea (38.2 tons)
This report provides an in-depth analysis of the linseed oil market in China. Within it, you will discover the latest data on market trends and opportunities by country, consumption, production and price developments, as well as the global trade (imports and exports). The forecast exhibits the market prospects through 2030.
Product coverage:
- FCL 334 - Oil of Linseed
Country coverage:
Data coverage:
- Market volume and value
- Per Capita consumption
- Forecast of the market dynamics in the medium term
- Trade (exports and imports) in China
- Export and import prices
- Market trends, drivers and restraints
- Key market players and their profiles
Reasons to buy this report:
- Take advantage of the latest data
- Find deeper insights into current market developments
- Discover vital success factors affecting the market
This report is designed for manufacturers, distributors, importers, and wholesalers, as well as for investors, consultants and advisors.
In this report, you can find information that helps you to make informed decisions on the following issues:
- How to diversify your business and benefit from new market opportunities
- How to load your idle production capacity
- How to boost your sales on overseas markets
- How to increase your profit margins
- How to make your supply chain more sustainable
- How to reduce your production and supply chain costs
- How to outsource production to other countries
- How to prepare your business for global expansion
While doing this research, we combine the accumulated expertise of our analysts and the capabilities of artificial intelligence. The AI-based platform, developed by our data scientists, constitutes the key working tool for business analysts, empowering them to discover deep insights and ideas from the marketing data.
-
1. INTRODUCTION
Making Data-Driven Decisions to Grow Your Business
- REPORT DESCRIPTION
- RESEARCH METHODOLOGY AND AI PLATFORM
- DATA-DRIVEN DECISIONS FOR YOUR BUSINESS
- GLOSSARY AND SPECIFIC TERMS
-
2. EXECUTIVE SUMMARY
A Quick Overview of Market Performance
- KEY FINDINGS
- MARKET TRENDS This Chapter is Available Only for the Professional Edition PRO
-
3. MARKET OVERVIEW
Understanding the Current State of The Market and Its Prospects
- MARKET SIZE
- MARKET STRUCTURE
- TRADE BALANCE
- PER CAPITA CONSUMPTION
- MARKET FORECAST TO 2030
-
4. MOST PROMISING PRODUCT
Finding New Products to Diversify Your Business
This Chapter is Available Only for the Professional Edition PRO- TOP PRODUCTS TO DIVERSIFY YOUR BUSINESS
- BEST-SELLING PRODUCTS
- MOST CONSUMED PRODUCT
- MOST TRADED PRODUCT
- MOST PROFITABLE PRODUCT FOR EXPORT
-
5. MOST PROMISING SUPPLYING COUNTRIES
Choosing the Best Countries to Establish Your Sustainable Supply Chain
This Chapter is Available Only for the Professional Edition PRO- TOP COUNTRIES TO SOURCE YOUR PRODUCT
- TOP PRODUCING COUNTRIES
- TOP EXPORTING COUNTRIES
- LOW-COST EXPORTING COUNTRIES
-
6. MOST PROMISING OVERSEAS MARKETS
Choosing the Best Countries to Boost Your Exports
This Chapter is Available Only for the Professional Edition PRO- TOP OVERSEAS MARKETS FOR EXPORTING YOUR PRODUCT
- TOP CONSUMING MARKETS
- UNSATURATED MARKETS
- TOP IMPORTING MARKETS
- MOST PROFITABLE MARKETS
7. PRODUCTION
The Latest Trends and Insights into The Industry
- PRODUCTION VOLUME AND VALUE
8. IMPORTS
The Largest Import Supplying Countries
- IMPORTS FROM 2012–2023
- IMPORTS BY COUNTRY
- IMPORT PRICES BY COUNTRY
9. EXPORTS
The Largest Destinations for Exports
- EXPORTS FROM 2012–2023
- EXPORTS BY COUNTRY
- EXPORT PRICES BY COUNTRY
-
10. PROFILES OF MAJOR PRODUCERS
The Largest Producers on The Market and Their Profiles
This Chapter is Available Only for the Professional Edition PRO -
LIST OF TABLES
- Key Findings In 2023
- Market Volume, In Physical Terms, 2012–2023
- Market Value, 2012–2023
- Per Capita Consumption In 2012-2023
- Imports, In Physical Terms, By Country, 2012–2023
- Imports, In Value Terms, By Country, 2012–2023
- Import Prices, By Country Of Origin, 2012–2023
- Exports, In Physical Terms, By Country, 2012–2023
- Exports, In Value Terms, By Country, 2012–2023
- Export Prices, By Country Of Destination, 2012–2023
-
LIST OF FIGURES
- Market Volume, In Physical Terms, 2012–2023
- Market Value, 2012–2023
- Market Structure – Domestic Supply vs. Imports, In Physical Terms, 2012-2023
- Market Structure – Domestic Supply vs. Imports, In Value Terms, 2012-2023
- Trade Balance, In Physical Terms, 2012-2023
- Trade Balance, In Value Terms, 2012-2023
- Per Capita Consumption, 2012-2023
- Market Volume Forecast to 2030
- Market Value Forecast to 2030
- Products: Market Size And Growth, By Type
- Products: Average Per Capita Consumption, By Type
- Products: Exports And Growth, By Type
- Products: Export Prices And Growth, By Type
- Production Volume And Growth
- Exports And Growth
- Export Prices And Growth
- Market Size And Growth
- Per Capita Consumption
- Imports And Growth
- Import Prices
- Production, In Physical Terms, 2012–2023
- Production, In Value Terms, 2012–2023
- Imports, In Physical Terms, 2012–2023
- Imports, In Value Terms, 2012–2023
- Imports, In Physical Terms, By Country, 2023
- Imports, In Physical Terms, By Country, 2012–2023
- Imports, In Value Terms, By Country, 2012–2023
- Import Prices, By Country Of Origin, 2012–2023
- Exports, In Physical Terms, 2012–2023
- Exports, In Value Terms, 2012–2023
- Exports, In Physical Terms, By Country, 2023
- Exports, In Physical Terms, By Country, 2012–2023
- Exports, In Value Terms, By Country, 2012–2023
- Export Prices, By Country Of Destination, 2012–2023
This report provides an in-depth analysis of the linseed oil market in China.
This report provides an in-depth analysis of the maize oil market in China.
This report provides an in-depth analysis of the sesame oil market in China.
This report provides an in-depth analysis of the castor oil seed market in China.
This report provides an in-depth analysis of the crude maize oil market in China.
This report provides an in-depth analysis of the refined maize oil market in China.
This report provides an in-depth analysis of the global linseed oil market.
This report provides an in-depth analysis of the global maize oil market.
This report provides an in-depth analysis of the global sesame oil market.
Global Castor Oil Seed Market Report 2019. This report provides an in-depth analysis of the global castor oil seed market.
In value terms, linseed oil imports soared to $4.5M in April 2023.
Exports of Sesame Oil decreased to $2.8M in June 2023 in terms of value.
Global linseed oil consumption amounted to X thousand tons in 2015, shrinking by -X% against the previous year level.
In 2015, the countries with the highest levels of linseed oil production were China (X thousand tons), Belgium (X thousand tons), the United States (X thousand tons), together accounting for X% of total output.
Belgium continued its dominance in the global linseed oil trade. In 2014, Belgium exported X thousand tons of linseed oil totaling X million USD, X% under the previous year. Its primary trading partner was Germany, where it supplied X% of its to
Global maize oil consumption amounted to X thousand tons in 2015, falling by -X% against the previous year level.
In 2015, the country with the largest volume of the maize oil output was the United States (X thousand tons), accounting for X% of global production.
The maize oil market reached X million USD, rising with an annual increase of X%.
The U.S. dominates in the global maize oil trade. In 2014, the U.S. exported X thousand tons of maize oil totaling X million USD, X% under the previous year. Its primary trading partner was Saudi Arabia, where it supplied X% of its total maize
The global sesame oil market revenue amounted to $X in 2017 (IndexBox estimate), flattening at the previous year. This ...


