
France - Wrapping Papers - Market Analysis, Forecast, Size, Trends and Insights
Get instant access to more than 2 million reports, dashboards, and datasets on the IndexBox Platform.
View PricingPrice of Frances Wrapping Paper Drops to $2,154 per Ton
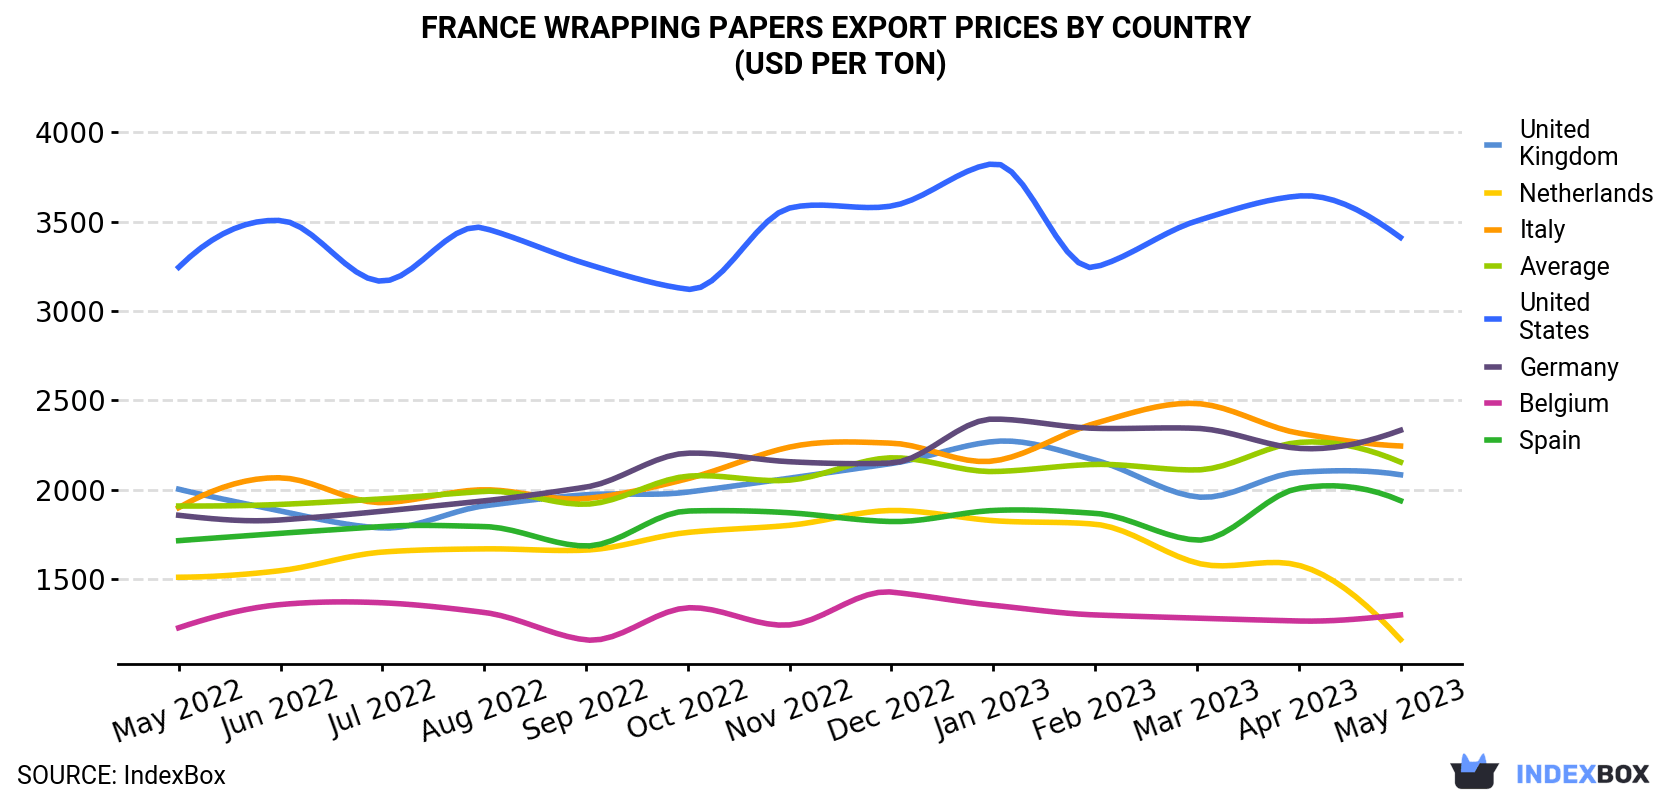
France Wrapping Papers Export Price in May 2023
In May 2023, the wrapping papers price amounted to $2,154 per ton (FOB, France), dropping by -4.8% against the previous month. Over the period from May 2022 to May 2023, it increased at an average monthly rate of +1.0%. The pace of growth appeared the most rapid in October 2022 when the average export price increased by 8.2% month-to-month. Over the period under review, the average export prices reached the maximum at $2,264 per ton in April 2023, and then fell modestly in the following month.
Prices varied noticeably by the country of destination: the country with the highest price was the United States ($3,412 per ton), while the average price for exports to the Netherlands ($1,160 per ton) was amongst the lowest.
From May 2022 to May 2023, the most notable rate of growth in terms of prices was recorded for supplies to Germany (+1.9%), while the prices for the other major destinations experienced more modest paces of growth.
| COUNTRY | Export Price of Wrapping Papers in France (USD per ton) | ||||||||||||
|---|---|---|---|---|---|---|---|---|---|---|---|---|---|
| May 2022 | Jun 2022 | Jul 2022 | Aug 2022 | Sep 2022 | Oct 2022 | Nov 2022 | Dec 2022 | Jan 2023 | Feb 2023 | Mar 2023 | Apr 2023 | May 2023 | |
| United States | 3,245 | 3,507 | 3,167 | 3,464 | 3,265 | 3,122 | 3,577 | 3,588 | 3,825 | 3,246 | 3,505 | 3,644 | 3,412 |
| Germany | 1,856 | 1,830 | 1,879 | 1,937 | 2,014 | 2,204 | 2,156 | 2,149 | 2,395 | 2,343 | 2,343 | 2,231 | 2,332 |
| Italy | 1,899 | 2,066 | 1,927 | 1,999 | 1,950 | 2,061 | 2,238 | 2,260 | 2,160 | 2,371 | 2,482 | 2,316 | 2,244 |
| United Kingdom | 2,002 | 1,880 | 1,785 | 1,909 | 1,971 | 1,986 | 2,064 | 2,146 | 2,269 | 2,165 | 1,959 | 2,097 | 2,083 |
| Spain | 1,714 | 1,755 | 1,793 | 1,793 | 1,684 | 1,880 | 1,870 | 1,821 | 1,883 | 1,867 | 1,717 | 2,007 | 1,938 |
| Belgium | 1,226 | 1,356 | 1,366 | 1,312 | 1,158 | 1,338 | 1,242 | 1,426 | 1,352 | 1,298 | 1,280 | 1,264 | 1,298 |
| Netherlands | 1,509 | 1,546 | 1,650 | 1,668 | 1,661 | 1,760 | 1,800 | 1,883 | 1,826 | 1,806 | 1,589 | 1,576 | 1,160 |
| Average | 1,908 | 1,917 | 1,948 | 1,990 | 1,918 | 2,075 | 2,053 | 2,178 | 2,101 | 2,141 | 2,110 | 2,264 | 2,154 |
France Wrapping Papers Export Prices by Type
There were significant differences in the average prices for the major types of exported product. In May 2023, the product with the highest price was paper and paperboard, coated on one or both sides with kaolin "china clay" or other inorganic substances, with or without a binder, and with no other coating, whether or not surface-coloured, surface-decorated or printed, in rolls or in square or rectangular sheets, of any size ($7,472 per ton), while the average price for exports of unbleached sack kraft paper, uncoated, in rolls of a width > 36 cm ($1,364 per ton) was amongst the lowest.
From May 2022 to May 2023, the most notable rate of growth in terms of prices was recorded for the following types: paper and paperboard; coated with inorganic substances only, whether or not surface-coloured, surface-decorated or printed, n.e.s. in heading no. 4810, in rolls or sheets (+10.8%), while the prices for the other products experienced more modest paces of growth.
France Wrapping Papers Exports
In May 2023, approximately 31K tons of wrapping paper, packaging paper and paperboard were exported from France; growing by 13% compared with the previous month. Over the period under review, exports, however, recorded a noticeable decrease. The pace of growth was the most pronounced in January 2023 when exports increased by 36% against the previous month.
In value terms, wrapping papers exports rose remarkably to $67M (IndexBox estimates) in May 2023. In general, exports, however, recorded a slight decline. The pace of growth was the most pronounced in January 2023 when exports increased by 31% month-to-month.
France Wrapping Papers Exports by Type
Paper; glassine and other glazed transparent or translucent papers, in rolls or sheets (9.6K tons), paper and paperboard, corrugated (with or without glued flat surface sheets), creped, crinkled, embossed or perforated, in rolls or sheets other than those of heading no. 4803 or 4818 (8K tons) and kraft paper and paperboard; uncoated, unbleached, weight 150g/m2 or less, in rolls or sheets, other than that of heading no. 4802 or 4803 (3.2K tons) were the main products of wrapping papers exports from France, with a combined 67% share of total exports. These products were followed by paper; vegetable parchment, in rolls or sheets, paper; greaseproof papers, in rolls or sheets, kraft paper and paperboard, bleached uniformly throughout the mass and containing > 95% chemically processed wood fibres by weight in relation to the total fibre content, coated on one or both sides with kaolin or other inorganic substances, in rolls or in square or rectangular sheets, of any size, weighing <= 150 g/m² , kraft paper and paperboard; uncoated, bleached, weight 150g/m2 or less, in rolls or sheets, other than that of heading no. 4802 or 4803, unbleached sack kraft paper, uncoated, in rolls of a width > 36 cm , sack kraft paper, uncoated, in rolls of a width > 36 cm, sulphite wrapping paper and paper and paperboard, coated on one or both sides with kaolin "china clay" or other inorganic substances, with or without a binder, and with no other coating, whether or not surface-coloured, surface-decorated or printed, in rolls or in square or rectangular sheets, of any size, which together accounted for a further 33%.
From May 2022 to May 2023, the most notable rate of growth in terms of shipments, amongst the major product types, was attained by kraft paper and paperboard; sack kraft paper, uncoated, unbleached, in rolls or sheets, other than that of heading no. 4802 or 4803 (with a CAGR of -1.6%), while the other products experienced a decline.
In value terms, paper; glassine and other glazed transparent or translucent papers, in rolls or sheets ($20M), paper and paperboard, corrugated (with or without glued flat surface sheets), creped, crinkled, embossed or perforated, in rolls or sheets other than those of heading no. 4803 or 4818 ($14M) and paper; vegetable parchment, in rolls or sheets ($11M) were the most exported types of wrapping paper, packaging paper and paperboard from France worldwide, with a combined 68% share of total exports. These products were followed by paper; greaseproof papers, in rolls or sheets, kraft paper and paperboard, bleached uniformly throughout the mass and containing > 95% chemically processed wood fibres by weight in relation to the total fibre content, coated on one or both sides with kaolin or other inorganic substances, in rolls or in square or rectangular sheets, of any size, weighing <= 150 g/m² , kraft paper and paperboard; uncoated, unbleached, weight 150g/m2 or less, in rolls or sheets, other than that of heading no. 4802 or 4803, kraft paper and paperboard; uncoated, bleached, weight 150g/m2 or less, in rolls or sheets, other than that of heading no. 4802 or 4803, unbleached sack kraft paper, uncoated, in rolls of a width > 36 cm , sack kraft paper, uncoated, in rolls of a width > 36 cm, sulphite wrapping paper and paper and paperboard, coated on one or both sides with kaolin "china clay" or other inorganic substances, with or without a binder, and with no other coating, whether or not surface-coloured, surface-decorated or printed, in rolls or in square or rectangular sheets, of any size, which together accounted for a further 32%.
Kraft paper and paperboard; sack kraft paper, uncoated, unbleached, in rolls or sheets, other than that of heading no. 4802 or 4803, with a CAGR of -0.5%, saw the highest rates of growth with regard to the value of exports, among the main product categories over the period under review, while shipments for the other products experienced a decline.
France Wrapping Papers Exports by Country
Spain (5.8K tons), Germany (4.3K tons) and Belgium (3.8K tons) were the main destinations of wrapping papers exports from France, with a combined 45% share of total exports. These countries were followed by the United States, Italy, the Netherlands, the UK, China, Poland, the Czech Republic and Algeria, which together accounted for a further 39%.
From May 2022 to May 2023, the most notable rate of growth in terms of shipments, amongst the main countries of destination, was attained by Algeria (with a CAGR of +14.4%), while the other leaders experienced mixed trend patterns.
In value terms, the largest markets for wrapping papers exported from France were Spain ($11M), the United States ($11M) and Germany ($10M), together accounting for 49% of total exports. These countries were followed by Italy, Belgium, the UK, the Netherlands, China, Poland, the Czech Republic and Algeria, which together accounted for a further 34%.
Among the main countries of destination, Algeria, with a CAGR of +14.9%, saw the highest growth rate of the value of exports, over the period under review, while shipments for the other leaders experienced more modest paces of growth.
This report provides an in-depth analysis of the wrapping papers market in France. Within it, you will discover the latest data on market trends and opportunities by country, consumption, production and price developments, as well as the global trade (imports and exports). The forecast exhibits the market prospects through 2030.
Product coverage:
- FCL 1621 - Wrapping papers
Country coverage:
- France
Data coverage:
- Market volume and value
- Per Capita consumption
- Forecast of the market dynamics in the medium term
- Trade (exports and imports) in France
- Export and import prices
- Market trends, drivers and restraints
- Key market players and their profiles
Reasons to buy this report:
- Take advantage of the latest data
- Find deeper insights into current market developments
- Discover vital success factors affecting the market
This report is designed for manufacturers, distributors, importers, and wholesalers, as well as for investors, consultants and advisors.
In this report, you can find information that helps you to make informed decisions on the following issues:
- How to diversify your business and benefit from new market opportunities
- How to load your idle production capacity
- How to boost your sales on overseas markets
- How to increase your profit margins
- How to make your supply chain more sustainable
- How to reduce your production and supply chain costs
- How to outsource production to other countries
- How to prepare your business for global expansion
While doing this research, we combine the accumulated expertise of our analysts and the capabilities of artificial intelligence. The AI-based platform, developed by our data scientists, constitutes the key working tool for business analysts, empowering them to discover deep insights and ideas from the marketing data.
-
1. INTRODUCTION
Making Data-Driven Decisions to Grow Your Business
- REPORT DESCRIPTION
- RESEARCH METHODOLOGY AND AI PLATFORM
- DATA-DRIVEN DECISIONS FOR YOUR BUSINESS
- GLOSSARY AND SPECIFIC TERMS
-
2. EXECUTIVE SUMMARY
A Quick Overview of Market Performance
- KEY FINDINGS
- MARKET TRENDS This Chapter is Available Only for the Professional Edition PRO
-
3. MARKET OVERVIEW
Understanding the Current State of The Market and Its Prospects
- MARKET SIZE
- MARKET STRUCTURE
- TRADE BALANCE
- PER CAPITA CONSUMPTION
- MARKET FORECAST TO 2030
-
4. MOST PROMISING PRODUCT
Finding New Products to Diversify Your Business
This Chapter is Available Only for the Professional Edition PRO- TOP PRODUCTS TO DIVERSIFY YOUR BUSINESS
- BEST-SELLING PRODUCTS
- MOST CONSUMED PRODUCT
- MOST TRADED PRODUCT
- MOST PROFITABLE PRODUCT FOR EXPORT
-
5. MOST PROMISING SUPPLYING COUNTRIES
Choosing the Best Countries to Establish Your Sustainable Supply Chain
This Chapter is Available Only for the Professional Edition PRO- TOP COUNTRIES TO SOURCE YOUR PRODUCT
- TOP PRODUCING COUNTRIES
- TOP EXPORTING COUNTRIES
- LOW-COST EXPORTING COUNTRIES
-
6. MOST PROMISING OVERSEAS MARKETS
Choosing the Best Countries to Boost Your Exports
This Chapter is Available Only for the Professional Edition PRO- TOP OVERSEAS MARKETS FOR EXPORTING YOUR PRODUCT
- TOP CONSUMING MARKETS
- UNSATURATED MARKETS
- TOP IMPORTING MARKETS
- MOST PROFITABLE MARKETS
7. PRODUCTION
The Latest Trends and Insights into The Industry
- PRODUCTION VOLUME AND VALUE
8. IMPORTS
The Largest Import Supplying Countries
- IMPORTS FROM 2012–2023
- IMPORTS BY COUNTRY
- IMPORT PRICES BY COUNTRY
9. EXPORTS
The Largest Destinations for Exports
- EXPORTS FROM 2012–2023
- EXPORTS BY COUNTRY
- EXPORT PRICES BY COUNTRY
-
10. PROFILES OF MAJOR PRODUCERS
The Largest Producers on The Market and Their Profiles
This Chapter is Available Only for the Professional Edition PRO -
LIST OF TABLES
- Key Findings In 2023
- Market Volume, In Physical Terms, 2012–2023
- Market Value, 2012–2023
- Per Capita Consumption In 2012-2023
- Imports, In Physical Terms, By Country, 2012–2023
- Imports, In Value Terms, By Country, 2012–2023
- Import Prices, By Country Of Origin, 2012–2023
- Exports, In Physical Terms, By Country, 2012–2023
- Exports, In Value Terms, By Country, 2012–2023
- Export Prices, By Country Of Destination, 2012–2023
-
LIST OF FIGURES
- Market Volume, In Physical Terms, 2012–2023
- Market Value, 2012–2023
- Market Structure – Domestic Supply vs. Imports, In Physical Terms, 2012-2023
- Market Structure – Domestic Supply vs. Imports, In Value Terms, 2012-2023
- Trade Balance, In Physical Terms, 2012-2023
- Trade Balance, In Value Terms, 2012-2023
- Per Capita Consumption, 2012-2023
- Market Volume Forecast to 2030
- Market Value Forecast to 2030
- Products: Market Size And Growth, By Type
- Products: Average Per Capita Consumption, By Type
- Products: Exports And Growth, By Type
- Products: Export Prices And Growth, By Type
- Production Volume And Growth
- Exports And Growth
- Export Prices And Growth
- Market Size And Growth
- Per Capita Consumption
- Imports And Growth
- Import Prices
- Production, In Physical Terms, 2012–2023
- Production, In Value Terms, 2012–2023
- Imports, In Physical Terms, 2012–2023
- Imports, In Value Terms, 2012–2023
- Imports, In Physical Terms, By Country, 2023
- Imports, In Physical Terms, By Country, 2012–2023
- Imports, In Value Terms, By Country, 2012–2023
- Import Prices, By Country Of Origin, 2012–2023
- Exports, In Physical Terms, 2012–2023
- Exports, In Value Terms, 2012–2023
- Exports, In Physical Terms, By Country, 2023
- Exports, In Physical Terms, By Country, 2012–2023
- Exports, In Value Terms, By Country, 2012–2023
- Export Prices, By Country Of Destination, 2012–2023


