
Poland - Wrapping Papers - Market Analysis, Forecast, Size, Trends and Insights
Get instant access to more than 2 million reports, dashboards, and datasets on the IndexBox Platform.
View PricingPoland's Imports of Wrapping Papers Soar to $50M in August 2023
Poland Wrapping Papers Imports
In August 2023, wrapping papers imports into Poland totaled 43K tons, remaining constant against the previous month. Overall, imports, however, saw a relatively flat trend pattern. The most prominent rate of growth was recorded in March 2023 with an increase of 24% against the previous month. As a result, imports reached the peak of 44K tons. From April 2023 to August 2023, the growth of imports failed to regain momentum.
In value terms, wrapping papers imports expanded slightly to $50M (IndexBox estimates) in August 2023. In general, imports, however, showed a mild decline. The pace of growth appeared the most rapid in March 2023 when imports increased by 30% m-o-m. As a result, imports attained the peak of $58M. From April 2023 to August 2023, the growth of imports remained at a lower figure.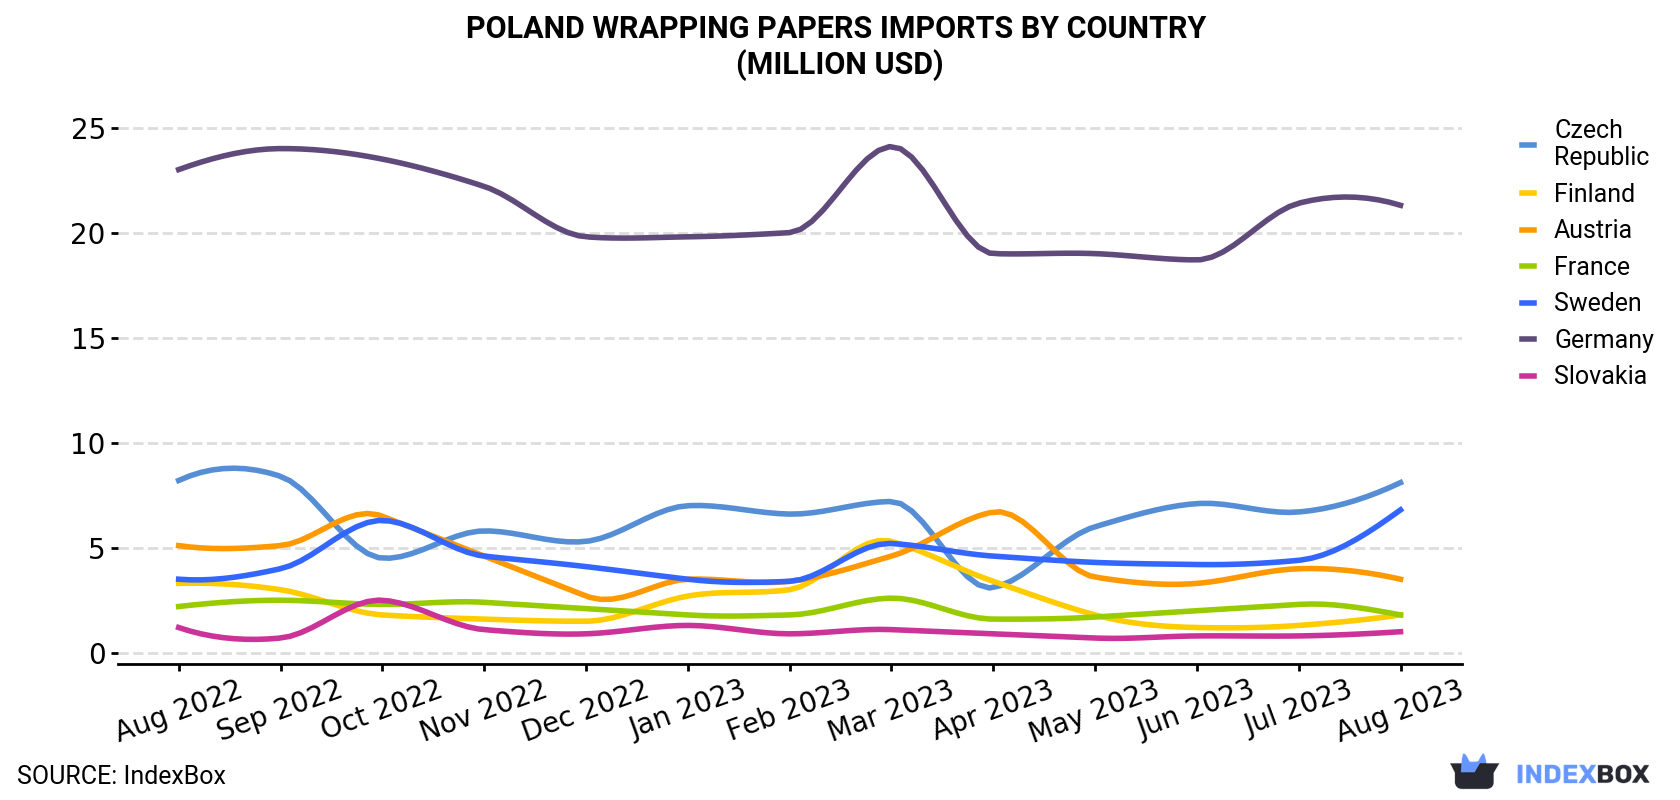
| COUNTRY | Import Value of Wrapping Papers in Poland (million USD) | ||||||||||||
|---|---|---|---|---|---|---|---|---|---|---|---|---|---|
| Aug 2022 | Sep 2022 | Oct 2022 | Nov 2022 | Dec 2022 | Jan 2023 | Feb 2023 | Mar 2023 | Apr 2023 | May 2023 | Jun 2023 | Jul 2023 | Aug 2023 | |
| Germany | 23.0 | 24.0 | 23.5 | 22.2 | 19.8 | 19.8 | 20.0 | 24.1 | 19.0 | 19.0 | 18.7 | 21.4 | 21.3 |
| Czech Republic | 8.2 | 8.4 | 4.5 | 5.8 | 5.3 | 7.0 | 6.6 | 7.2 | 3.1 | 6.0 | 7.1 | 6.7 | 8.1 |
| Sweden | 3.5 | 4.0 | 6.3 | 4.6 | 4.1 | 3.5 | 3.4 | 5.2 | 4.6 | 4.3 | 4.2 | 4.4 | 6.8 |
| Austria | 5.1 | 5.1 | 6.5 | 4.6 | 2.7 | 3.5 | 3.4 | 4.6 | 6.7 | 3.6 | 3.3 | 4.0 | 3.5 |
| Finland | 3.3 | 3.0 | 1.8 | 1.6 | 1.5 | 2.7 | 3.0 | 5.3 | 3.4 | 1.8 | 1.2 | 1.3 | 1.8 |
| France | 2.2 | 2.5 | 2.3 | 2.4 | 2.1 | 1.8 | 1.8 | 2.6 | 1.6 | 1.7 | 2.0 | 2.3 | 1.8 |
| Slovakia | 1.2 | 0.7 | 2.5 | 1.1 | 0.9 | 1.3 | 0.9 | 1.1 | 0.9 | 0.7 | 0.8 | 0.8 | 1.0 |
| Others | 9.7 | 8.7 | 9.0 | 7.6 | 4.8 | 6.0 | 5.2 | 7.6 | 6.2 | 7.2 | 6.4 | 7.1 | 5.7 |
| Total | 56.3 | 56.4 | 56.5 | 49.7 | 41.2 | 45.6 | 44.5 | 57.7 | 45.5 | 44.2 | 43.8 | 48.1 | 49.9 |
Imports by Country
In August 2023, Germany (23K tons) constituted the largest wrapping papers supplier to Poland, with a 53% share of total imports. Moreover, wrapping papers imports from Germany exceeded the figures recorded by the second-largest supplier, the Czech Republic (6.5K tons), fourfold. Sweden (4.4K tons) ranked third in terms of total imports with a 10% share.
From August 2022 to August 2023, the average monthly growth rate of volume from Germany was relatively modest. The remaining supplying countries recorded the following average monthly rates of imports growth: the Czech Republic (-0.4% per month) and Sweden (+4.8% per month).
In value terms, Germany ($21M) constituted the largest supplier of wrapping papers to Poland, comprising 43% of total imports. The second position in the ranking was taken by the Czech Republic ($8.1M), with a 16% share of total imports. It was followed by Sweden, with a 14% share.
From August 2022 to August 2023, the average monthly rate of growth in terms of value from Germany was relatively modest. The remaining supplying countries recorded the following average monthly rates of imports growth: the Czech Republic (-0.2% per month) and Sweden (+5.6% per month).
Imports by Type
In August 2023, paper and paperboard, corrugated (with or without glued flat surface sheets), creped, crinkled, embossed or perforated, in rolls or sheets other than those of heading no. 4803 or 4818 (16K tons) constituted the largest type of wrapping papers supplied to Poland, accounting for a 37% share of total imports. Moreover, paper and paperboard, corrugated (with or without glued flat surface sheets), creped, crinkled, embossed or perforated, in rolls or sheets other than those of heading no. 4803 or 4818 exceeded the figures recorded for the second-largest type, kraft paper and paperboard; uncoated, bleached, weight 150g/m2 or less, in rolls or sheets, other than that of heading no. 4802 or 4803 (5.6K tons), threefold. Unbleached sack kraft paper, uncoated, in rolls of a width > 36 cm (5.3K tons) ranked third in terms of total imports with a 12% share.
From August 2022 to August 2023, the average monthly growth rate of the volume of import of paper and paperboard, corrugated (with or without glued flat surface sheets), creped, crinkled, embossed or perforated, in rolls or sheets other than those of heading no. 4803 or 4818 totaled +1.3%. With regard to the other supplied products, the following average monthly rates of growth were recorded: kraft paper and paperboard; uncoated, bleached, weight 150g/m2 or less, in rolls or sheets, other than that of heading no. 4802 or 4803 (+2.1% per month) and unbleached sack kraft paper, uncoated, in rolls of a width > 36 cm (-1.3% per month).
In value terms, the most traded types of wrapping paper, packaging paper and paperboard in Poland were paper and paperboard, corrugated (with or without glued flat surface sheets), creped, crinkled, embossed or perforated, in rolls or sheets other than those of heading no. 4803 or 4818 ($12M), paper; glassine and other glazed transparent or translucent papers, in rolls or sheets ($8.2M) and kraft paper and paperboard; uncoated, bleached, weight 150g/m2 or less, in rolls or sheets, other than that of heading no. 4802 or 4803 ($8.1M), together accounting for 56% of total imports. Unbleached sack kraft paper, uncoated, in rolls of a width > 36 cm , paper and paperboard, coated on one or both sides with kaolin "china clay" or other inorganic substances, with or without a binder, and with no other coating, whether or not surface-coloured, surface-decorated or printed, in rolls or in square or rectangular sheets, of any size, paper; greaseproof papers, in rolls or sheets, sack kraft paper, uncoated, in rolls of a width > 36 cm, kraft paper and paperboard; uncoated, unbleached, weight 150g/m2 or less, in rolls or sheets, other than that of heading no. 4802 or 4803, sulphite wrapping paper, kraft paper and paperboard, bleached uniformly throughout the mass and containing > 95% chemically processed wood fibres by weight in relation to the total fibre content, coated on one or both sides with kaolin or other inorganic substances, in rolls or in square or rectangular sheets, of any size, weighing <= 150 g/m² and paper; vegetable parchment, in rolls or sheets lagged somewhat behind, together comprising a further 44%.
Import Prices by Country
In August 2023, the wrapping papers price stood at $1,154 per ton (CIF, Poland), picking up by 2.3% against the previous month. In general, the import price, however, saw a slight curtailment. The pace of growth was the most pronounced in January 2023 when the average import price increased by 7.1% m-o-m. Over the period under review, average import prices hit record highs at $1,349 per ton in September 2022; however, from October 2022 to August 2023, import prices stood at a somewhat lower figure.
There were significant differences in the average prices amongst the major supplying countries. In August 2023, the country with the highest price was France ($2,325 per ton), while the price for Germany ($926 per ton) was amongst the lowest.
From August 2022 to August 2023, the most notable rate of growth in terms of prices was attained by France (+1.0%), while the prices for the other major suppliers experienced more modest paces of growth.
This report provides an in-depth analysis of the wrapping papers market in Poland. Within it, you will discover the latest data on market trends and opportunities by country, consumption, production and price developments, as well as the global trade (imports and exports). The forecast exhibits the market prospects through 2030.
Product coverage:
- FCL 1621 - Wrapping papers
Country coverage:
- Poland
Data coverage:
- Market volume and value
- Per Capita consumption
- Forecast of the market dynamics in the medium term
- Trade (exports and imports) in Poland
- Export and import prices
- Market trends, drivers and restraints
- Key market players and their profiles
Reasons to buy this report:
- Take advantage of the latest data
- Find deeper insights into current market developments
- Discover vital success factors affecting the market
This report is designed for manufacturers, distributors, importers, and wholesalers, as well as for investors, consultants and advisors.
In this report, you can find information that helps you to make informed decisions on the following issues:
- How to diversify your business and benefit from new market opportunities
- How to load your idle production capacity
- How to boost your sales on overseas markets
- How to increase your profit margins
- How to make your supply chain more sustainable
- How to reduce your production and supply chain costs
- How to outsource production to other countries
- How to prepare your business for global expansion
While doing this research, we combine the accumulated expertise of our analysts and the capabilities of artificial intelligence. The AI-based platform, developed by our data scientists, constitutes the key working tool for business analysts, empowering them to discover deep insights and ideas from the marketing data.
-
1. INTRODUCTION
Making Data-Driven Decisions to Grow Your Business
- REPORT DESCRIPTION
- RESEARCH METHODOLOGY AND AI PLATFORM
- DATA-DRIVEN DECISIONS FOR YOUR BUSINESS
- GLOSSARY AND SPECIFIC TERMS
-
2. EXECUTIVE SUMMARY
A Quick Overview of Market Performance
- KEY FINDINGS
- MARKET TRENDS This Chapter is Available Only for the Professional Edition PRO
-
3. MARKET OVERVIEW
Understanding the Current State of The Market and Its Prospects
- MARKET SIZE
- MARKET STRUCTURE
- TRADE BALANCE
- PER CAPITA CONSUMPTION
- MARKET FORECAST TO 2030
-
4. MOST PROMISING PRODUCT
Finding New Products to Diversify Your Business
This Chapter is Available Only for the Professional Edition PRO- TOP PRODUCTS TO DIVERSIFY YOUR BUSINESS
- BEST-SELLING PRODUCTS
- MOST CONSUMED PRODUCT
- MOST TRADED PRODUCT
- MOST PROFITABLE PRODUCT FOR EXPORT
-
5. MOST PROMISING SUPPLYING COUNTRIES
Choosing the Best Countries to Establish Your Sustainable Supply Chain
This Chapter is Available Only for the Professional Edition PRO- TOP COUNTRIES TO SOURCE YOUR PRODUCT
- TOP PRODUCING COUNTRIES
- TOP EXPORTING COUNTRIES
- LOW-COST EXPORTING COUNTRIES
-
6. MOST PROMISING OVERSEAS MARKETS
Choosing the Best Countries to Boost Your Exports
This Chapter is Available Only for the Professional Edition PRO- TOP OVERSEAS MARKETS FOR EXPORTING YOUR PRODUCT
- TOP CONSUMING MARKETS
- UNSATURATED MARKETS
- TOP IMPORTING MARKETS
- MOST PROFITABLE MARKETS
7. PRODUCTION
The Latest Trends and Insights into The Industry
- PRODUCTION VOLUME AND VALUE
8. IMPORTS
The Largest Import Supplying Countries
- IMPORTS FROM 2012–2023
- IMPORTS BY COUNTRY
- IMPORT PRICES BY COUNTRY
9. EXPORTS
The Largest Destinations for Exports
- EXPORTS FROM 2012–2023
- EXPORTS BY COUNTRY
- EXPORT PRICES BY COUNTRY
-
10. PROFILES OF MAJOR PRODUCERS
The Largest Producers on The Market and Their Profiles
This Chapter is Available Only for the Professional Edition PRO -
LIST OF TABLES
- Key Findings In 2023
- Market Volume, In Physical Terms, 2012–2023
- Market Value, 2012–2023
- Per Capita Consumption In 2012-2023
- Imports, In Physical Terms, By Country, 2012–2023
- Imports, In Value Terms, By Country, 2012–2023
- Import Prices, By Country Of Origin, 2012–2023
- Exports, In Physical Terms, By Country, 2012–2023
- Exports, In Value Terms, By Country, 2012–2023
- Export Prices, By Country Of Destination, 2012–2023
-
LIST OF FIGURES
- Market Volume, In Physical Terms, 2012–2023
- Market Value, 2012–2023
- Market Structure – Domestic Supply vs. Imports, In Physical Terms, 2012-2023
- Market Structure – Domestic Supply vs. Imports, In Value Terms, 2012-2023
- Trade Balance, In Physical Terms, 2012-2023
- Trade Balance, In Value Terms, 2012-2023
- Per Capita Consumption, 2012-2023
- Market Volume Forecast to 2030
- Market Value Forecast to 2030
- Products: Market Size And Growth, By Type
- Products: Average Per Capita Consumption, By Type
- Products: Exports And Growth, By Type
- Products: Export Prices And Growth, By Type
- Production Volume And Growth
- Exports And Growth
- Export Prices And Growth
- Market Size And Growth
- Per Capita Consumption
- Imports And Growth
- Import Prices
- Production, In Physical Terms, 2012–2023
- Production, In Value Terms, 2012–2023
- Imports, In Physical Terms, 2012–2023
- Imports, In Value Terms, 2012–2023
- Imports, In Physical Terms, By Country, 2023
- Imports, In Physical Terms, By Country, 2012–2023
- Imports, In Value Terms, By Country, 2012–2023
- Import Prices, By Country Of Origin, 2012–2023
- Exports, In Physical Terms, 2012–2023
- Exports, In Value Terms, 2012–2023
- Exports, In Physical Terms, By Country, 2023
- Exports, In Physical Terms, By Country, 2012–2023
- Exports, In Value Terms, By Country, 2012–2023
- Export Prices, By Country Of Destination, 2012–2023


