World - Bottled Waters - Market Analysis, Forecast, Size, Trends and Insights
Get instant access to more than 2 million reports, dashboards, and datasets on the IndexBox Platform.
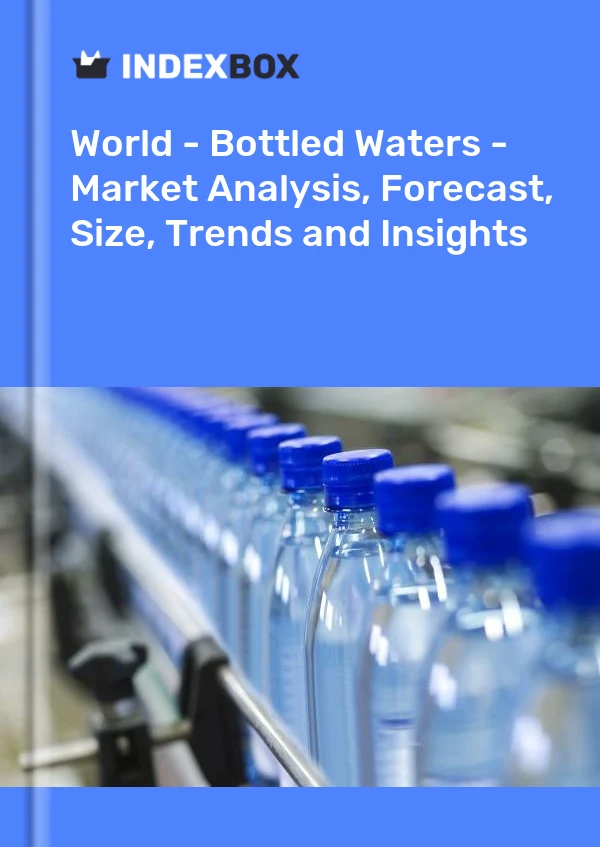
View PricingEnglish Bottled Water Brands
English bottled water brands offer a variety of high-quality and refreshing options for consumers. These brands prioritize sustainability, purity, and taste, making them a popular choice among individuals who value clean and natural water sources.
1. Buxton Natural Mineral Water
Buxton is a well-known English bottled water brand that originates from natural mineral water sources in the Peak District. The water is naturally filtered through limestone, resulting in a pure and delicious taste. Buxton prides itself on using eco-friendly packaging and supports several environmental initiatives.
2. Harrogate Spring Water
Harrogate Spring Water is sourced from an underground aquifer in Harrogate, Yorkshire. The water undergoes a natural filtration process through layers of limestone, ensuring exceptional purity and taste. The brand is committed to sustainability and operates a carbon-neutral facility.
3. Highland Spring
Highland Spring is one of the most popular bottled water brands in the UK. The water originates from protected organic land in the Ochil Hills, Perthshire. Highland Spring is committed to sustainability, using 100% recycled and recyclable materials for their packaging. They also support environmental projects to protect the land around their water source.
4. TyNant
TyNant is a premium Welsh mineral water brand known for its distinctive blue glass bottles. Sourced from the Tywi Valley in Wales, the water is naturally filtered through rock formations, resulting in a pure and refreshing taste. TyNant is a favorite among many celebrities and is often seen at top restaurants and events.
5. Belu
Belu is an ethical English bottled water brand that offers still and sparkling water. The water is sourced from a natural mineral water aquifer in rural Shropshire. Belu is committed to donating 100% of its profits to WaterAid, an international charity working to provide clean water to those in need.
6. Hildon
Hildon is a premium English still and sparkling water brand sourced from underground chalk aquifers in Hampshire. The water is naturally filtered over 50 years, resulting in a balanced pH and unique taste. Hildon places a strong emphasis on sustainability and has received numerous environmental certifications.
7. Ashbeck
Ashbeck is the own-brand bottled water of the UK supermarket, Tesco. The water is sourced from natural springs in the heart of the British countryside. Ashbeck aims to provide great-tasting water at an affordable price while maintaining a commitment to sustainability.
These English bottled water brands showcase the diversity of options available to consumers who value clean and natural water sources. Whether it's mineral water sourced from ancient underground aquifers or eco-friendly brands that support charitable causes, there is a water brand to suit every taste and preference.
This report provides an in-depth analysis of the global bottled water market. Within it, you will discover the latest data on market trends and opportunities by country, consumption, production and price developments, as well as the global trade (imports and exports). The forecast exhibits the market prospects through 2030.
Product coverage:
- Prodcom 11071130 - Mineral waters and aerated waters, unsweetened
- Prodcom 11071150 - Unsweetened and non-flavoured waters, ice and snow (excluding mineral and aerated waters)
Country coverage:
Worldwide - the report contains statistical data for 200 countries and includes detailed profiles of the 50 largest consuming countries:
- USA
- China
- Japan
- Germany
- United Kingdom
- France
- Brazil
- Italy
- Russian Federation
- India
- Canada
- Australia
- Republic of Korea
- Spain
- Mexico
- Indonesia
- Netherlands
- Turkey
- Saudi Arabia
- Switzerland
- Sweden
- Nigeria
- Poland
- Belgium
- Argentina
- Norway
- Austria
- Thailand
- United Arab Emirates
- Colombia
- Denmark
- South Africa
- Malaysia
- Israel
- Singapore
- Egypt
- Philippines
- Finland
- Chile
- Ireland
- Pakistan
- Greece
- Portugal
- Kazakhstan
- Algeria
- Czech Republic
- Qatar
- Peru
- Romania
- Vietnam
+ the largest producing countries
Data coverage:
- Global market volume and value
- Per Capita consumption
- Forecast of the market dynamics in the medium term
- Global production, split by region and country
- Global trade (exports and imports)
- Export and import prices
- Market trends, drivers and restraints
- Key market players and their profiles
Company coverage:
Reasons to buy this report:
- Take advantage of the latest data
- Find deeper insights into current market developments
- Discover vital success factors affecting the market
This report is designed for manufacturers, distributors, importers, and wholesalers, as well as for investors, consultants and advisors.
In this report, you can find information that helps you to make informed decisions on the following issues:
- How to diversify your business and benefit from new market opportunities
- How to load your idle production capacity
- How to boost your sales on overseas markets
- How to increase your profit margins
- How to make your supply chain more sustainable
- How to reduce your production and supply chain costs
- How to outsource production to other countries
- How to prepare your business for global expansion
While doing this research, we combine the accumulated expertise of our analysts and the capabilities of artificial intelligence. The AI-based platform, developed by our data scientists, constitutes the key working tool for business analysts, empowering them to discover deep insights and ideas from the marketing data.
-
1. INTRODUCTION
Making Data-Driven Decisions to Grow Your Business
- REPORT DESCRIPTION
- RESEARCH METHODOLOGY AND AI PLATFORM
- DATA-DRIVEN DECISIONS FOR YOUR BUSINESS
- GLOSSARY AND SPECIFIC TERMS
-
2. EXECUTIVE SUMMARY
A Quick Overview of Market Performance
- KEY FINDINGS
- MARKET TRENDS This Chapter is Available Only for the Professional Edition PRO
-
3. MARKET OVERVIEW
Understanding the Current State of The Market and Its Prospects
- MARKET SIZE
- CONSUMPTION BY COUNTRY
- MARKET FORECAST TO 2030
-
4. MOST PROMISING PRODUCT
Finding New Products to Diversify Your Business
This Chapter is Available Only for the Professional Edition PRO- TOP PRODUCTS TO DIVERSIFY YOUR BUSINESS
- BEST-SELLING PRODUCTS
- MOST CONSUMED PRODUCT
- MOST TRADED PRODUCT
- MOST PROFITABLE PRODUCT FOR EXPORT
-
5. MOST PROMISING SUPPLYING COUNTRIES
Choosing the Best Countries to Establish Your Sustainable Supply Chain
This Chapter is Available Only for the Professional Edition PRO- TOP COUNTRIES TO SOURCE YOUR PRODUCT
- TOP PRODUCING COUNTRIES
- TOP EXPORTING COUNTRIES
- LOW-COST EXPORTING COUNTRIES
-
6. MOST PROMISING OVERSEAS MARKETS
Choosing the Best Countries to Boost Your Exports
This Chapter is Available Only for the Professional Edition PRO- TOP OVERSEAS MARKETS FOR EXPORTING YOUR PRODUCT
- TOP CONSUMING MARKETS
- UNSATURATED MARKETS
- TOP IMPORTING MARKETS
- MOST PROFITABLE MARKETS
7. GLOBAL PRODUCTION
The Latest Trends and Insights into The Industry
- PRODUCTION VOLUME AND VALUE
- PRODUCTION BY COUNTRY
8. GLOBAL IMPORTS
The Largest Importers on The Market and How They Succeed
- IMPORTS FROM 2012–2023
- IMPORTS BY COUNTRY
- IMPORT PRICES BY COUNTRY
9. GLOBAL EXPORTS
The Largest Exporters on The Market and How They Succeed
- EXPORTS FROM 2012–2023
- EXPORTS BY COUNTRY
- EXPORT PRICES BY COUNTRY
-
10. PROFILES OF MAJOR PRODUCERS
The Largest Producers on The Market and Their Profiles
This Chapter is Available Only for the Professional Edition PRO -
11. COUNTRY PROFILES
The Largest Markets And Their Profiles
This Chapter is Available Only for the Professional Edition PRO- United States
- China
- Japan
- Germany
- United Kingdom
- France
- Brazil
- Italy
- Russian Federation
- India
- Canada
- Australia
- Republic of Korea
- Spain
- Mexico
- Indonesia
- Netherlands
- Turkey
- Saudi Arabia
- Switzerland
- Sweden
- Nigeria
- Poland
- Belgium
- Argentina
- Norway
- Austria
- Thailand
- United Arab Emirates
- Colombia
- Denmark
- South Africa
- Malaysia
- Israel
- Singapore
- Egypt
- Philippines
- Finland
- Chile
- Ireland
- Pakistan
- Greece
- Portugal
- Kazakhstan
- Algeria
- Czech Republic
- Qatar
- Peru
- Romania
- Vietnam
-
LIST OF TABLES
- Key Findings In 2023
- Market Volume, In Physical Terms, 2012–2023
- Market Value, 2012–2023
- Per Capita Consumption, By Country, 2018–2023
- Production, In Physical Terms, By Country, 2012–2023
- Imports, In Physical Terms, By Country, 2012–2023
- Imports, In Value Terms, By Country, 2012–2023
- Import Prices, By Country Of Destination, 2012–2023
- Exports, In Physical Terms, By Country, 2012–2023
- Exports, In Value Terms, By Country, 2012–2023
- Export Prices, By Country Of Origin, 2012–2023
-
LIST OF FIGURES
- Market Volume, In Physical Terms, 2012–2023
- Market Value, 2012–2023
- Consumption, By Country, 2023
- Market Volume Forecast to 2030
- Market Value Forecast to 2030
- Products: Market Size And Growth, By Type
- Products: Average Per Capita Consumption, By Type
- Products: Exports And Growth, By Type
- Products: Export Prices And Growth, By Type
- Production Volume And Growth
- Exports And Growth
- Export Prices And Growth
- Market Size And Growth
- Per Capita Consumption
- Imports And Growth
- Import Prices
- Production, In Physical Terms, 2012–2023
- Production, In Value Terms, 2012–2023
- Production, By Country, 2023
- Production, In Physical Terms, By Country, 2012–2023
- Imports, In Physical Terms, 2012–2023
- Imports, In Value Terms, 2012–2023
- Imports, In Physical Terms, By Country, 2023
- Imports, In Physical Terms, By Country, 2012–2023
- Imports, In Value Terms, By Country, 2012–2023
- Import Prices, By Country, 2012–2023
- Exports, In Physical Terms, 2012–2023
- Exports, In Value Terms, 2012–2023
- Exports, In Physical Terms, By Country, 2023
- Exports, In Physical Terms, By Country, 2012–2023
- Exports, In Value Terms, By Country, 2012–2023
- Export Prices, 2012–2023
This report provides an in-depth analysis of the global bottled water market.
This report provides an in-depth analysis of the global market for mineral or aerated water.
This report provides an in-depth analysis of the global market for non-mineral or non-aerated water.
Explore the top import markets for bottled water around the world, including the United States, Hong Kong, Belgium, and more. Discover key statistics and trends in the global bottled water industry.
From the rise of premium and functional waters to the growing demand for sustainable packaging, the bottled water market is constantly evolving. In this article, we'll dive into the latest consumer trends and insights, as well as highlight the top companies in the industry.
The global bottled water market revenue amounted to $144.2B in 2017, surging by 29% against the previous year. This figure...
Discover the leading countries in importing mineral or aerated water and the opportunities they offer for water manufacturers.
The global mineral water market revenue amounted to $133.5B in 2017, picking up by 11% against the previous year. This fig...
In value terms, mineral substances imports stood at $X in 2016. The total import value increased at an average annual rate of +X% from 2007 to 2016; the trend pattern indicated some noticeable fl...
In value terms, mineral substances exports stood at $X in 2016. The total export value increased at an average annual rate of +X% from 2007 to 2016; however, the trend pattern indicated some noti...
In 2016, approx. X tons of bottled water were imported worldwide- flattening at the previous year level. In general, bottled water imports continue to indicate a modest expansion. The pace of gro...
In 2016, approx. X tons of bottled water were imported worldwide- flattening at the previous year level. In general, bottled water imports continue to indicate a modest expansion. The pace of gro...
According to the medical community, at least eight X oz glasses of water should be consumed daily in order to avoid dehydration. However, French mineral water company Vittel carried out research revealing that X percent of the French do not drink this


