World - Dairy Produce - Market Analysis, Forecast, Size, Trends and Insights
Get instant access to more than 2 million reports, dashboards, and datasets on the IndexBox Platform.
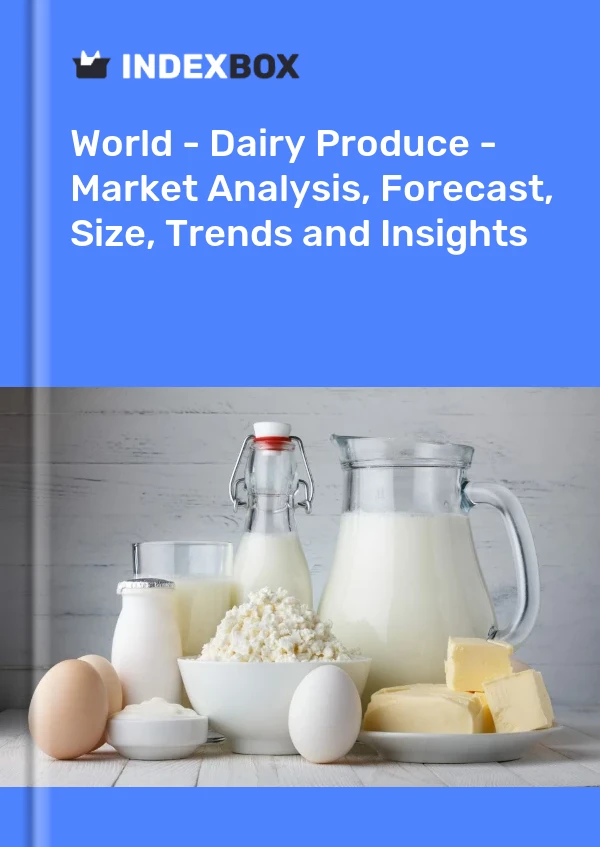
View PricingDairy Goat Milk
Dairy goat milk is the milk produced by female goats. It is widely consumed as a nutritious and wholesome alternative to cow's milk. Goat milk has been consumed for centuries and is known for its rich flavor, smooth texture, and numerous health benefits.
One of the key advantages of goat milk is its digestibility. Compared to cow's milk, goat milk has smaller fat globules and a higher proportion of certain proteins, making it easier for the body to break down and absorb. This makes it an excellent option for individuals with sensitive or lactose-intolerant digestive systems.
In addition to being easy to digest, goat milk is packed with nutrients. It is a great source of vitamins and minerals such as calcium, phosphorus, potassium, and vitamin D. These nutrients play a vital role in maintaining bone health, promoting heart health, and supporting the immune system.
Goat milk also contains fatty acids, which are essential for brain development and overall growth. It is particularly rich in medium-chain fatty acids, which are more easily metabolized and provide a quick source of energy.
Furthermore, goat milk is often favored by people with allergies. Unlike cow's milk, it contains different proteins, which can be less allergenic. It has been found to cause fewer allergic reactions and is often well-tolerated by those with milk allergies or intolerances.
Interestingly, the composition of goat milk can vary based on the breed of goat, their diet, and environmental factors. This can influence the taste and texture of the milk, resulting in a wide range of flavors from sweet to slightly tangy.
In conclusion, dairy goat milk is a delicious and nutritious alternative to cow's milk. It is easy to digest, rich in nutrients, and can be a suitable option for individuals with lactose intolerance or milk allergies. Whether enjoyed on its own, used in cooking, or as a base for dairy products like cheese and yogurt, goat milk offers a versatile and healthy choice for dairy lovers.
This report provides an in-depth analysis of the global dairy produce market. Within it, you will discover the latest data on market trends and opportunities by country, consumption, production and price developments, as well as the global trade (imports and exports). The forecast exhibits the market prospects through 2030.
Product coverage:
- FCL 888 - Skim Milk of Cows
- FCL 1130 - Camel milk
- FCL 882 - Cow milk, whole (fresh)
- FCL 1020 - Goat milk
- FCL 982 - Sheep milk
- FCL 951 - Buffalo milk
- FCL 897 - Dry Whole Cow Milk
- FCL 898 - Dry Skim Cow Milk
- FCL 889 - Whole Milk, Condensed
- FCL 894 - Whole Milk, Evaporated
- FCL 895 - Skim Milk, Evaporated
- FCL 896 - Skim Milk, Condensed
- FCL 891 - Yoghurt
- FCL 983 - Butter and Ghee of Sheep Milk
- FCL 1022 - Butter of Goat Milk
- FCL 952 - Butter of Buffalo Milk
- FCL 886 - Butter of Cow Milk
- FCL 887 - Ghee from Cow Milk
- FCL 953 - Ghee, from Buffalo Milk
- FCL 901 - Cheese from Whole Cow Milk
- FCL 904 - Cheese from Skimmed Cow Milk
- FCL 905 - Whey Cheese
- FCL 907 - Processed Cheese
- FCL 955 - Cheese of Buffalo Milk
- FCL 984 - Cheese of Sheep Milk
- FCL 1021 - Cheese of Goat Milk
- FCL 885 - Cream, Fresh
- FCL 893 - Buttermilk, Curdled Milk, Acidified Milk
- FCL 899 - Dry Buttermilk
- FCL 892 - Yoghurt, Concentrated or Unconcent
Country coverage:
Worldwide - the report contains statistical data for 200 countries and includes detailed profiles of the 50 largest consuming countries:
- USA
- China
- Japan
- Germany
- United Kingdom
- France
- Brazil
- Italy
- Russian Federation
- India
- Canada
- Australia
- Republic of Korea
- Spain
- Mexico
- Indonesia
- Netherlands
- Turkey
- Saudi Arabia
- Switzerland
- Sweden
- Nigeria
- Poland
- Belgium
- Argentina
- Norway
- Austria
- Thailand
- United Arab Emirates
- Colombia
- Denmark
- South Africa
- Malaysia
- Israel
- Singapore
- Egypt
- Philippines
- Finland
- Chile
- Ireland
- Pakistan
- Greece
- Portugal
- Kazakhstan
- Algeria
- Czech Republic
- Qatar
- Peru
- Romania
- Vietnam
+ the largest producing countries
Data coverage:
- Global market volume and value
- Per Capita consumption
- Forecast of the market dynamics in the medium term
- Global production, split by region and country
- Global trade (exports and imports)
- Export and import prices
- Market trends, drivers and restraints
- Key market players and their profiles
Company coverage:
Reasons to buy this report:
- Take advantage of the latest data
- Find deeper insights into current market developments
- Discover vital success factors affecting the market
This report is designed for manufacturers, distributors, importers, and wholesalers, as well as for investors, consultants and advisors.
In this report, you can find information that helps you to make informed decisions on the following issues:
- How to diversify your business and benefit from new market opportunities
- How to load your idle production capacity
- How to boost your sales on overseas markets
- How to increase your profit margins
- How to make your supply chain more sustainable
- How to reduce your production and supply chain costs
- How to outsource production to other countries
- How to prepare your business for global expansion
While doing this research, we combine the accumulated expertise of our analysts and the capabilities of artificial intelligence. The AI-based platform, developed by our data scientists, constitutes the key working tool for business analysts, empowering them to discover deep insights and ideas from the marketing data.
-
1. INTRODUCTION
Making Data-Driven Decisions to Grow Your Business
- REPORT DESCRIPTION
- RESEARCH METHODOLOGY AND AI PLATFORM
- DATA-DRIVEN DECISIONS FOR YOUR BUSINESS
- GLOSSARY AND SPECIFIC TERMS
-
2. EXECUTIVE SUMMARY
A Quick Overview of Market Performance
- KEY FINDINGS
- MARKET TRENDS This Chapter is Available Only for the Professional Edition PRO
-
3. MARKET OVERVIEW
Understanding the Current State of The Market and Its Prospects
- MARKET SIZE
- CONSUMPTION BY COUNTRY
- MARKET FORECAST TO 2030
-
4. MOST PROMISING PRODUCT
Finding New Products to Diversify Your Business
This Chapter is Available Only for the Professional Edition PRO- TOP PRODUCTS TO DIVERSIFY YOUR BUSINESS
- BEST-SELLING PRODUCTS
- MOST CONSUMED PRODUCT
- MOST TRADED PRODUCT
- MOST PROFITABLE PRODUCT FOR EXPORT
-
5. MOST PROMISING SUPPLYING COUNTRIES
Choosing the Best Countries to Establish Your Sustainable Supply Chain
This Chapter is Available Only for the Professional Edition PRO- TOP COUNTRIES TO SOURCE YOUR PRODUCT
- TOP PRODUCING COUNTRIES
- TOP EXPORTING COUNTRIES
- LOW-COST EXPORTING COUNTRIES
-
6. MOST PROMISING OVERSEAS MARKETS
Choosing the Best Countries to Boost Your Exports
This Chapter is Available Only for the Professional Edition PRO- TOP OVERSEAS MARKETS FOR EXPORTING YOUR PRODUCT
- TOP CONSUMING MARKETS
- UNSATURATED MARKETS
- TOP IMPORTING MARKETS
- MOST PROFITABLE MARKETS
7. GLOBAL PRODUCTION
The Latest Trends and Insights into The Industry
- PRODUCTION VOLUME AND VALUE
- PRODUCTION BY COUNTRY
8. GLOBAL IMPORTS
The Largest Importers on The Market and How They Succeed
- IMPORTS FROM 2012–2023
- IMPORTS BY COUNTRY
- IMPORT PRICES BY COUNTRY
9. GLOBAL EXPORTS
The Largest Exporters on The Market and How They Succeed
- EXPORTS FROM 2012–2023
- EXPORTS BY COUNTRY
- EXPORT PRICES BY COUNTRY
-
10. PROFILES OF MAJOR PRODUCERS
The Largest Producers on The Market and Their Profiles
This Chapter is Available Only for the Professional Edition PRO -
11. COUNTRY PROFILES
The Largest Markets And Their Profiles
This Chapter is Available Only for the Professional Edition PRO- United States
- China
- Japan
- Germany
- United Kingdom
- France
- Brazil
- Italy
- Russian Federation
- India
- Canada
- Australia
- Republic of Korea
- Spain
- Mexico
- Indonesia
- Netherlands
- Turkey
- Saudi Arabia
- Switzerland
- Sweden
- Nigeria
- Poland
- Belgium
- Argentina
- Norway
- Austria
- Thailand
- United Arab Emirates
- Colombia
- Denmark
- South Africa
- Malaysia
- Israel
- Singapore
- Egypt
- Philippines
- Finland
- Chile
- Ireland
- Pakistan
- Greece
- Portugal
- Kazakhstan
- Algeria
- Czech Republic
- Qatar
- Peru
- Romania
- Vietnam
-
LIST OF TABLES
- Key Findings In 2023
- Market Volume, In Physical Terms, 2012–2023
- Market Value, 2012–2023
- Per Capita Consumption, By Country, 2018–2023
- Production, In Physical Terms, By Country, 2012–2023
- Imports, In Physical Terms, By Country, 2012–2023
- Imports, In Value Terms, By Country, 2012–2023
- Import Prices, By Country Of Destination, 2012–2023
- Exports, In Physical Terms, By Country, 2012–2023
- Exports, In Value Terms, By Country, 2012–2023
- Export Prices, By Country Of Origin, 2012–2023
-
LIST OF FIGURES
- Market Volume, In Physical Terms, 2012–2023
- Market Value, 2012–2023
- Consumption, By Country, 2023
- Market Volume Forecast to 2030
- Market Value Forecast to 2030
- Products: Market Size And Growth, By Type
- Products: Average Per Capita Consumption, By Type
- Products: Exports And Growth, By Type
- Products: Export Prices And Growth, By Type
- Production Volume And Growth
- Exports And Growth
- Export Prices And Growth
- Market Size And Growth
- Per Capita Consumption
- Imports And Growth
- Import Prices
- Production, In Physical Terms, 2012–2023
- Production, In Value Terms, 2012–2023
- Production, By Country, 2023
- Production, In Physical Terms, By Country, 2012–2023
- Imports, In Physical Terms, 2012–2023
- Imports, In Value Terms, 2012–2023
- Imports, In Physical Terms, By Country, 2023
- Imports, In Physical Terms, By Country, 2012–2023
- Imports, In Value Terms, By Country, 2012–2023
- Import Prices, By Country, 2012–2023
- Exports, In Physical Terms, 2012–2023
- Exports, In Value Terms, 2012–2023
- Exports, In Physical Terms, By Country, 2023
- Exports, In Physical Terms, By Country, 2012–2023
- Exports, In Value Terms, By Country, 2012–2023
- Export Prices, 2012–2023
This report provides an in-depth analysis of the global dairy produce market.
This report provides an in-depth analysis of the global butter and ghee market.
This report provides an in-depth analysis of the global ghee market.
This report provides an in-depth analysis of the global butter market.
This report provides an in-depth analysis of the global market for butter and dairy spreads.
This report provides an in-depth analysis of the global dairy spread market.
Global butter and ghee consumption amounted to X thousand tons in 2015, remaining constant against the previous year level.
Global butter and ghee exports amounted to X thousand tons in 2015, coming down by -X% against the previous year level.
Global butter and ghee imports amounted to X thousand tons in 2015, descending by -X% against the previous year level.
In 2015, the countries with the highest levels of butter and ghee production were Turkey (X thousand tons), Iran (X thousand tons), Syria (X thousand tons), together accounting for X% of total output.
The global butter and ghee market fluctuated wildly, finally rising from X billion USD in 2007 to X billion USD in 2015.
The market of butter and ghee fluctuated wildly, finally rising from X billion USD in 2007 to X billion USD in 2015. Over the last year, the market dropped by X% in value terms.
New Zealand seized control of the butter and ghee market. In 2014, New Zealand exported X thousand tons of butter and ghee totaling X USD, X% over the previous year. Its primary trading partner was China, where it supplied X% of its total but
New Zealand continued its dominance in the global ghee trade. In 2014, New Zealand exported X thousand tons of ghee totaling X million USD, X% over the previous year. Its primary trading partner was China, where it supplied X% of its total ghee
This year global butter production is anticipated to keep up with ha last year, amounting to 5.6M tons. The EU is forecast to decrease butter exports due to a slight drop in production amid an increase in demand. Butter exports from New Zealand are not forecast to grow due to increased competition with UHT cream for food service being increasingly in demand.
The global trade in butter amounted to X million USD in 2015, fluctuating wildly over the period under review. A significant drop in 2009 was followed by a recovery over the next two years, until exports decreased again


