
Italy - Yarn Of Wool - Market Analysis, Forecast, Size, Trends and Insights
Get instant access to more than 2 million reports, dashboards, and datasets on the IndexBox Platform.
View PricingItaly's 2023 Export of Woolen Yarn Hits An Average of $612M
Italy Woolen Yarn Exports
In 2023, overseas shipments of yarn of wool decreased by -9.9% to 19K tons for the first time since 2020, thus ending a two-year rising trend. Over the period under review, exports saw a noticeable slump. The pace of growth was the most pronounced in 2021 when exports increased by 25% against the previous year. Over the period under review, the exports reached the maximum at 27K tons in 2013; however, from 2014 to 2023, the exports stood at a somewhat lower figure.
In value terms, woolen yarn exports shrank modestly to $612M (IndexBox estimates) in 2023. In general, exports saw a slight slump. The pace of growth appeared the most rapid in 2021 when exports increased by 32% against the previous year. The exports peaked at $706M in 2013; however, from 2014 to 2023, the exports stood at a somewhat lower figure.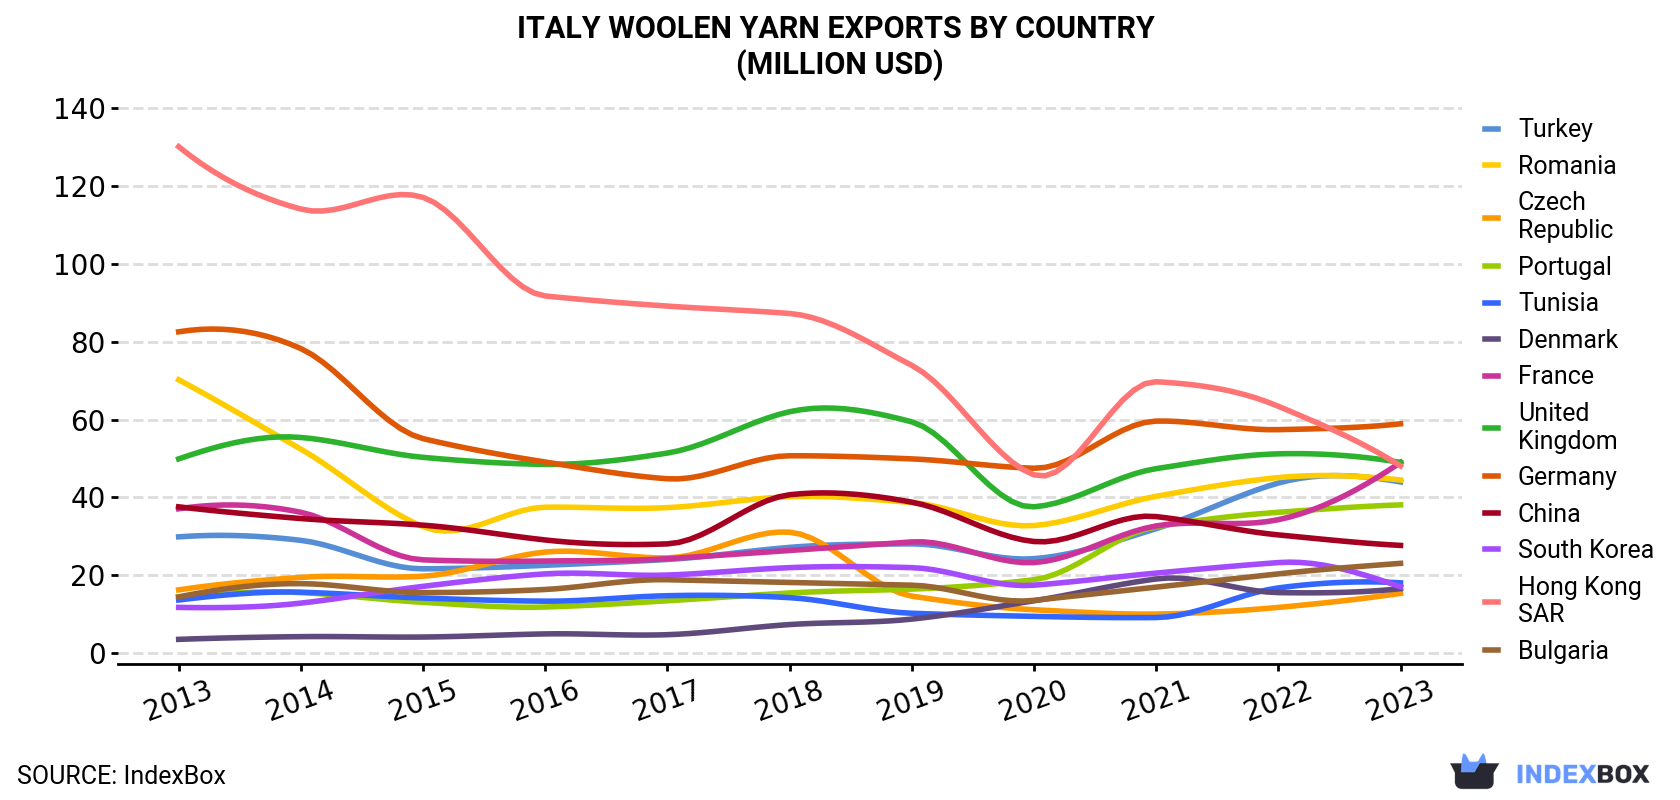
| COUNTRY | Export Value of Woolen Yarn in Italy (million USD) | ||||||||||
|---|---|---|---|---|---|---|---|---|---|---|---|
| 2013 | 2014 | 2015 | 2016 | 2017 | 2018 | 2019 | 2020 | 2021 | 2022 | 2023 | |
| Germany | 82.5 | 78.2 | 55.1 | 49.1 | 44.8 | 50.7 | 49.9 | 47.5 | 59.6 | 57.4 | 58.9 |
| France | 37.1 | 36.2 | 24.0 | 23.7 | 24.3 | 26.4 | 28.6 | 23.3 | 32.7 | 34.3 | 49.0 |
| United Kingdom | 49.9 | 55.4 | 50.3 | 48.5 | 51.4 | 62.0 | 59.4 | 37.6 | 47.4 | 51.2 | 49.0 |
| Hong Kong | 130 | 114 | 117 | 91.7 | 89.1 | 87.2 | 73.9 | 45.8 | 69.7 | 63.4 | 48.1 |
| Romania | 70.2 | 52.4 | 32.5 | 37.5 | 37.4 | 40.2 | 38.7 | 32.8 | 40.3 | 45.1 | 44.5 |
| Turkey | 29.9 | 29.0 | 21.7 | 22.6 | 24.1 | 27.2 | 28.1 | 24.3 | 32.0 | 43.7 | 44.0 |
| Portugal | 14.5 | 15.6 | 13.1 | 11.9 | 13.5 | 15.5 | 16.5 | 18.9 | 32.5 | 36.2 | 38.1 |
| China | 37.6 | 34.6 | 32.9 | 29.1 | 28.1 | 40.7 | 38.8 | 28.7 | 35.1 | 30.4 | 27.7 |
| Bulgaria | 14.5 | 17.9 | 15.6 | 16.4 | 18.9 | 18.2 | 17.5 | 13.6 | 17.0 | 20.4 | 23.1 |
| Tunisia | 13.7 | 15.7 | 14.2 | 13.4 | 14.8 | 14.3 | 10.3 | 9.5 | 9.2 | 16.8 | 18.1 |
| South Korea | 11.8 | 12.9 | 17.2 | 20.4 | 20.1 | 22.0 | 22.0 | 17.5 | 20.6 | 23.3 | 17.1 |
| Denmark | 3.6 | 4.3 | 4.2 | 5.0 | 4.8 | 7.4 | 8.8 | 13.5 | 19.1 | 15.6 | 16.6 |
| Czech Republic | 16.3 | 19.5 | 19.8 | 26.0 | 24.5 | 31.1 | 14.7 | 11.2 | 10.1 | 11.8 | 15.4 |
| Others | 195 | 190 | 152 | 148 | 163 | 177 | 158 | 129 | 174 | 165 | 162 |
| Total | 706 | 676 | 570 | 543 | 559 | 620 | 566 | 453 | 599 | 615 | 612 |
Exports by Country
the UK (2.4K tons), Portugal (1.9K tons) and Germany (1.7K tons) were the main destinations of woolen yarn exports from Italy, together comprising 32% of total exports. Turkey, Romania, France, Tunisia, Hong Kong, Bulgaria, the Czech Republic, Denmark, China and South Korea lagged somewhat behind, together comprising a further 38%.
From 2013 to 2023, the biggest increases were recorded for Denmark (with a CAGR of +9.8%), while shipments for the other leaders experienced more modest paces of growth.
In value terms, Germany ($59M), France ($49M) and the UK ($49M) were the largest markets for woolen yarn exported from Italy worldwide, with a combined 26% share of total exports. Hong Kong, Romania, Turkey, Portugal, China, Bulgaria, Tunisia, South Korea, Denmark and the Czech Republic lagged somewhat behind, together comprising a further 48%.
In terms of the main countries of destination, Denmark, with a CAGR of +16.4%, recorded the highest growth rate of the value of exports, over the period under review, while shipments for the other leaders experienced more modest paces of growth.
Exports by Type
Yarn of combed wool, not put up for retail sale (7.7K tons), yarn of carded wool, not put up for retail sale (6.7K tons) and yarn of wool or of fine animal hair, put up for retail sale (2.9K tons) were the main products of woolen yarn exports from Italy, with a combined 93% share of total exports. Yarn of fine animal hair (carded or combed), not put up for retail sale and yarn of coarse animal hair or of horsehair (including gimped horsehair yarn), whether or not put up for retail sale lagged somewhat behind, together comprising a further 6.8%.
From 2013 to 2023, the most notable rate of growth in terms of shipments, amongst the major product types, was attained by yarn of coarse animal hair or of horsehair (including gimped horsehair yarn), whether or not put up for retail sale (with a CAGR of +12.7%), while the other products experienced mixed trend patterns.
In value terms, yarn of wool with the largest exports in Italy were yarn of combed wool, not put up for retail sale ($245M), yarn of carded wool, not put up for retail sale ($150M) and yarn of fine animal hair (carded or combed), not put up for retail sale ($122M), together accounting for 85% of total exports. Yarn of wool or of fine animal hair, put up for retail sale and yarn of coarse animal hair or of horsehair (including gimped horsehair yarn), whether or not put up for retail sale lagged somewhat behind, together accounting for a further 15%.
Yarn of coarse animal hair or of horsehair (including gimped horsehair yarn), whether or not put up for retail sale, with a CAGR of +15.7%, saw the highest growth rate of the value of exports, in terms of the main product categories over the period under review, while shipments for the other products experienced mixed trend patterns.
Export Prices by Country
In 2023, the woolen yarn price stood at $32,878 per ton (FOB, Italy), surging by 11% against the previous year. Over the period from 2013 to 2023, it increased at an average annual rate of +2.2%. The most prominent rate of growth was recorded in 2018 when the average export price increased by 13% against the previous year. Over the period under review, the average export prices attained the peak figure in 2023 and is expected to retain growth in years to come.
There were significant differences in the average prices for the major export markets. In 2023, amid the top suppliers, the country with the highest price was Hong Kong ($58,750 per ton), while the average price for exports to the Netherlands ($7,828 per ton) was amongst the lowest.
From 2013 to 2023, the most notable rate of growth in terms of prices was recorded for supplies to Romania (+5.7%), while the prices for the other major destinations experienced more modest paces of growth.
This report provides an in-depth analysis of the woolen yarn market in Italy. Within it, you will discover the latest data on market trends and opportunities by country, consumption, production and price developments, as well as the global trade (imports and exports). The forecast exhibits the market prospects through 2030.
Product coverage:
- Prodcom 13105010 - Yarn of carded wool or fine animal hair, n.p.r.s.
- Prodcom 13105030 - Yarn of combed wool or fine animal hair, n.p.r.s.
- Prodcom 13105050 - Yarn of wool or fine animal hair, p.r.s.
Country coverage:
- Italy
Data coverage:
- Market volume and value
- Per Capita consumption
- Forecast of the market dynamics in the medium term
- Trade (exports and imports) in Italy
- Export and import prices
- Market trends, drivers and restraints
- Key market players and their profiles
Reasons to buy this report:
- Take advantage of the latest data
- Find deeper insights into current market developments
- Discover vital success factors affecting the market
This report is designed for manufacturers, distributors, importers, and wholesalers, as well as for investors, consultants and advisors.
In this report, you can find information that helps you to make informed decisions on the following issues:
- How to diversify your business and benefit from new market opportunities
- How to load your idle production capacity
- How to boost your sales on overseas markets
- How to increase your profit margins
- How to make your supply chain more sustainable
- How to reduce your production and supply chain costs
- How to outsource production to other countries
- How to prepare your business for global expansion
While doing this research, we combine the accumulated expertise of our analysts and the capabilities of artificial intelligence. The AI-based platform, developed by our data scientists, constitutes the key working tool for business analysts, empowering them to discover deep insights and ideas from the marketing data.
-
1. INTRODUCTION
Making Data-Driven Decisions to Grow Your Business
- REPORT DESCRIPTION
- RESEARCH METHODOLOGY AND AI PLATFORM
- DATA-DRIVEN DECISIONS FOR YOUR BUSINESS
- GLOSSARY AND SPECIFIC TERMS
-
2. EXECUTIVE SUMMARY
A Quick Overview of Market Performance
- KEY FINDINGS
- MARKET TRENDS This Chapter is Available Only for the Professional Edition PRO
-
3. MARKET OVERVIEW
Understanding the Current State of The Market and Its Prospects
- MARKET SIZE
- MARKET STRUCTURE
- TRADE BALANCE
- PER CAPITA CONSUMPTION
- MARKET FORECAST TO 2030
-
4. MOST PROMISING PRODUCT
Finding New Products to Diversify Your Business
This Chapter is Available Only for the Professional Edition PRO- TOP PRODUCTS TO DIVERSIFY YOUR BUSINESS
- BEST-SELLING PRODUCTS
- MOST CONSUMED PRODUCT
- MOST TRADED PRODUCT
- MOST PROFITABLE PRODUCT FOR EXPORT
-
5. MOST PROMISING SUPPLYING COUNTRIES
Choosing the Best Countries to Establish Your Sustainable Supply Chain
This Chapter is Available Only for the Professional Edition PRO- TOP COUNTRIES TO SOURCE YOUR PRODUCT
- TOP PRODUCING COUNTRIES
- TOP EXPORTING COUNTRIES
- LOW-COST EXPORTING COUNTRIES
-
6. MOST PROMISING OVERSEAS MARKETS
Choosing the Best Countries to Boost Your Exports
This Chapter is Available Only for the Professional Edition PRO- TOP OVERSEAS MARKETS FOR EXPORTING YOUR PRODUCT
- TOP CONSUMING MARKETS
- UNSATURATED MARKETS
- TOP IMPORTING MARKETS
- MOST PROFITABLE MARKETS
7. PRODUCTION
The Latest Trends and Insights into The Industry
- PRODUCTION VOLUME AND VALUE
8. IMPORTS
The Largest Import Supplying Countries
- IMPORTS FROM 2012–2023
- IMPORTS BY COUNTRY
- IMPORT PRICES BY COUNTRY
9. EXPORTS
The Largest Destinations for Exports
- EXPORTS FROM 2012–2023
- EXPORTS BY COUNTRY
- EXPORT PRICES BY COUNTRY
-
10. PROFILES OF MAJOR PRODUCERS
The Largest Producers on The Market and Their Profiles
This Chapter is Available Only for the Professional Edition PRO -
LIST OF TABLES
- Key Findings In 2023
- Market Volume, In Physical Terms, 2012–2023
- Market Value, 2012–2023
- Per Capita Consumption In 2012-2023
- Imports, In Physical Terms, By Country, 2012–2023
- Imports, In Value Terms, By Country, 2012–2023
- Import Prices, By Country Of Origin, 2012–2023
- Exports, In Physical Terms, By Country, 2012–2023
- Exports, In Value Terms, By Country, 2012–2023
- Export Prices, By Country Of Destination, 2012–2023
-
LIST OF FIGURES
- Market Volume, In Physical Terms, 2012–2023
- Market Value, 2012–2023
- Market Structure – Domestic Supply vs. Imports, In Physical Terms, 2012-2023
- Market Structure – Domestic Supply vs. Imports, In Value Terms, 2012-2023
- Trade Balance, In Physical Terms, 2012-2023
- Trade Balance, In Value Terms, 2012-2023
- Per Capita Consumption, 2012-2023
- Market Volume Forecast to 2030
- Market Value Forecast to 2030
- Products: Market Size And Growth, By Type
- Products: Average Per Capita Consumption, By Type
- Products: Exports And Growth, By Type
- Products: Export Prices And Growth, By Type
- Production Volume And Growth
- Exports And Growth
- Export Prices And Growth
- Market Size And Growth
- Per Capita Consumption
- Imports And Growth
- Import Prices
- Production, In Physical Terms, 2012–2023
- Production, In Value Terms, 2012–2023
- Imports, In Physical Terms, 2012–2023
- Imports, In Value Terms, 2012–2023
- Imports, In Physical Terms, By Country, 2023
- Imports, In Physical Terms, By Country, 2012–2023
- Imports, In Value Terms, By Country, 2012–2023
- Import Prices, By Country Of Origin, 2012–2023
- Exports, In Physical Terms, 2012–2023
- Exports, In Value Terms, 2012–2023
- Exports, In Physical Terms, By Country, 2023
- Exports, In Physical Terms, By Country, 2012–2023
- Exports, In Value Terms, By Country, 2012–2023
- Export Prices, By Country Of Destination, 2012–2023


