World - Silk Yarn And Yarn Spun From Silk Waste - Market Analysis, Forecast, Size, Trends and Insights
Get instant access to more than 2 million reports, dashboards, and datasets on the IndexBox Platform.
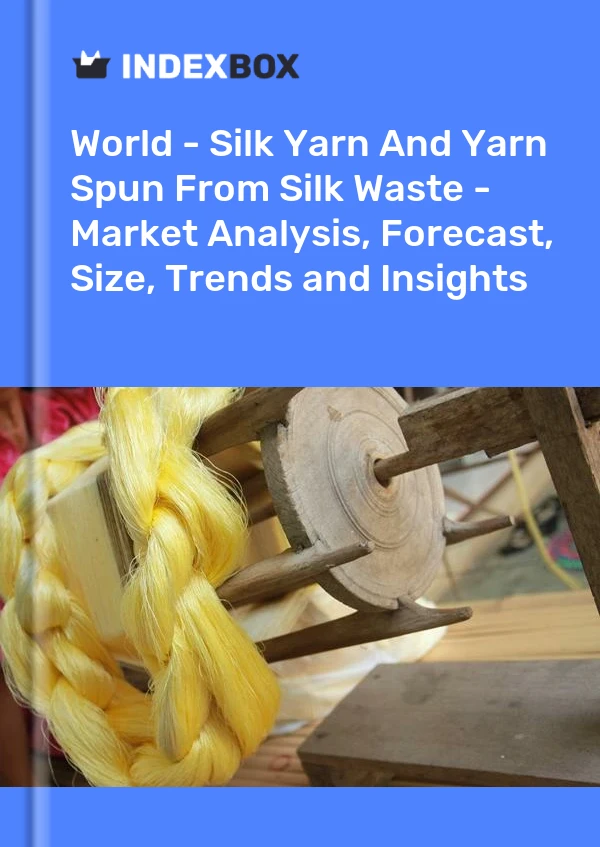
View PricingSilk Yarn Market
Silk yarn market: get access to new datasets empowered by an Ai-driven business intelligence platform. Information provide companies, consumption, trade, production, market prices, imports, exports, and market size. Here is a breakdown by country, including EU, the Middle East, Latin America, Africa, the U.K., China, Russia, and the U.S. Market dynamics and outlook to 2030 are also provided in the dashboards.
Need Silk Yarn Market data? GET FREE ACCESS
Silk Yarn - World's Largest Markets
| Rating | Country |
|---|---|
| 1 | Vietnam |
| 2 | China |
| 3 | India |
| 4 | Germany |
| 5 | United Kingdom |
In value terms, Vietnam, China and India appeared to be the countries with the highest levels of market value in 2020, together accounting for 62% of the global market. Germany, the UK, the United States, Mexico, Indonesia and Brazil lagged somewhat behind, together accounting for a further 16%.
Among the main consuming countries, Mexico recorded the highest rates of growth with regard to market size, over the period under review, while silk yarn market for the other global leaders experienced more modest paces of growth.
Silk Yarn Prices
Lowest Prices - FOB - Top Exporters
| COUNTRY | 2018 | 2019 | 2020 | CAGR, 2018-2020 |
|---|---|---|---|---|
| USD per ton | ||||
| Vietnam | 60162 | 53855 | 40062 | -18.4% |
| China | 49563 | 41100 | 44215 | -5.5% |
| Brazil | 72123 | 74625 | 63345 | -6.3% |
| Romania | 77731 | 71307 | 70273 | -4.9% |
| Slovenia | 56924 | 70365 | 70807 | 11.5% |
| Italy | 71476 | 69175 | 79544 | 5.5% |
| Average | 58034 | 51031 | 52132 | -5.2% |
Prices varied noticeably by the country of origin; the country with the highest price was Italy ($79,544 per ton), while Vietnam ($40,062 per ton) was amongst the lowest.
From 2018 to 2020, the most notable rate of growth in terms of prices was attained by Slovenia, while the other global leaders experienced mixed trends in the export price figures.
Highest Prices - CIF - Top Importers
| COUNTRY | 2018 | 2019 | 2020 | CAGR, 2018-2020 |
|---|---|---|---|---|
| USD per ton | ||||
| Madagascar | 101936 | 102760 | 102392 | 0.2% |
| France | 77547 | 82109 | 87788 | 6.4% |
| Germany | 71959 | 70702 | 73528 | 1.1% |
| Slovenia | 77253 | 66139 | 70573 | -4.4% |
| United States | 59174 | 65425 | 67384 | 6.7% |
| Italy | 69803 | 62874 | 62111 | -5.7% |
| Romania | 60630 | 64767 | 56814 | -3.2% |
| Japan | 58708 | 52597 | 50878 | -6.9% |
| Hong Kong SAR | 47490 | 43333 | 38437 | -10.0% |
| India | 43766 | 33915 | 35875 | -9.5% |
| Pakistan | 21477 | 18865 | 24489 | 6.8% |
| Indonesia | 20701 | 23057 | 20150 | -1.3% |
| Nepal | 22651 | 22809 | 19625 | -6.9% |
| Average | 56478 | 50298 | 50263 | -5.7% |
Prices varied noticeably by the country of destination; the country with the highest price was Madagascar ($102,392 per ton), while Nepal ($19,625 per ton) was amongst the lowest.
From 2018 to 2020, the most notable rate of growth in terms of prices was attained by Pakistan, while the other global leaders experienced more modest paces of growth.
Silk Yarn - Top Importers
| COUNTRY | 2018 | 2019 | 2020 | CAGR, 2018-2020 |
|---|---|---|---|---|
| million USD | ||||
| Italy | 138 | 102 | 64 | -32.0% |
| Japan | 65 | 54 | 34 | -27.7% |
| Madagascar | 3.9 | 4.1 | 11 | 68.0% |
| Romania | 8.8 | 8.2 | 9.6 | 4.3% |
| Slovenia | 1.3 | 0.5 | 8.4 | 151.8% |
In value terms, Italy ($64M), Japan ($34M) and Madagascar ($11M) were the countries with the highest levels of imports in 2020, together comprising 53% of global imports. Romania, Slovenia, India, France, the United States, Germany, Hong Kong SAR, Pakistan, Nepal and Indonesia lagged somewhat behind, together accounting for a further 29%.
Slovenia (+151.8% per year) saw the highest growth rate of the value of imports, among the main importing countries over the period under review, while purchases for the other global leaders experienced more modest paces of growth.
Silk Yarn - Top Exporters
| COUNTRY | 2018 | 2019 | 2020 | CAGR, 2018-2020 |
|---|---|---|---|---|
| million USD | ||||
| China | 167 | 140 | 99 | -23.0% |
| Romania | 79 | 75 | 44 | -25.3% |
| Italy | 38 | 37 | 28 | -14.4% |
| Vietnam | 38 | 30 | 21 | -25.1% |
| Brazil | 33 | 4 | 19 | -23.2% |
In value terms, China ($99M) remains the largest silk yarn supplier worldwide, comprising 40% of global exports. The second position in the ranking was occupied by Romania ($44M), with a 18% share of global exports. It was followed by Italy, with a 11% share.
In China, silk yarn exports shrank by an average annual rate of -23.0% over the period from 2018-2020. The remaining exporting countries recorded the following average annual rates of exports growth: Romania (-25.3% per year) and Italy (-14.4% per year).
Silk Yarn - Market Forecast
Driven by increasing demand for silk yarn worldwide, the market is expected to continue an upward consumption trend over the next decade. Market performance is forecast to accelerate, expanding with an anticipated CAGR of for the period from 2020 to 2030, which is projected to bring the market volume to by the end of 2030.
Silk Yarn - Top Companies
Beijing Jing-Ao Wool Co., Ltd., Yingde Jiaxing Shoe Materials Co., Ltd., TORAY INDUSTRIES,INC., INDORAMA VENTURES PUBLIC COMPANY LIMITED, Shandong Weiqiao Pioneering Group Co., Ltd., Maoming Lvyuan Food Co., Ltd., Shandong Ruyi Technology Group Co., Ltd., JIANGSU GUO TAI INTERNATIONAL GROUP GUO MAO CO., LTD., KOLON INDUSTRIES, INC., WEIQIAO TEXTILE CO., LTD., FUTURIS AUSTRALIA PTY LIMITED, Huafu Fashion Co., Ltd., Shanghai Shenda Co., Ltd., SOCIETE SOFRIP DE RECYCLAGE DE TEXTILE, Parkdale, Incorporated, ALOK INDUSTRIES LIMITED, UNITIKA LTD., HUVIS Corporation, SHINKONG SYNTHETIC FIBERS CORP., PHILIP MORRIS MANUFACTURING & TECHNOLOGY BOLOGNA S.P.A
Silk Yarn - Product Coverage
- HS 5004 - Silk; yarn (other than yarn spun from silk waste), not put up for retail sale
- HS 5005 - Yarn spun from silk waste, not put up for retail sale
- HS 5006 - Silk yarn and yarn spun from silk waste, put up for retail sale; silk-worm gut
This report provides an in-depth analysis of the global silk yarn market. Within it, you will discover the latest data on market trends and opportunities by country, consumption, production and price developments, as well as the global trade (imports and exports). The forecast exhibits the market prospects through 2030.
Product coverage:
- Prodcom 13104010 - Silk yarn, n.p.r.s. (excluding spun from silk waste)
- Prodcom 13104030 - Yarn spun from silk waste, n.p.r.s.
- Prodcom 13104050 - Silk yarn and silk waste yarn, p.r.s., silk-worm gut
Country coverage:
Worldwide - the report contains statistical data for 200 countries and includes detailed profiles of the 50 largest consuming countries:
- USA
- China
- Japan
- Germany
- United Kingdom
- France
- Brazil
- Italy
- Russian Federation
- India
- Canada
- Australia
- Republic of Korea
- Spain
- Mexico
- Indonesia
- Netherlands
- Turkey
- Saudi Arabia
- Switzerland
- Sweden
- Nigeria
- Poland
- Belgium
- Argentina
- Norway
- Austria
- Thailand
- United Arab Emirates
- Colombia
- Denmark
- South Africa
- Malaysia
- Israel
- Singapore
- Egypt
- Philippines
- Finland
- Chile
- Ireland
- Pakistan
- Greece
- Portugal
- Kazakhstan
- Algeria
- Czech Republic
- Qatar
- Peru
- Romania
- Vietnam
+ the largest producing countries
Data coverage:
- Global market volume and value
- Per Capita consumption
- Forecast of the market dynamics in the medium term
- Global production, split by region and country
- Global trade (exports and imports)
- Export and import prices
- Market trends, drivers and restraints
- Key market players and their profiles
Reasons to buy this report:
- Take advantage of the latest data
- Find deeper insights into current market developments
- Discover vital success factors affecting the market
This report is designed for manufacturers, distributors, importers, and wholesalers, as well as for investors, consultants and advisors.
In this report, you can find information that helps you to make informed decisions on the following issues:
- How to diversify your business and benefit from new market opportunities
- How to load your idle production capacity
- How to boost your sales on overseas markets
- How to increase your profit margins
- How to make your supply chain more sustainable
- How to reduce your production and supply chain costs
- How to outsource production to other countries
- How to prepare your business for global expansion
While doing this research, we combine the accumulated expertise of our analysts and the capabilities of artificial intelligence. The AI-based platform, developed by our data scientists, constitutes the key working tool for business analysts, empowering them to discover deep insights and ideas from the marketing data.
-
1. INTRODUCTION
Making Data-Driven Decisions to Grow Your Business
- REPORT DESCRIPTION
- RESEARCH METHODOLOGY AND AI PLATFORM
- DATA-DRIVEN DECISIONS FOR YOUR BUSINESS
- GLOSSARY AND SPECIFIC TERMS
-
2. EXECUTIVE SUMMARY
A Quick Overview of Market Performance
- KEY FINDINGS
- MARKET TRENDS This Chapter is Available Only for the Professional Edition PRO
-
3. MARKET OVERVIEW
Understanding the Current State of The Market and Its Prospects
- MARKET SIZE
- CONSUMPTION BY COUNTRY
- MARKET FORECAST TO 2030
-
4. MOST PROMISING PRODUCT
Finding New Products to Diversify Your Business
This Chapter is Available Only for the Professional Edition PRO- TOP PRODUCTS TO DIVERSIFY YOUR BUSINESS
- BEST-SELLING PRODUCTS
- MOST CONSUMED PRODUCT
- MOST TRADED PRODUCT
- MOST PROFITABLE PRODUCT FOR EXPORT
-
5. MOST PROMISING SUPPLYING COUNTRIES
Choosing the Best Countries to Establish Your Sustainable Supply Chain
This Chapter is Available Only for the Professional Edition PRO- TOP COUNTRIES TO SOURCE YOUR PRODUCT
- TOP PRODUCING COUNTRIES
- TOP EXPORTING COUNTRIES
- LOW-COST EXPORTING COUNTRIES
-
6. MOST PROMISING OVERSEAS MARKETS
Choosing the Best Countries to Boost Your Exports
This Chapter is Available Only for the Professional Edition PRO- TOP OVERSEAS MARKETS FOR EXPORTING YOUR PRODUCT
- TOP CONSUMING MARKETS
- UNSATURATED MARKETS
- TOP IMPORTING MARKETS
- MOST PROFITABLE MARKETS
7. GLOBAL PRODUCTION
The Latest Trends and Insights into The Industry
- PRODUCTION VOLUME AND VALUE
- PRODUCTION BY COUNTRY
8. GLOBAL IMPORTS
The Largest Importers on The Market and How They Succeed
- IMPORTS FROM 2012–2023
- IMPORTS BY COUNTRY
- IMPORT PRICES BY COUNTRY
9. GLOBAL EXPORTS
The Largest Exporters on The Market and How They Succeed
- EXPORTS FROM 2012–2023
- EXPORTS BY COUNTRY
- EXPORT PRICES BY COUNTRY
-
10. PROFILES OF MAJOR PRODUCERS
The Largest Producers on The Market and Their Profiles
This Chapter is Available Only for the Professional Edition PRO -
11. COUNTRY PROFILES
The Largest Markets And Their Profiles
This Chapter is Available Only for the Professional Edition PRO- United States
- China
- Japan
- Germany
- United Kingdom
- France
- Brazil
- Italy
- Russian Federation
- India
- Canada
- Australia
- Republic of Korea
- Spain
- Mexico
- Indonesia
- Netherlands
- Turkey
- Saudi Arabia
- Switzerland
- Sweden
- Nigeria
- Poland
- Belgium
- Argentina
- Norway
- Austria
- Thailand
- United Arab Emirates
- Colombia
- Denmark
- South Africa
- Malaysia
- Israel
- Singapore
- Egypt
- Philippines
- Finland
- Chile
- Ireland
- Pakistan
- Greece
- Portugal
- Kazakhstan
- Algeria
- Czech Republic
- Qatar
- Peru
- Romania
- Vietnam
-
LIST OF TABLES
- Key Findings In 2023
- Market Volume, In Physical Terms, 2012–2023
- Market Value, 2012–2023
- Per Capita Consumption, By Country, 2018–2023
- Production, In Physical Terms, By Country, 2012–2023
- Imports, In Physical Terms, By Country, 2012–2023
- Imports, In Value Terms, By Country, 2012–2023
- Import Prices, By Country Of Destination, 2012–2023
- Exports, In Physical Terms, By Country, 2012–2023
- Exports, In Value Terms, By Country, 2012–2023
- Export Prices, By Country Of Origin, 2012–2023
-
LIST OF FIGURES
- Market Volume, In Physical Terms, 2012–2023
- Market Value, 2012–2023
- Consumption, By Country, 2023
- Market Volume Forecast to 2030
- Market Value Forecast to 2030
- Products: Market Size And Growth, By Type
- Products: Average Per Capita Consumption, By Type
- Products: Exports And Growth, By Type
- Products: Export Prices And Growth, By Type
- Production Volume And Growth
- Exports And Growth
- Export Prices And Growth
- Market Size And Growth
- Per Capita Consumption
- Imports And Growth
- Import Prices
- Production, In Physical Terms, 2012–2023
- Production, In Value Terms, 2012–2023
- Production, By Country, 2023
- Production, In Physical Terms, By Country, 2012–2023
- Imports, In Physical Terms, 2012–2023
- Imports, In Value Terms, 2012–2023
- Imports, In Physical Terms, By Country, 2023
- Imports, In Physical Terms, By Country, 2012–2023
- Imports, In Value Terms, By Country, 2012–2023
- Import Prices, By Country, 2012–2023
- Exports, In Physical Terms, 2012–2023
- Exports, In Value Terms, 2012–2023
- Exports, In Physical Terms, By Country, 2023
- Exports, In Physical Terms, By Country, 2012–2023
- Exports, In Value Terms, By Country, 2012–2023
- Export Prices, 2012–2023
This report provides an in-depth analysis of the global silk yarn market.
This report provides an in-depth analysis of the global silk yarn market.
In value terms, silk waste imports amounted to $X in 2016. Overall, silk waste imports continue to indicate a relatively flat trend pattern. Over the period under review, global silk waste imports a...
In value terms, silk yarn and yarn spun from silk waste imports totaled $X in 2016. Overall, silk yarn and yarn spun from silk waste imports continue to indicate a drastic drop. Over the period unde...
In value terms, silk waste exports totaled $X in 2016. Overall, silk waste exports continue to indicate a relatively flat trend pattern. Global silk waste export peaked of $X in 2014; however, fro...
In value terms, silk yarn and yarn spun from silk waste exports stood at $X in 2016. Overall, silk yarn and yarn spun from silk waste exports continue to indicate a drastic deduction. In that year,...
In 2016, the amount of silk yarn imported worldwide amounted to X tons, reducing by -X% against the previous year level. In general, silk yarn imports continue to indicate a deep downturn. The...
In 2016, the amount of silk yarn imported worldwide amounted to X tons, reducing by -X% against the previous year level. In general, silk yarn imports continue to indicate a deep downturn. The...


