Republic of Korea - Tantalum - Market Analysis, Forecast, Size, Trends And Insights
Get instant access to more than 2 million reports, dashboards, and datasets on the IndexBox Platform.
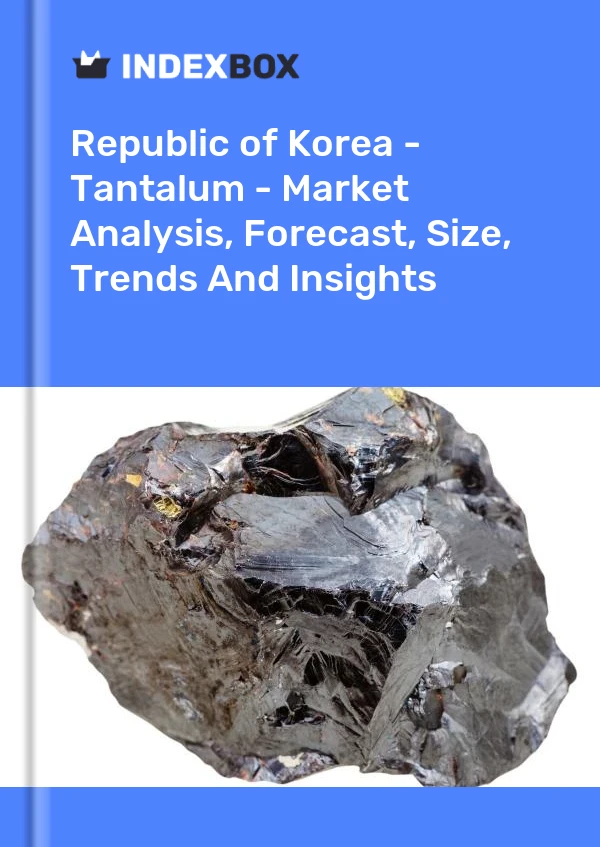
View PricingTantalum Price in South Korea - 2022
Contents:
- Tantalum Price in South Korea (CIF) - 2022
- Tantalum Price in South Korea (FOB) - 2022
- Tantalum Imports in South Korea
- Tantalum Exports in South Korea
Tantalum Price in South Korea (CIF) - 2022
In December 2022, the average tantalum import price amounted to $526K per ton, waning by -60.9% against the previous month. Over the period under review, the import price continues to indicate a relatively flat trend pattern. The growth pace was the most rapid in July 2022 an increase of 328% m-o-m. Over the period under review, average import prices attained the maximum at $2.9M per ton in April 2022; however, from May 2022 to December 2022, import prices failed to regain momentum.
Average prices varied noticeably amongst the major supplying countries. In December 2022, the country with the highest price was the United States ($526K per ton), while the price for China totaled $506K per ton.
From December 2021 to December 2022, the most notable rate of growth in terms of prices was attained by Estonia (0.0%), while the prices for the other major suppliers experienced mixed trend patterns.
Tantalum Price in South Korea (FOB) - 2022
In 2022, the average tantalum export price amounted to $154,627 per ton, jumping by 49% against the previous year. Overall, the export price, however, showed a deep contraction. The pace of growth was the most pronounced in 2015 an increase of 858%. The export price peaked at $4,156,322 per ton in 2013; however, from 2014 to 2022, the export prices failed to regain momentum.
Prices varied noticeably by country of destination: amid the top suppliers, the country with the highest price was Japan ($1,651,750 per ton), while the average price for exports to Germany totaled $151,177 per ton.
From 2012 to 2022, the most notable rate of growth in terms of prices was recorded for supplies to Germany (+7.6%), while the prices for the other major destinations experienced mixed trend patterns.
Tantalum Imports in South Korea
In 2022, tantalum imports into South Korea soared to 1.6 tons, with an increase of 37% on 2021 figures. In general, imports saw a significant increase. The growth pace was the most rapid in 2021 when imports increased by 92% against the previous year. Over the period under review, imports reached the maximum in 2022 and are likely to continue growth in the near future.
In value terms, tantalum imports surged to $594K in 2022. Over the period under review, imports posted a significant expansion. The most prominent rate of growth was recorded in 2021 with an increase of 146% against the previous year. Over the period under review, imports reached the peak figure in 2022 and are expected to retain growth in the near future.
| Import of Tantalum in South Korea (Thousand USD) | |||||
|---|---|---|---|---|---|
| COUNTRY | 2019 | 2020 | 2021 | 2022 | CAGR, 2019-2022 |
| Russia | N/A | 87.5 | 208 | 230 | 62.1% |
| Estonia | N/A | N/A | N/A | 162 | 0% |
| United States | 2.8 | 3.7 | 15.2 | 147 | 274.4% |
| China | 23.3 | 13.0 | 55.2 | 39.6 | 19.3% |
| Hong Kong SAR | 91.4 | N/A | N/A | 11.8 | -49.5% |
| Philippines | 73.5 | 14.6 | 9.8 | N/A | -63.5% |
| Others | 14.1 | 0.6 | 5.8 | 3.0 | -40.3% |
| Total | 205 | 119 | 294 | 594 | 42.6% |
Top Suppliers of Tantalum to South Korea in 2022:
- Russia (1000.0 kg)
- Estonia (302.0 kg)
- United States (285.0 kg)
- China (45.0 kg)
- Hong Kong SAR (8.0 kg)
Tantalum Exports in South Korea
In 2022, overseas shipments of tantalum were finally on the rise to reach 1.7 tons for the first time since 2019, thus ending a two-year declining trend. Over the period under review, exports, however, showed a abrupt curtailment.
In value terms, tantalum exports surged to $269K in 2022. Overall, exports showed a tangible expansion. As a result, the exports attained the peak and are likely to continue growth in the immediate term.
| Export of Tantalum in South Korea (Thousand USD) | |||||
|---|---|---|---|---|---|
| COUNTRY | 2019 | 2020 | 2021 | 2022 | CAGR, 2019-2022 |
| Germany | 236 | 76.9 | 55.1 | 262 | 3.5% |
| Others | 12.7 | 0.1 | 0.6 | 6.6 | -19.6% |
| Total | 248 | 77.0 | 55.7 | 269 | 2.7% |
Top Export Markets for Tantalum from South Korea in 2022:
- Germany (1736.0 kg)
This report provides an in-depth analysis of the tantalum market in Republic of Korea. Within it, you will discover the latest data on market trends and opportunities by country, consumption, production and price developments, as well as the global trade (imports and exports). The forecast exhibits the market prospects through 2030.
Product coverage:
Country coverage:
- South Korea
Data coverage:
- Market volume and value
- Per Capita consumption
- Forecast of the market dynamics in the medium term
- Trade (exports and imports) in Republic of Korea
- Export and import prices
- Market trends, drivers and restraints
- Key market players and their profiles
Reasons to buy this report:
- Take advantage of the latest data
- Find deeper insights into current market developments
- Discover vital success factors affecting the market
This report is designed for manufacturers, distributors, importers, and wholesalers, as well as for investors, consultants and advisors.
In this report, you can find information that helps you to make informed decisions on the following issues:
- How to diversify your business and benefit from new market opportunities
- How to load your idle production capacity
- How to boost your sales on overseas markets
- How to increase your profit margins
- How to make your supply chain more sustainable
- How to reduce your production and supply chain costs
- How to outsource production to other countries
- How to prepare your business for global expansion
While doing this research, we combine the accumulated expertise of our analysts and the capabilities of artificial intelligence. The AI-based platform, developed by our data scientists, constitutes the key working tool for business analysts, empowering them to discover deep insights and ideas from the marketing data.
-
1. INTRODUCTION
Making Data-Driven Decisions to Grow Your Business
- REPORT DESCRIPTION
- RESEARCH METHODOLOGY AND AI PLATFORM
- DATA-DRIVEN DECISIONS FOR YOUR BUSINESS
- GLOSSARY AND SPECIFIC TERMS
-
2. EXECUTIVE SUMMARY
A Quick Overview of Market Performance
- KEY FINDINGS
- MARKET TRENDS This Chapter is Available Only for the Professional Edition PRO
-
3. MARKET OVERVIEW
Understanding the Current State of The Market and Its Prospects
- MARKET SIZE
- MARKET STRUCTURE
- TRADE BALANCE
- PER CAPITA CONSUMPTION
- MARKET FORECAST TO 2030
-
4. MOST PROMISING PRODUCT
Finding New Products to Diversify Your Business
This Chapter is Available Only for the Professional Edition PRO- TOP PRODUCTS TO DIVERSIFY YOUR BUSINESS
- BEST-SELLING PRODUCTS
- MOST CONSUMED PRODUCT
- MOST TRADED PRODUCT
- MOST PROFITABLE PRODUCT FOR EXPORT
-
5. MOST PROMISING SUPPLYING COUNTRIES
Choosing the Best Countries to Establish Your Sustainable Supply Chain
This Chapter is Available Only for the Professional Edition PRO- TOP COUNTRIES TO SOURCE YOUR PRODUCT
- TOP PRODUCING COUNTRIES
- TOP EXPORTING COUNTRIES
- LOW-COST EXPORTING COUNTRIES
-
6. MOST PROMISING OVERSEAS MARKETS
Choosing the Best Countries to Boost Your Exports
This Chapter is Available Only for the Professional Edition PRO- TOP OVERSEAS MARKETS FOR EXPORTING YOUR PRODUCT
- TOP CONSUMING MARKETS
- UNSATURATED MARKETS
- TOP IMPORTING MARKETS
- MOST PROFITABLE MARKETS
7. PRODUCTION
The Latest Trends and Insights into The Industry
- PRODUCTION VOLUME AND VALUE
8. IMPORTS
The Largest Import Supplying Countries
- IMPORTS FROM 2012–2023
- IMPORTS BY COUNTRY
- IMPORT PRICES BY COUNTRY
9. EXPORTS
The Largest Destinations for Exports
- EXPORTS FROM 2012–2023
- EXPORTS BY COUNTRY
- EXPORT PRICES BY COUNTRY
-
10. PROFILES OF MAJOR PRODUCERS
The Largest Producers on The Market and Their Profiles
This Chapter is Available Only for the Professional Edition PRO -
LIST OF TABLES
- Key Findings In 2023
- Market Volume, In Physical Terms, 2012–2023
- Market Value, 2012–2023
- Per Capita Consumption In 2012-2023
- Imports, In Physical Terms, By Country, 2012–2023
- Imports, In Value Terms, By Country, 2012–2023
- Import Prices, By Country Of Origin, 2012–2023
- Exports, In Physical Terms, By Country, 2012–2023
- Exports, In Value Terms, By Country, 2012–2023
- Export Prices, By Country Of Destination, 2012–2023
-
LIST OF FIGURES
- Market Volume, In Physical Terms, 2012–2023
- Market Value, 2012–2023
- Market Structure – Domestic Supply vs. Imports, In Physical Terms, 2012-2023
- Market Structure – Domestic Supply vs. Imports, In Value Terms, 2012-2023
- Trade Balance, In Physical Terms, 2012-2023
- Trade Balance, In Value Terms, 2012-2023
- Per Capita Consumption, 2012-2023
- Market Volume Forecast to 2030
- Market Value Forecast to 2030
- Products: Market Size And Growth, By Type
- Products: Average Per Capita Consumption, By Type
- Products: Exports And Growth, By Type
- Products: Export Prices And Growth, By Type
- Production Volume And Growth
- Exports And Growth
- Export Prices And Growth
- Market Size And Growth
- Per Capita Consumption
- Imports And Growth
- Import Prices
- Production, In Physical Terms, 2012–2023
- Production, In Value Terms, 2012–2023
- Imports, In Physical Terms, 2012–2023
- Imports, In Value Terms, 2012–2023
- Imports, In Physical Terms, By Country, 2023
- Imports, In Physical Terms, By Country, 2012–2023
- Imports, In Value Terms, By Country, 2012–2023
- Import Prices, By Country Of Origin, 2012–2023
- Exports, In Physical Terms, 2012–2023
- Exports, In Value Terms, 2012–2023
- Exports, In Physical Terms, By Country, 2023
- Exports, In Physical Terms, By Country, 2012–2023
- Exports, In Value Terms, By Country, 2012–2023
- Export Prices, By Country Of Destination, 2012–2023
This report provides an in-depth analysis of the tantalum market in Republic of Korea.
This report provides an in-depth analysis of the currant and gooseberry market in Republic of Korea.
This report provides an in-depth analysis of the global tantalum market.
This report provides an in-depth analysis of the global tantalum market.
This report provides an in-depth analysis of the global currant and gooseberry market.
This report provides an in-depth analysis of the tantalum market in Republic of Korea.
This report provides an in-depth analysis of the global tantalum market.
This report provides an in-depth analysis of the global tantalum market.
In value terms, niobium, tantalum, vanadium and zirconium ores imports amounted to $X in 2016. In general, niobium, tantalum, vanadium and zirconium ores imports continue to indicate a temperate ex...
In value terms, tantalum imports totaled $X in 2016. In general, tantalum imports continue to indicate a noticeable growth. Global tantalum import peaked of $X in 2012; however, from 2013 to X>
In value terms, niobium, tantalum, vanadium and zirconium ores exports totaled $X in 2016. In general, niobium, tantalum, vanadium and zirconium ores exports continue to indicate a notable expansio...
In value terms, tantalum exports stood at $X in 2016. In general, tantalum exports continue to indicate a significant growth. Over the period under review, global tantalum exports reached its maxim...
The global trade in tantalum amounted to X million USD in 2015, fluctuating strongly over the period under review. A X% drop in 2009 was followed by recovery over the next two years, until exports decreased again. Exports slightly increased in 2014
Global currant and gooseberry consumption amounted to X thousand tons in 2015, moving up by +X% against the previous year level.
In 2015, the country with the largest volume of the currant and gooseberry output was Russia (X thousand tons), accounting for X% of global production.
The Netherlands dominates in the global currant and gooseberry trade. In 2014, the Netherlands exported X thousand tons of currants and gooseberries totaling X million USD, X% over the previous year. Its primary trading partner was Germany, where i
In value terms, niobium, tantalum, vanadium and zirconium ores imports amounted to $X in 2016. In general, niobium, tantalum, vanadium and zirconium ores imports continue to indicate a temperate ex...
In value terms, tantalum imports totaled $X in 2016. In general, tantalum imports continue to indicate a noticeable growth. Global tantalum import peaked of $X in 2012; however, from 2013 to X>


