World - Fertilizers - Market Analysis, Forecast, Size, Trends and Insights
Get instant access to more than 2 million reports, dashboards, and datasets on the IndexBox Platform.
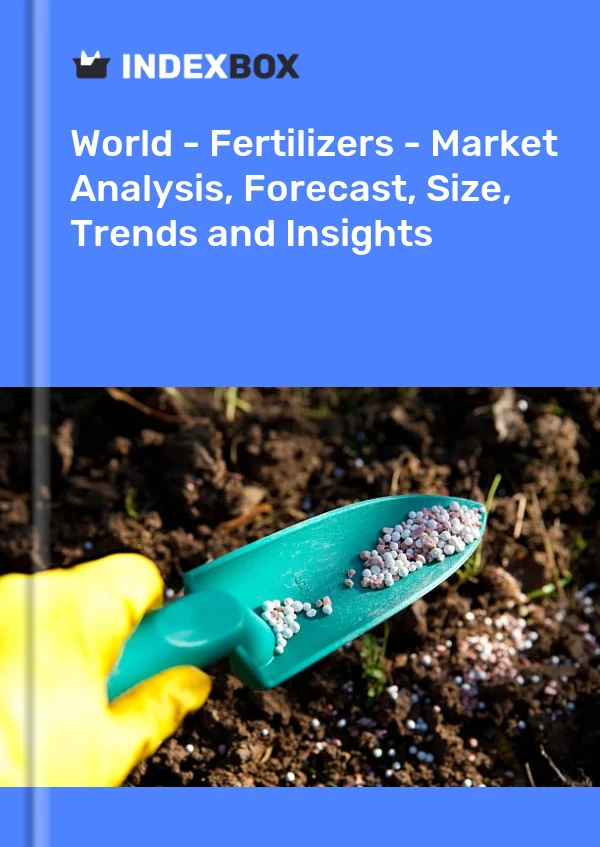
View PricingPotassium Npk
Potassium is one of the essential nutrients required for the healthy growth of plants. It is an important component of the NPK (nitrogen, phosphorus, and potassium) fertilizer blend, commonly used in agriculture to promote plant development and increase crop yields.
Potassium, chemical symbol K, is a mineral macronutrient that plays a vital role in many physiological processes within plants. It helps in regulating water balance, enhancing root development, activating enzymes, facilitating photosynthesis, and improving overall plant vigor. Potassium is known for its mobility within plants, meaning it can easily move from older leaves to newer growth, ensuring balanced nutrient distribution.
Potassium's primary function is to facilitate the osmotic regulation within plants, controlling water uptake and maintaining cellular turgor pressure. This aids in preventing drought stress and improving the plant's ability to withstand environmental challenges, such as extreme temperatures and diseases. Additionally, potassium is involved in the synthesis of proteins, carbohydrates, and various enzymes, contributing to the overall plant growth and metabolism.
One of the key benefits of potassium in plants is its role in the activation of many enzymes, particularly those involved in photosynthesis. It helps in the formation of adenosine triphosphate (ATP), the energy currency of cells, allowing efficient conversion of light energy into chemical energy. This results in increased carbon fixation and improved plant growth rates. Potassium also enhances the transport and utilization of sugars produced during photosynthesis, leading to optimized crop yields.
In agricultural practices, potassium is typically supplied in the form of potassium chloride (KCl) or potassium sulfate (K2SO4), both of which are commonly used NPK fertilizer components. These fertilizer blends are applied to the soil or foliage, providing plants with readily available potassium ions. The dosage and distribution method depend on the specific crop requirements, soil conditions, and farming practices.
It is important to maintain a proper balance of potassium in the soil to ensure optimal plant nutrition. Potassium deficiencies can negatively impact plant growth and development, leading to decreased yields and increased susceptibility to pests and diseases. Regular soil testing and analysis can help determine the appropriate fertilizer application rates and ensure adequate potassium levels for healthy plant growth.
In conclusion, potassium is a vital nutrient in the NPK fertilizer blend, playing a crucial role in various plant physiological processes. Its inclusion in agricultural practices helps optimize plant growth, increase crop yields, and improve overall plant health and vigor.
This report provides an in-depth analysis of the global fertilizer market. Within it, you will discover the latest data on market trends and opportunities by country, consumption, production and price developments, as well as the global trade (imports and exports). The forecast exhibits the market prospects through 2030.
Product coverage:
- FCL 4025 - Potassium nitrate
- FCL 4004 - Calcium ammonium nitrate (CAN) and other mixtures with calcium carbonate
- FCL 4005 - Sodium nitrate
- FCL 4023 - Monoammonium phosphate (MAP)
- FCL 4001 - Urea
- FCL 4002 - Ammonium sulphate
- FCL 4003 - Ammonium nitrate (AN)
- FCL 4006 - Urea and ammonium nitrate solutions (UAN)
- FCL 4016 - Potassium chloride (muriate of potash) (MOP)
- FCL 4021 - NPK fertilizers
- FCL 4014 - Other phosphatic fertilizers, n.e.c.
- FCL 4022 - Diammonium phosphate (DAP)
- FCL 4027 - PK compounds
- FCL 4024 - Other NP compounds
- FCL 4008 - Other nitrogenous fertilizers, n.e.c.
- FCL 4012 - Superphosphates above 35%
- FCL 4013 - Superphosphates, other
- FCL 4018 - Other potassic fertilizers, n.e.c.
Country coverage:
Worldwide - the report contains statistical data for 200 countries and includes detailed profiles of the 50 largest consuming countries:
- USA
- China
- Japan
- Germany
- United Kingdom
- France
- Brazil
- Italy
- Russian Federation
- India
- Canada
- Australia
- Republic of Korea
- Spain
- Mexico
- Indonesia
- Netherlands
- Turkey
- Saudi Arabia
- Switzerland
- Sweden
- Nigeria
- Poland
- Belgium
- Argentina
- Norway
- Austria
- Thailand
- United Arab Emirates
- Colombia
- Denmark
- South Africa
- Malaysia
- Israel
- Singapore
- Egypt
- Philippines
- Finland
- Chile
- Ireland
- Pakistan
- Greece
- Portugal
- Kazakhstan
- Algeria
- Czech Republic
- Qatar
- Peru
- Romania
- Vietnam
+ the largest producing countries
Data coverage:
- Global market volume and value
- Per Capita consumption
- Forecast of the market dynamics in the medium term
- Global production, split by region and country
- Global trade (exports and imports)
- Export and import prices
- Market trends, drivers and restraints
- Key market players and their profiles
Company coverage:
Reasons to buy this report:
- Take advantage of the latest data
- Find deeper insights into current market developments
- Discover vital success factors affecting the market
This report is designed for manufacturers, distributors, importers, and wholesalers, as well as for investors, consultants and advisors.
In this report, you can find information that helps you to make informed decisions on the following issues:
- How to diversify your business and benefit from new market opportunities
- How to load your idle production capacity
- How to boost your sales on overseas markets
- How to increase your profit margins
- How to make your supply chain more sustainable
- How to reduce your production and supply chain costs
- How to outsource production to other countries
- How to prepare your business for global expansion
While doing this research, we combine the accumulated expertise of our analysts and the capabilities of artificial intelligence. The AI-based platform, developed by our data scientists, constitutes the key working tool for business analysts, empowering them to discover deep insights and ideas from the marketing data.
-
1. INTRODUCTION
Making Data-Driven Decisions to Grow Your Business
- REPORT DESCRIPTION
- RESEARCH METHODOLOGY AND AI PLATFORM
- DATA-DRIVEN DECISIONS FOR YOUR BUSINESS
- GLOSSARY AND SPECIFIC TERMS
-
2. EXECUTIVE SUMMARY
A Quick Overview of Market Performance
- KEY FINDINGS
- MARKET TRENDS This Chapter is Available Only for the Professional Edition PRO
-
3. MARKET OVERVIEW
Understanding the Current State of The Market and Its Prospects
- MARKET SIZE
- CONSUMPTION BY COUNTRY
- MARKET FORECAST TO 2030
-
4. MOST PROMISING PRODUCT
Finding New Products to Diversify Your Business
This Chapter is Available Only for the Professional Edition PRO- TOP PRODUCTS TO DIVERSIFY YOUR BUSINESS
- BEST-SELLING PRODUCTS
- MOST CONSUMED PRODUCT
- MOST TRADED PRODUCT
- MOST PROFITABLE PRODUCT FOR EXPORT
-
5. MOST PROMISING SUPPLYING COUNTRIES
Choosing the Best Countries to Establish Your Sustainable Supply Chain
This Chapter is Available Only for the Professional Edition PRO- TOP COUNTRIES TO SOURCE YOUR PRODUCT
- TOP PRODUCING COUNTRIES
- TOP EXPORTING COUNTRIES
- LOW-COST EXPORTING COUNTRIES
-
6. MOST PROMISING OVERSEAS MARKETS
Choosing the Best Countries to Boost Your Exports
This Chapter is Available Only for the Professional Edition PRO- TOP OVERSEAS MARKETS FOR EXPORTING YOUR PRODUCT
- TOP CONSUMING MARKETS
- UNSATURATED MARKETS
- TOP IMPORTING MARKETS
- MOST PROFITABLE MARKETS
7. GLOBAL PRODUCTION
The Latest Trends and Insights into The Industry
- PRODUCTION VOLUME AND VALUE
- PRODUCTION BY COUNTRY
8. GLOBAL IMPORTS
The Largest Importers on The Market and How They Succeed
- IMPORTS FROM 2012–2023
- IMPORTS BY COUNTRY
- IMPORT PRICES BY COUNTRY
9. GLOBAL EXPORTS
The Largest Exporters on The Market and How They Succeed
- EXPORTS FROM 2012–2023
- EXPORTS BY COUNTRY
- EXPORT PRICES BY COUNTRY
-
10. PROFILES OF MAJOR PRODUCERS
The Largest Producers on The Market and Their Profiles
This Chapter is Available Only for the Professional Edition PRO -
11. COUNTRY PROFILES
The Largest Markets And Their Profiles
This Chapter is Available Only for the Professional Edition PRO- United States
- China
- Japan
- Germany
- United Kingdom
- France
- Brazil
- Italy
- Russian Federation
- India
- Canada
- Australia
- Republic of Korea
- Spain
- Mexico
- Indonesia
- Netherlands
- Turkey
- Saudi Arabia
- Switzerland
- Sweden
- Nigeria
- Poland
- Belgium
- Argentina
- Norway
- Austria
- Thailand
- United Arab Emirates
- Colombia
- Denmark
- South Africa
- Malaysia
- Israel
- Singapore
- Egypt
- Philippines
- Finland
- Chile
- Ireland
- Pakistan
- Greece
- Portugal
- Kazakhstan
- Algeria
- Czech Republic
- Qatar
- Peru
- Romania
- Vietnam
-
LIST OF TABLES
- Key Findings In 2023
- Market Volume, In Physical Terms, 2012–2023
- Market Value, 2012–2023
- Per Capita Consumption, By Country, 2018–2023
- Production, In Physical Terms, By Country, 2012–2023
- Imports, In Physical Terms, By Country, 2012–2023
- Imports, In Value Terms, By Country, 2012–2023
- Import Prices, By Country Of Destination, 2012–2023
- Exports, In Physical Terms, By Country, 2012–2023
- Exports, In Value Terms, By Country, 2012–2023
- Export Prices, By Country Of Origin, 2012–2023
-
LIST OF FIGURES
- Market Volume, In Physical Terms, 2012–2023
- Market Value, 2012–2023
- Consumption, By Country, 2023
- Market Volume Forecast to 2030
- Market Value Forecast to 2030
- Products: Market Size And Growth, By Type
- Products: Average Per Capita Consumption, By Type
- Products: Exports And Growth, By Type
- Products: Export Prices And Growth, By Type
- Production Volume And Growth
- Exports And Growth
- Export Prices And Growth
- Market Size And Growth
- Per Capita Consumption
- Imports And Growth
- Import Prices
- Production, In Physical Terms, 2012–2023
- Production, In Value Terms, 2012–2023
- Production, By Country, 2023
- Production, In Physical Terms, By Country, 2012–2023
- Imports, In Physical Terms, 2012–2023
- Imports, In Value Terms, 2012–2023
- Imports, In Physical Terms, By Country, 2023
- Imports, In Physical Terms, By Country, 2012–2023
- Imports, In Value Terms, By Country, 2012–2023
- Import Prices, By Country, 2012–2023
- Exports, In Physical Terms, 2012–2023
- Exports, In Value Terms, 2012–2023
- Exports, In Physical Terms, By Country, 2023
- Exports, In Physical Terms, By Country, 2012–2023
- Exports, In Value Terms, By Country, 2012–2023
- Export Prices, 2012–2023
This report provides an in-depth analysis of the global fertilizer market.
This report provides an in-depth analysis of the global ammonium nitrate market.
This report provides an in-depth analysis of the global urea market.
This report provides an in-depth analysis of the global nitrogenous fertilizer market.
This report provides an in-depth analysis of the global sodium nitrate market.
This report provides an in-depth analysis of the global market for calcium ammonium nitrate (can).
This report provides an in-depth analysis of the global ammonium sulphate market.
This report provides an in-depth analysis of the global market for mixtures of urea and ammonium nitrate in aqueous or ammoniacal solution.
This report provides an in-depth analysis of the global market for iron or steel can.
Explore the top import markets for fertilizer worldwide, including Brazil, India, the United States, China, and more. Discover key statistics and import values provided by the IndexBox market intelligence platform.
Discover the top import markets for fertilizers, including Brazil, India, the United States, China, and France. Explore their import values and the factors driving the demand for fertilizers in these countries.
Fertilizer prices continue to ramp up due to a shortage in supply caused by lower output in EU countries. High natural gas costs shape that growth because gas accounts for up to 80% of variable costs in nitrogen fertilizer production. Urea prices spiked exceptionally high to $900 per ton in November 2021, gaining 30% against the previous month. Phosphate rock price rose by 4%, while diammonium phosphate and triple superphosphate were both up by 8%. Next year, fertilizer prices are projected to climb further due to a continued shortage in supply, but if costs for natural gas maintain their downward trend, they will hold the price increases back.
Explore the top import markets for urea, including India, Brazil, United States, Australia, and more. Learn about their import values and key statistics.
Urea price soared by +46% in October 2021, reaching $612.5 per ton, according to the latest World Bank's data. The spike was caused by a sharp slump in the world's production, as many producers have suspended manufacturing owing to skyrocketing natural gas prices and energy resource shortages. Russia, China and Egypt remain the key urea suppliers, while India, Brazil and the U.S. lead the world import ranking.
Brazil, Argentina, Australia and Spain increased urea supplies from abroad sharply in 2020. Despite this, global imports of this product slightly dropped last year. India, Brazil, the U.S. remain the largest markets for imported urea worldwide. In 2020, the average import price reduced by -9.8% against the previous year.
Explore the top 10 import markets for nitrogenous fertilizer and their significance in the global agricultural industry.
In value terms, chemical elements doped for use in electronics imports stood at $X in 2016. Overall, chemical elements doped for use in electronics imports continue to indicate a moderate deduction. ...
In value terms, mineral and chemical, potassic fertilizers imports amounted to $X in 2016. Overall, it indicated a mild growth from 2007 to 2016: the total imports value increased at an average annu...
In value terms, mineral and chemical, phosphatic fertilizers imports totaled $X in 2016. In general, mineral and chemical, phosphatic fertilizers imports continue to indicate a relatively flat tren...


