World - Fertilizers - Market Analysis, Forecast, Size, Trends and Insights
Get instant access to more than 2 million reports, dashboards, and datasets on the IndexBox Platform.
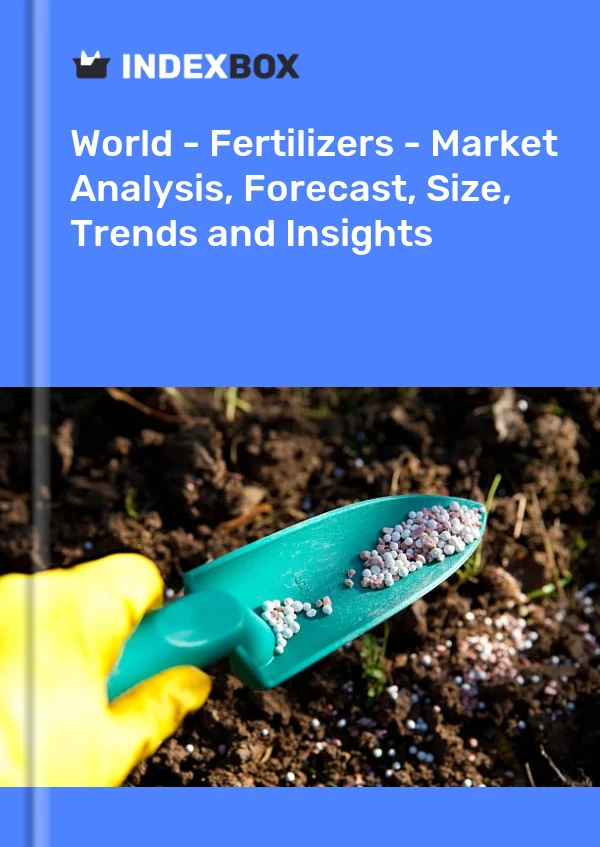
View PricingFertilizer Prices Spike and Will Continue Rallying Next Year
IndexBox has just published a new report: 'World - Fertilizers - Market Analysis, Forecast, Size, Trends and Insights'. Here is a summary of the report's key findings.
Fertilizer prices continue to ramp up due to a shortage in supply caused by lower output in EU countries. High natural gas costs shape that growth because gas accounts for up to 80% of variable costs in nitrogen fertilizer production. Urea prices spiked exceptionally high to $900 per ton in November 2021, gaining 30% against the previous month. Phosphate rock price rose by 4%, while diammonium phosphate and triple superphosphate were both up by 8%. Next year, fertilizer prices are projected to climb further due to a continued shortage in supply, but if costs for natural gas maintain their downward trend, they will hold the price increases back.
Key Trends and Insights
Fertilizer prices are continuing to rise. According to the December data from the World Bank, the urea price shot upward by 30% in November compared to the previous month, reaching $900.5 per ton. This is already the second significant gain seen this year. Phosphate rock has also become more expensive by +4% up to $153 per ton, while diammonium phosphate and triple superphosphate each increased by +8% to $727 and $665 per ton, respectively.
The key factors driving fertilizer prices up were a supply shortage on the global market and the growing costs of natural gas, which account for up to 80% of variable costs in producing nitrogen fertilizers. Faced with more expensive energy resources, many European producers had to stop production as they couldn't compete with counterparts in Russia, countries in the Persian Gulf and northern Africa. As a result, the global supply of fertilizer decreased and led to subsequent price increases.
According to the World Bank, in November, the prices for natural gas in the U.S. decreased by -8% to $5.02 per MMBtu, and by -11% in Europe to $27.6 per MMBtu, but despite that, they are still at record highs. If the cost for natural gas declines, it may reduce the rate of price increases in the upcoming months. However, this will not eliminate the long-term upward trend in fertilizer prices as there will still be a shortage in supply.
Global Fertilizer Exports by Country
In 2020, global fertilizer exports amounted to 204M tons, increasing by 2% from the previous year's figure. In value terms, exports dropped to $52.7B (IndexBox estimates)
The largest fertilizer supplying countries worldwide were Russia ($7B), China ($6.3B) and Canada ($5.1B), together comprising 35% of global exports. These countries were followed by the U.S., Morocco, Saudi Arabia, Belarus, Germany, the Netherlands, Belgium, Israel, Oman and Algeria, which together accounted for a further 38%. The shipments of the three major exporters of fertilizers, namely Russia, China and Canada, represented more than a third of total export in physical terms.
Top Largest Importers Worldwide
Brazil (34M tons), India (25M tons) and the U.S. (23M tons) represented roughly 37% of total imports of fertilizers in 2020. It was distantly followed by China (10M tons), generating a 4.8% share of total imports. France (7.4M tons), Indonesia (6.2M tons), Australia (5.2M tons), Thailand (5M tons), Canada (4.4M tons), Turkey (4.3M tons), Germany (4.1M tons), Argentina (4M tons) and Belgium (3.9M tons) held small shares of total imports.
In value terms, the largest fertilizer importing markets worldwide were Brazil ($8.6B), India ($7.1B) and the U.S. ($5.6B), together accounting for 36% of global imports. These countries were followed by China, France, Australia, Thailand, Canada, Indonesia, Argentina, Turkey, Germany and Belgium, which together accounted for a further 24%.
This report provides an in-depth analysis of the global fertilizer market. Within it, you will discover the latest data on market trends and opportunities by country, consumption, production and price developments, as well as the global trade (imports and exports). The forecast exhibits the market prospects through 2030.
Product coverage:
- FCL 4025 - Potassium nitrate
- FCL 4004 - Calcium ammonium nitrate (CAN) and other mixtures with calcium carbonate
- FCL 4005 - Sodium nitrate
- FCL 4023 - Monoammonium phosphate (MAP)
- FCL 4001 - Urea
- FCL 4002 - Ammonium sulphate
- FCL 4003 - Ammonium nitrate (AN)
- FCL 4006 - Urea and ammonium nitrate solutions (UAN)
- FCL 4016 - Potassium chloride (muriate of potash) (MOP)
- FCL 4021 - NPK fertilizers
- FCL 4014 - Other phosphatic fertilizers, n.e.c.
- FCL 4022 - Diammonium phosphate (DAP)
- FCL 4027 - PK compounds
- FCL 4024 - Other NP compounds
- FCL 4008 - Other nitrogenous fertilizers, n.e.c.
- FCL 4012 - Superphosphates above 35%
- FCL 4013 - Superphosphates, other
- FCL 4018 - Other potassic fertilizers, n.e.c.
Country coverage:
Worldwide - the report contains statistical data for 200 countries and includes detailed profiles of the 50 largest consuming countries:
- USA
- China
- Japan
- Germany
- United Kingdom
- France
- Brazil
- Italy
- Russian Federation
- India
- Canada
- Australia
- Republic of Korea
- Spain
- Mexico
- Indonesia
- Netherlands
- Turkey
- Saudi Arabia
- Switzerland
- Sweden
- Nigeria
- Poland
- Belgium
- Argentina
- Norway
- Austria
- Thailand
- United Arab Emirates
- Colombia
- Denmark
- South Africa
- Malaysia
- Israel
- Singapore
- Egypt
- Philippines
- Finland
- Chile
- Ireland
- Pakistan
- Greece
- Portugal
- Kazakhstan
- Algeria
- Czech Republic
- Qatar
- Peru
- Romania
- Vietnam
+ the largest producing countries
Data coverage:
- Global market volume and value
- Per Capita consumption
- Forecast of the market dynamics in the medium term
- Global production, split by region and country
- Global trade (exports and imports)
- Export and import prices
- Market trends, drivers and restraints
- Key market players and their profiles
Company coverage:
Reasons to buy this report:
- Take advantage of the latest data
- Find deeper insights into current market developments
- Discover vital success factors affecting the market
This report is designed for manufacturers, distributors, importers, and wholesalers, as well as for investors, consultants and advisors.
In this report, you can find information that helps you to make informed decisions on the following issues:
- How to diversify your business and benefit from new market opportunities
- How to load your idle production capacity
- How to boost your sales on overseas markets
- How to increase your profit margins
- How to make your supply chain more sustainable
- How to reduce your production and supply chain costs
- How to outsource production to other countries
- How to prepare your business for global expansion
While doing this research, we combine the accumulated expertise of our analysts and the capabilities of artificial intelligence. The AI-based platform, developed by our data scientists, constitutes the key working tool for business analysts, empowering them to discover deep insights and ideas from the marketing data.
-
1. INTRODUCTION
Making Data-Driven Decisions to Grow Your Business
- REPORT DESCRIPTION
- RESEARCH METHODOLOGY AND AI PLATFORM
- DATA-DRIVEN DECISIONS FOR YOUR BUSINESS
- GLOSSARY AND SPECIFIC TERMS
-
2. EXECUTIVE SUMMARY
A Quick Overview of Market Performance
- KEY FINDINGS
- MARKET TRENDS This Chapter is Available Only for the Professional Edition PRO
-
3. MARKET OVERVIEW
Understanding the Current State of The Market and Its Prospects
- MARKET SIZE
- CONSUMPTION BY COUNTRY
- MARKET FORECAST TO 2030
-
4. MOST PROMISING PRODUCT
Finding New Products to Diversify Your Business
This Chapter is Available Only for the Professional Edition PRO- TOP PRODUCTS TO DIVERSIFY YOUR BUSINESS
- BEST-SELLING PRODUCTS
- MOST CONSUMED PRODUCT
- MOST TRADED PRODUCT
- MOST PROFITABLE PRODUCT FOR EXPORT
-
5. MOST PROMISING SUPPLYING COUNTRIES
Choosing the Best Countries to Establish Your Sustainable Supply Chain
This Chapter is Available Only for the Professional Edition PRO- TOP COUNTRIES TO SOURCE YOUR PRODUCT
- TOP PRODUCING COUNTRIES
- TOP EXPORTING COUNTRIES
- LOW-COST EXPORTING COUNTRIES
-
6. MOST PROMISING OVERSEAS MARKETS
Choosing the Best Countries to Boost Your Exports
This Chapter is Available Only for the Professional Edition PRO- TOP OVERSEAS MARKETS FOR EXPORTING YOUR PRODUCT
- TOP CONSUMING MARKETS
- UNSATURATED MARKETS
- TOP IMPORTING MARKETS
- MOST PROFITABLE MARKETS
7. GLOBAL PRODUCTION
The Latest Trends and Insights into The Industry
- PRODUCTION VOLUME AND VALUE
- PRODUCTION BY COUNTRY
8. GLOBAL IMPORTS
The Largest Importers on The Market and How They Succeed
- IMPORTS FROM 2012–2023
- IMPORTS BY COUNTRY
- IMPORT PRICES BY COUNTRY
9. GLOBAL EXPORTS
The Largest Exporters on The Market and How They Succeed
- EXPORTS FROM 2012–2023
- EXPORTS BY COUNTRY
- EXPORT PRICES BY COUNTRY
-
10. PROFILES OF MAJOR PRODUCERS
The Largest Producers on The Market and Their Profiles
This Chapter is Available Only for the Professional Edition PRO -
11. COUNTRY PROFILES
The Largest Markets And Their Profiles
This Chapter is Available Only for the Professional Edition PRO- United States
- China
- Japan
- Germany
- United Kingdom
- France
- Brazil
- Italy
- Russian Federation
- India
- Canada
- Australia
- Republic of Korea
- Spain
- Mexico
- Indonesia
- Netherlands
- Turkey
- Saudi Arabia
- Switzerland
- Sweden
- Nigeria
- Poland
- Belgium
- Argentina
- Norway
- Austria
- Thailand
- United Arab Emirates
- Colombia
- Denmark
- South Africa
- Malaysia
- Israel
- Singapore
- Egypt
- Philippines
- Finland
- Chile
- Ireland
- Pakistan
- Greece
- Portugal
- Kazakhstan
- Algeria
- Czech Republic
- Qatar
- Peru
- Romania
- Vietnam
-
LIST OF TABLES
- Key Findings In 2023
- Market Volume, In Physical Terms, 2012–2023
- Market Value, 2012–2023
- Per Capita Consumption, By Country, 2018–2023
- Production, In Physical Terms, By Country, 2012–2023
- Imports, In Physical Terms, By Country, 2012–2023
- Imports, In Value Terms, By Country, 2012–2023
- Import Prices, By Country Of Destination, 2012–2023
- Exports, In Physical Terms, By Country, 2012–2023
- Exports, In Value Terms, By Country, 2012–2023
- Export Prices, By Country Of Origin, 2012–2023
-
LIST OF FIGURES
- Market Volume, In Physical Terms, 2012–2023
- Market Value, 2012–2023
- Consumption, By Country, 2023
- Market Volume Forecast to 2030
- Market Value Forecast to 2030
- Products: Market Size And Growth, By Type
- Products: Average Per Capita Consumption, By Type
- Products: Exports And Growth, By Type
- Products: Export Prices And Growth, By Type
- Production Volume And Growth
- Exports And Growth
- Export Prices And Growth
- Market Size And Growth
- Per Capita Consumption
- Imports And Growth
- Import Prices
- Production, In Physical Terms, 2012–2023
- Production, In Value Terms, 2012–2023
- Production, By Country, 2023
- Production, In Physical Terms, By Country, 2012–2023
- Imports, In Physical Terms, 2012–2023
- Imports, In Value Terms, 2012–2023
- Imports, In Physical Terms, By Country, 2023
- Imports, In Physical Terms, By Country, 2012–2023
- Imports, In Value Terms, By Country, 2012–2023
- Import Prices, By Country, 2012–2023
- Exports, In Physical Terms, 2012–2023
- Exports, In Value Terms, 2012–2023
- Exports, In Physical Terms, By Country, 2023
- Exports, In Physical Terms, By Country, 2012–2023
- Exports, In Value Terms, By Country, 2012–2023
- Export Prices, 2012–2023


