Canada - Electronic Machines And Appliances For Testing Metals - Market Analysis, Forecast, Size, Trends And Insights
Get instant access to more than 2 million reports, dashboards, and datasets on the IndexBox Platform.
View PricingElectronic Metal Tester Price in Canada - 2023
Contents:
- Electronic Metal Tester Price in Canada (FOB) - 2022
- Electronic Metal Tester Price in Canada (CIF) - 2021
- Electronic Metal Tester Exports in Canada
- Electronic Metal Tester Imports in Canada
Electronic Metal Tester Price in Canada (FOB) - 2022
In 2022, the average electronic metal tester export price amounted to $36,961 per unit, reducing by -25.6% against the previous year. Overall, export price indicated a slight expansion from 2012 to 2022: its price increased at an average annual rate of +1.8% over the last decade. The trend pattern, however, indicated some noticeable fluctuations being recorded throughout the analyzed period. The most prominent rate of growth was recorded in 2021 an increase of 21%. As a result, the export price reached the peak level of $49,670 per unit, and then shrank notably in the following year.
Average prices varied noticeably for the major foreign markets. In 2022, amid the top suppliers, the highest price was recorded for prices to China ($36,961 per unit) and Mexico ($36,961 per unit), while the average price for exports to Oman ($36,961 per unit) and the United States ($36,961 per unit) were amongst the lowest.
From 2012 to 2022, the most notable rate of growth in terms of prices was recorded for supplies to Oman (+19.2%), while the prices for the other major destinations experienced more modest paces of growth.
Electronic Metal Tester Price in Canada (CIF) - 2021
In December 2021, the average electronic metal tester import price amounted to $37,604 per unit, remaining relatively unchanged against the previous month. Over the period under review, the import price saw a slight reduction. The pace of growth was the most pronounced in August 2021 an increase of 3.7% against the previous month. The import price peaked at $41,815 per unit in January 2021; afterwards, it flattened through to December 2021.
Average prices varied somewhat amongst the major supplying countries. In December 2021, the countries with the highest prices were Japan ($46,997 per unit) and Finland ($39,103 per unit), while the price for Singapore ($35,248 per unit) and Taiwan (Chinese) ($35,746 per unit) were amongst the lowest.
From January 2021 to December 2021, the most notable rate of growth in terms of prices was attained by Spain (+9.2%), while the prices for the other major suppliers experienced more modest paces of growth.
Electronic Metal Tester Exports in Canada
In 2022, the amount of electronic machines and appliances for testing metals exported from Canada expanded rapidly to 398 units, surging by 9.6% compared with 2021 figures. Over the period under review, total exports indicated a prominent expansion from 2019 to 2022: its volume increased at an average annual rate of +16.3% over the last three years. The trend pattern, however, indicated some noticeable fluctuations being recorded throughout the analyzed period. Based on 2022 figures, exports increased by +57.3% against 2019 indices. The most prominent rate of growth was recorded in 2021 when exports increased by 32%. Over the period under review, the exports attained the peak figure in 2022 and are likely to see steady growth in the immediate term.
In value terms, electronic metal tester exports shrank sharply to $15M in 2022. In general, exports continue to indicate a prominent expansion. The most prominent rate of growth was recorded in 2021 with an increase of 59% against the previous year. As a result, the exports reached the peak of $18M, and then declined remarkably in the following year.
| Export of Electronic Metal Tester in Canada (Million USD) | |||||
|---|---|---|---|---|---|
| COUNTRY | 2019 | 2020 | 2021 | 2022 | CAGR, 2019-2022 |
| United States | 7.0 | 9.5 | 16.2 | 12.8 | 22.3% |
| India | 0.1 | 0.2 | 0.1 | 0.6 | 81.7% |
| Oman | N/A | N/A | N/A | 0.3 | 0% |
| Others | 1.6 | 1.6 | 1.7 | 1.0 | -14.5% |
| Total | 8.7 | 11.3 | 18.0 | 14.7 | 19.1% |
Top Export Markets for Electronic Metal Tester from Canada in 2022:
- United States (346.0 units)
- India (17.0 units)
- Oman (8.0 units)
Electronic Metal Tester Imports in Canada
In 2022, overseas purchases of electronic machines and appliances for testing metals were finally on the rise to reach 667 units for the first time since 2019, thus ending a two-year declining trend. In general, imports enjoyed a buoyant increase. As a result, imports attained the peak and are likely to continue growth in the immediate term.
In value terms, electronic metal tester imports surged to $14M in 2022. Over the period under review, imports, however, recorded a noticeable setback. Over the period under review, imports attained the peak figure at $16M in 2019; however, from 2020 to 2022, imports remained at a lower figure.
| Import of Electronic Metal Tester in Canada (Million USD) | |||||
|---|---|---|---|---|---|
| COUNTRY | 2019 | 2020 | 2021 | 2022 | CAGR, 2019-2022 |
| United States | 10.3 | 8.6 | 7.7 | 9.8 | -1.6% |
| United Kingdom | 0.4 | 0.5 | 0.5 | 1.1 | 40.1% |
| China | 0.7 | 1.5 | 0.9 | 0.9 | 8.7% |
| Germany | 1.9 | 0.6 | 0.8 | 0.6 | -31.9% |
| Netherlands | 0.3 | N/A | 0.2 | 0.5 | 18.6% |
| India | 0.1 | 0.2 | 0.3 | 0.3 | 44.2% |
| Switzerland | 0.6 | 0.1 | 0.2 | 0.2 | -30.7% |
| Others | 1.7 | 1.0 | 1.0 | 0.7 | -25.6% |
| Total | 16.0 | 12.5 | 11.6 | 14.1 | -4.1% |
Top Suppliers of Electronic Metal Tester to Canada in 2022:
- United States (463.0 units)
- United Kingdom (51.0 units)
- China (40.0 units)
- Germany (28.0 units)
- Netherlands (25.0 units)
- India (14.0 units)
- Switzerland (8.0 units)
This report provides an in-depth analysis of the electronic metal tester market in Canada. Within it, you will discover the latest data on market trends and opportunities by country, consumption, production and price developments, as well as the global trade (imports and exports). The forecast exhibits the market prospects through 2030.
Product coverage:
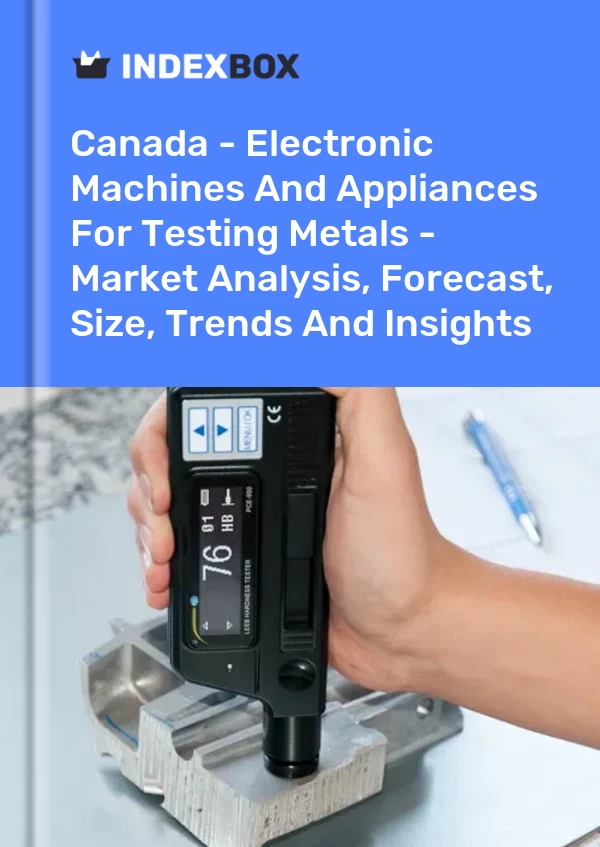
- Prodcom 26516210 - Electronic machines and appliances for testing the mechanical properties of metals (excluding metallographic machines or appliances, instruments for detecting defects)
Country coverage:
- Canada
Data coverage:
- Market volume and value
- Per Capita consumption
- Forecast of the market dynamics in the medium term
- Trade (exports and imports) in Canada
- Export and import prices
- Market trends, drivers and restraints
- Key market players and their profiles
Reasons to buy this report:
- Take advantage of the latest data
- Find deeper insights into current market developments
- Discover vital success factors affecting the market
This report is designed for manufacturers, distributors, importers, and wholesalers, as well as for investors, consultants and advisors.
In this report, you can find information that helps you to make informed decisions on the following issues:
- How to diversify your business and benefit from new market opportunities
- How to load your idle production capacity
- How to boost your sales on overseas markets
- How to increase your profit margins
- How to make your supply chain more sustainable
- How to reduce your production and supply chain costs
- How to outsource production to other countries
- How to prepare your business for global expansion
While doing this research, we combine the accumulated expertise of our analysts and the capabilities of artificial intelligence. The AI-based platform, developed by our data scientists, constitutes the key working tool for business analysts, empowering them to discover deep insights and ideas from the marketing data.
-
1. INTRODUCTION
Making Data-Driven Decisions to Grow Your Business
- REPORT DESCRIPTION
- RESEARCH METHODOLOGY AND AI PLATFORM
- DATA-DRIVEN DECISIONS FOR YOUR BUSINESS
- GLOSSARY AND SPECIFIC TERMS
-
2. EXECUTIVE SUMMARY
A Quick Overview of Market Performance
- KEY FINDINGS
- MARKET TRENDS This Chapter is Available Only for the Professional Edition PRO
-
3. MARKET OVERVIEW
Understanding the Current State of The Market and Its Prospects
- MARKET SIZE
- MARKET STRUCTURE
- TRADE BALANCE
- PER CAPITA CONSUMPTION
- MARKET FORECAST TO 2030
-
4. MOST PROMISING PRODUCT
Finding New Products to Diversify Your Business
This Chapter is Available Only for the Professional Edition PRO- TOP PRODUCTS TO DIVERSIFY YOUR BUSINESS
- BEST-SELLING PRODUCTS
- MOST CONSUMED PRODUCT
- MOST TRADED PRODUCT
- MOST PROFITABLE PRODUCT FOR EXPORT
-
5. MOST PROMISING SUPPLYING COUNTRIES
Choosing the Best Countries to Establish Your Sustainable Supply Chain
This Chapter is Available Only for the Professional Edition PRO- TOP COUNTRIES TO SOURCE YOUR PRODUCT
- TOP PRODUCING COUNTRIES
- TOP EXPORTING COUNTRIES
- LOW-COST EXPORTING COUNTRIES
-
6. MOST PROMISING OVERSEAS MARKETS
Choosing the Best Countries to Boost Your Exports
This Chapter is Available Only for the Professional Edition PRO- TOP OVERSEAS MARKETS FOR EXPORTING YOUR PRODUCT
- TOP CONSUMING MARKETS
- UNSATURATED MARKETS
- TOP IMPORTING MARKETS
- MOST PROFITABLE MARKETS
7. PRODUCTION
The Latest Trends and Insights into The Industry
- PRODUCTION VOLUME AND VALUE
8. IMPORTS
The Largest Import Supplying Countries
- IMPORTS FROM 2012–2023
- IMPORTS BY COUNTRY
- IMPORT PRICES BY COUNTRY
9. EXPORTS
The Largest Destinations for Exports
- EXPORTS FROM 2012–2023
- EXPORTS BY COUNTRY
- EXPORT PRICES BY COUNTRY
-
10. PROFILES OF MAJOR PRODUCERS
The Largest Producers on The Market and Their Profiles
This Chapter is Available Only for the Professional Edition PRO -
LIST OF TABLES
- Key Findings In 2023
- Market Volume, In Physical Terms, 2012–2023
- Market Value, 2012–2023
- Per Capita Consumption In 2012-2023
- Imports, In Physical Terms, By Country, 2012–2023
- Imports, In Value Terms, By Country, 2012–2023
- Import Prices, By Country Of Origin, 2012–2023
- Exports, In Physical Terms, By Country, 2012–2023
- Exports, In Value Terms, By Country, 2012–2023
- Export Prices, By Country Of Destination, 2012–2023
-
LIST OF FIGURES
- Market Volume, In Physical Terms, 2012–2023
- Market Value, 2012–2023
- Market Structure – Domestic Supply vs. Imports, In Physical Terms, 2012-2023
- Market Structure – Domestic Supply vs. Imports, In Value Terms, 2012-2023
- Trade Balance, In Physical Terms, 2012-2023
- Trade Balance, In Value Terms, 2012-2023
- Per Capita Consumption, 2012-2023
- Market Volume Forecast to 2030
- Market Value Forecast to 2030
- Products: Market Size And Growth, By Type
- Products: Average Per Capita Consumption, By Type
- Products: Exports And Growth, By Type
- Products: Export Prices And Growth, By Type
- Production Volume And Growth
- Exports And Growth
- Export Prices And Growth
- Market Size And Growth
- Per Capita Consumption
- Imports And Growth
- Import Prices
- Production, In Physical Terms, 2012–2023
- Production, In Value Terms, 2012–2023
- Imports, In Physical Terms, 2012–2023
- Imports, In Value Terms, 2012–2023
- Imports, In Physical Terms, By Country, 2023
- Imports, In Physical Terms, By Country, 2012–2023
- Imports, In Value Terms, By Country, 2012–2023
- Import Prices, By Country Of Origin, 2012–2023
- Exports, In Physical Terms, 2012–2023
- Exports, In Value Terms, 2012–2023
- Exports, In Physical Terms, By Country, 2023
- Exports, In Physical Terms, By Country, 2012–2023
- Exports, In Value Terms, By Country, 2012–2023
- Export Prices, By Country Of Destination, 2012–2023
This report provides an in-depth analysis of the electronic metal tester market in Canada.
This report provides an in-depth analysis of the non-electronic metal tester market in Canada.
This report provides an in-depth analysis of the electronic material tester market in Canada.
This report provides an in-depth analysis of the non-electronic material tester market in Canada.
This report provides an in-depth analysis of the tea market in Canada.
This report provides an in-depth analysis of the market for stuffed pasta and couscous in Canada.
This report provides an in-depth analysis of the couscous market in Canada.
This report provides an in-depth analysis of the m-xylene and xylenes market in Canada.
This report provides an in-depth analysis of the o-xylene market in Canada.
This report provides an in-depth analysis of the p-xylene market in Canada.
The Electronic Metal Tester exports reached record highs in 2023 and are projected to continue growing in the future, with a value of $23M.
In February 2023, the pasta and couscous price stood at $3,500 per ton (CIF, Canada), growing by 4.4% against the previous month.
The most significant growth rate was observed in July 2023, with exports increasing by 111% month-on-month. In terms of value, Couscous exports declined slightly to $891K in October 2023.
In August 2022, the couscous price stood at $2,040 per ton (FOB, Canada), jumping by 24% against the previous month.
Discover the top import markets for tea around the world based on data from the IndexBox market intelligence platform.
The tea market is growing rapidly, with new brands and products emerging all the time. But what trends are driving this growth?
The global tea market revenue amounted to $25.9B in 2018, picking up by 7.7% against the previous year. Overall, the total market indicated strong growth from 2007 to 2018: its value increased at an average annual rate of +4.3% over that period. Global
Global tea consumption amounted to X thousand tons in 2015, growing by +X% against the previous year level.
Global tea imports amounted to X thousand tons in 2015, declining by -X% against the previous year level.
From 2008 to 2015, global exports on the tea market showed mixed dynamics, amounting to X thousand tons in 2015. In value terms, they dropped to X million USD in 2015, which was X million USD less than the year before.


