Hong Kong SAR, China - Dates - Market Analysis, Forecast, Size, Trends and Insights
Get instant access to more than 2 million reports, dashboards, and datasets on the IndexBox Platform.
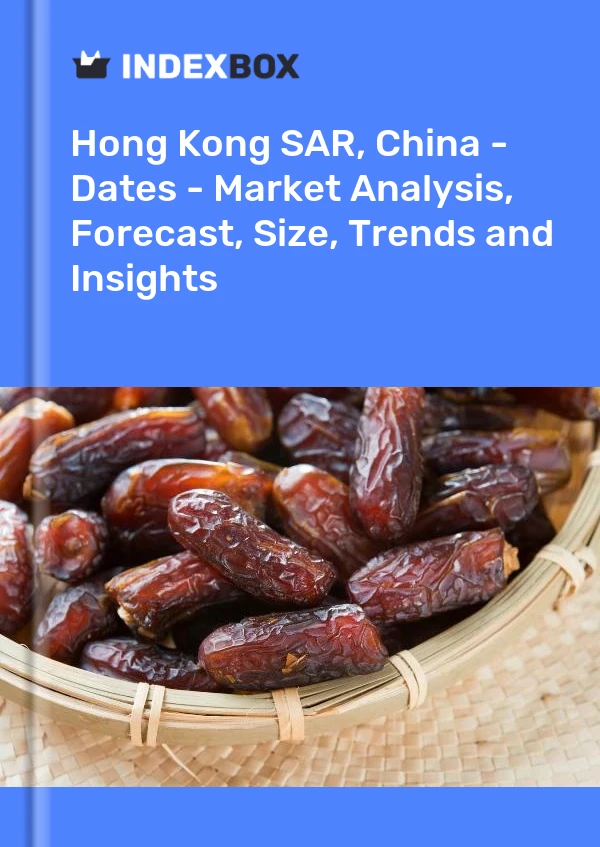
View PricingDate Price in Hong Kong SAR - 2023
Contents:
- Date Price in Hong Kong SAR (CIF) - 2023
- Date Price in Hong Kong SAR (FOB) - 2022
- Date Imports in Hong Kong SAR
- Date Exports in Hong Kong SAR
Date Price in Hong Kong SAR (CIF) - 2023
In June 2023, the average date import price amounted to $3,851 per ton, increasing by 16% against the previous month. In general, import price indicated a moderate increase from June 2022 to June 2023: its price increased at an average monthly rate of +2.9% over the last twelve-month period. The trend pattern, however, indicated some noticeable fluctuations being recorded throughout the analyzed period. Based on June 2023 figures, date import price increased by +85.4% against April 2023 indices. The pace of growth appeared the most rapid in July 2022 when the average import price increased by 79% month-to-month. As a result, import price reached the peak level of $4,899 per ton. From August 2022 to June 2023, the average import prices failed to regain momentum.
Prices varied noticeably by the country of origin: the country with the highest price was Taiwan (Chinese) ($14,724 per ton), while the price for China ($3,568 per ton) was amongst the lowest.
From June 2022 to June 2023, the most notable rate of growth in terms of prices was attained by China (+2.4%), while the prices for the other major suppliers experienced more modest paces of growth.
Date Price in Hong Kong SAR (FOB) - 2022
In 2022, the average date export price amounted to $3,579 per ton, with a decrease of -2.2% against the previous year. Over the last decade, it increased at an average annual rate of +4.1%. The pace of growth appeared the most rapid in 2014 when the average export price increased by 30%. Over the period under review, the average export prices hit record highs at $3,660 per ton in 2021, and then contracted in the following year.
There were significant differences in the average prices for the major foreign markets. In 2022, amid the top suppliers, the country with the highest price was Macao SAR ($7,142 per ton), while the average price for exports to China ($660 per ton) was amongst the lowest.
From 2012 to 2022, the most notable rate of growth in terms of prices was recorded for supplies to Singapore (+18.3%), while the prices for the other major destinations experienced more modest paces of growth.
Date Imports in Hong Kong SAR
In 2022, supplies from abroad of dates was finally on the rise to reach 616 tons for the first time since 2019, thus ending a two-year declining trend. Overall, imports continue to indicate a significant increase. As a result, imports reached the peak and are likely to continue growth in the immediate term.
In value terms, date imports surged to $2.1M in 2022. In general, imports recorded a remarkable increase. As a result, imports reached the peak and are likely to continue growth in the immediate term.
| Import of Date in Hong Kong SAR (Thousand USD) | |||||
|---|---|---|---|---|---|
| COUNTRY | 2019 | 2020 | 2021 | 2022 | CAGR, 2019-2022 |
| China | 143 | 89.7 | 46.3 | 1,362 | 112.0% |
| Tunisia | 262 | 257 | 140 | 114 | -24.2% |
| Israel | 77.5 | 81.1 | 112 | 91.3 | 5.6% |
| Turkey | 199 | 71.8 | 106 | 69.3 | -29.6% |
| Taiwan (Chinese) | 152 | 152 | 113 | 68.6 | -23.3% |
| Algeria | 72.4 | 29.0 | 29.2 | 63.8 | -4.1% |
| Saudi Arabia | 62.5 | 233 | 170 | 37.3 | -15.8% |
| United Arab Emirates | 103 | 20.5 | 18.4 | N/A | -57.7% |
| Others | 284 | 347 | 339 | 341 | 6.3% |
| Total | 1,355 | 1,281 | 1,073 | 2,147 | 16.6% |
Top Suppliers of Date to Hong Kong SAR in 2022:
- China (467.2 tons)
- Tunisia (40.7 tons)
- Taiwan (Chinese) (24.8 tons)
- Algeria (18.3 tons)
- Israel (10.1 tons)
- Saudi Arabia (10.0 tons)
- Turkey (9.9 tons)
Date Exports in Hong Kong SAR
In 2022, approx. 134 tons of dates were exported from Hong Kong SAR; with a decrease of -15.2% compared with 2021. Overall, exports saw a dramatic decrease. The smallest decline of -2% was in 2021.
In value terms, date exports dropped remarkably to $481K in 2022. In general, exports continue to indicate a abrupt curtailment. The pace of growth appeared the most rapid in 2021 when exports increased by 0.3% against the previous year.
| Export of Date in Hong Kong SAR (Thousand USD) | |||||
|---|---|---|---|---|---|
| COUNTRY | 2019 | 2020 | 2021 | 2022 | CAGR, 2019-2022 |
| Canada | 205 | 281 | 250 | 196 | -1.5% |
| Macao SAR | 31.9 | 56.1 | 84.3 | 106 | 49.2% |
| Australia | 17.2 | 75.9 | 59.7 | 68.5 | 58.5% |
| Malaysia | 8.1 | 8.7 | 58.5 | 49.7 | 83.1% |
| United States | 47.9 | 95.1 | 55.7 | 19.6 | -25.8% |
| China | 8.3 | 5.3 | 30.6 | 19.2 | 32.3% |
| Thailand | 14.1 | N/A | N/A | N/A | 0% |
| Taiwan (Chinese) | 31.0 | 21.4 | 0.2 | N/A | -92.0% |
| Others | 500 | 34.7 | 40.8 | 22.0 | -64.7% |
| Total | 864 | 578 | 580 | 481 | -17.7% |
Top Export Markets for Date from Hong Kong SAR in 2022:
- Canada (50.7 tons)
- China (29.2 tons)
- Australia (16.6 tons)
- Macao SAR (14.9 tons)
- Malaysia (14.0 tons)
- United States (5.0 tons)
This report provides an in-depth analysis of the date market in Hong Kong SAR, China. Within it, you will discover the latest data on market trends and opportunities by country, consumption, production and price developments, as well as the global trade (imports and exports). The forecast exhibits the market prospects through 2030.
Product coverage:
- FCL 577 - Dates
Country coverage:
- Hong Kong SAR
Data coverage:
- Market volume and value
- Per Capita consumption
- Forecast of the market dynamics in the medium term
- Trade (exports and imports) in Hong Kong SAR, China
- Export and import prices
- Market trends, drivers and restraints
- Key market players and their profiles
Reasons to buy this report:
- Take advantage of the latest data
- Find deeper insights into current market developments
- Discover vital success factors affecting the market
This report is designed for manufacturers, distributors, importers, and wholesalers, as well as for investors, consultants and advisors.
In this report, you can find information that helps you to make informed decisions on the following issues:
- How to diversify your business and benefit from new market opportunities
- How to load your idle production capacity
- How to boost your sales on overseas markets
- How to increase your profit margins
- How to make your supply chain more sustainable
- How to reduce your production and supply chain costs
- How to outsource production to other countries
- How to prepare your business for global expansion
While doing this research, we combine the accumulated expertise of our analysts and the capabilities of artificial intelligence. The AI-based platform, developed by our data scientists, constitutes the key working tool for business analysts, empowering them to discover deep insights and ideas from the marketing data.
-
1. INTRODUCTION
Making Data-Driven Decisions to Grow Your Business
- REPORT DESCRIPTION
- RESEARCH METHODOLOGY AND AI PLATFORM
- DATA-DRIVEN DECISIONS FOR YOUR BUSINESS
- GLOSSARY AND SPECIFIC TERMS
-
2. EXECUTIVE SUMMARY
A Quick Overview of Market Performance
- KEY FINDINGS
- MARKET TRENDS This Chapter is Available Only for the Professional Edition PRO
-
3. MARKET OVERVIEW
Understanding the Current State of The Market and Its Prospects
- MARKET SIZE
- MARKET STRUCTURE
- TRADE BALANCE
- PER CAPITA CONSUMPTION
- MARKET FORECAST TO 2030
-
4. MOST PROMISING PRODUCT
Finding New Products to Diversify Your Business
This Chapter is Available Only for the Professional Edition PRO- TOP PRODUCTS TO DIVERSIFY YOUR BUSINESS
- BEST-SELLING PRODUCTS
- MOST CONSUMED PRODUCT
- MOST TRADED PRODUCT
- MOST PROFITABLE PRODUCT FOR EXPORT
-
5. MOST PROMISING SUPPLYING COUNTRIES
Choosing the Best Countries to Establish Your Sustainable Supply Chain
This Chapter is Available Only for the Professional Edition PRO- TOP COUNTRIES TO SOURCE YOUR PRODUCT
- TOP PRODUCING COUNTRIES
- COUNTRIES WITH TOP YIELDS
- TOP EXPORTING COUNTRIES
- LOW-COST EXPORTING COUNTRIES
-
6. MOST PROMISING OVERSEAS MARKETS
Choosing the Best Countries to Boost Your Exports
This Chapter is Available Only for the Professional Edition PRO- TOP OVERSEAS MARKETS FOR EXPORTING YOUR PRODUCT
- TOP CONSUMING MARKETS
- UNSATURATED MARKETS
- TOP IMPORTING MARKETS
- MOST PROFITABLE MARKETS
7. PRODUCTION
The Latest Trends and Insights into The Industry
- PRODUCTION, HARVESTED AREA AND YIELD
8. IMPORTS
The Largest Import Supplying Countries
- IMPORTS FROM 2012–2023
- IMPORTS BY COUNTRY
- IMPORT PRICES BY COUNTRY
9. EXPORTS
The Largest Destinations for Exports
- EXPORTS FROM 2012–2023
- EXPORTS BY COUNTRY
- EXPORT PRICES BY COUNTRY
-
10. PROFILES OF MAJOR PRODUCERS
The Largest Producers on The Market and Their Profiles
This Chapter is Available Only for the Professional Edition PRO -
LIST OF TABLES
- Key Findings In 2023
- Market Volume, In Physical Terms, 2012–2023
- Market Value, 2012–2023
- Per Capita Consumption In 2012-2023
- Imports, In Physical Terms, By Country, 2012–2023
- Imports, In Value Terms, By Country, 2012–2023
- Import Prices, By Country Of Origin, 2012–2023
- Exports, In Physical Terms, By Country, 2012–2023
- Exports, In Value Terms, By Country, 2012–2023
- Export Prices, By Country Of Destination, 2012–2023
-
LIST OF FIGURES
- Market Volume, In Physical Terms, 2012–2023
- Market Value, 2012–2023
- Market Structure – Domestic Supply vs. Imports, In Physical Terms, 2012-2023
- Market Structure – Domestic Supply vs. Imports, In Value Terms, 2012-2023
- Trade Balance, In Physical Terms, 2012-2023
- Trade Balance, In Value Terms, 2012-2023
- Per Capita Consumption, 2012-2023
- Market Volume Forecast to 2030
- Market Value Forecast to 2030
- Products: Market Size And Growth, By Type
- Products: Average Per Capita Consumption, By Type
- Products: Exports And Growth, By Type
- Products: Export Prices And Growth, By Type
- Production Volume And Growth
- Yield And Growth
- Exports And Growth
- Export Prices And Growth
- Market Size And Growth
- Per Capita Consumption
- Imports And Growth
- Import Prices
- Production, In Physical Terms, 2012–2023
- Production, In Value Terms, 2012–2023
- Area Harvested, 2012–2023
- Yield, 2012–2023
- Imports, In Physical Terms, 2012–2023
- Imports, In Value Terms, 2012–2023
- Imports, In Physical Terms, By Country, 2023
- Imports, In Physical Terms, By Country, 2012–2023
- Imports, In Value Terms, By Country, 2012–2023
- Import Prices, By Country Of Origin, 2012–2023
- Exports, In Physical Terms, 2012–2023
- Exports, In Value Terms, 2012–2023
- Exports, In Physical Terms, By Country, 2023
- Exports, In Physical Terms, By Country, 2012–2023
- Exports, In Value Terms, By Country, 2012–2023
- Export Prices, By Country Of Destination, 2012–2023
This report provides an in-depth analysis of the date market in Hong Kong SAR, China.
This report provides an in-depth analysis of the pineapple market in Hong Kong SAR, China.
This report provides an in-depth analysis of the avocado market in Hong Kong SAR, China.
This report provides an in-depth analysis of the fig market in Hong Kong SAR, China.
This report provides an in-depth analysis of the mango and mangosteen market in Hong Kong SAR, China.
This report provides an in-depth analysis of the global date market.
This report provides an in-depth analysis of the global pineapple market.
This report provides an in-depth analysis of the global avocado market.
This report provides an in-depth analysis of the global fig market.
This report provides an in-depth analysis of the global mango and mangosteen market.
From May 2023 to September 2023, the import growth of Date remained at a slightly lower figure. In terms of value, Date imports significantly declined to $152K in September 2023.
The price of Pineapple in May 2023 was $1,214 per ton (CIF, Hong Kong), showing a 9% growth compared to the previous month.
The growth rate of Fig imports was most significant in July 2023, with a month-on-month increase of 403%. However, the value of fig imports sharply dropped to $1.4M in November 2023.
In June 2023, the Fig price increased by 58% to reach $10,611 per ton (CIF, Hong Kong) compared to the previous month.
From March 2023 to October 2023, the import growth for Mango And Mangosteen failed to pick up pace. The value of imports for mango and mangosteen slightly declined to $7.2M in October 2023.
The countries with the highest volumes of date consumption in 2018 were Egypt (1.6M tons), Algeria (1.1M tons) and Iran (1M tons), together accounting for 44% of global consumption.
Global date consumption amounted to X thousand tons in 2015, declining by -X% against the previous year level.
Global date exports amounted to X thousand tons in 2015, picking up by +X% against the previous year level.
Global date imports amounted to X thousand tons in 2015, declining by -X% against the previous year level.
In 2015, the countries with the highest levels of date production were Egypt (X thousand tons), Iran (X thousand tons), Algeria (X thousand tons), together accounting for X% of total output.


