
U.S. Industrial Valve Market. Analysis And Forecast to 2030
Get instant access to more than 2 million reports, dashboards, and datasets on the IndexBox Platform.
View PricingImports of Industrial Valves in the United States Decline to $1B in June 2023
U.S. Industrial Valve Imports
In June 2023, imports of industrial valves into the United States contracted modestly to 47K tons, reducing by -2.6% against the previous month's figure. Overall, imports recorded a mild slump. The pace of growth was the most pronounced in April 2023 when imports increased by 14% against the previous month.
In value terms, industrial valve imports shrank to $1B (IndexBox estimates) in June 2023. In general, imports continue to indicate a relatively flat trend pattern. The pace of growth appeared the most rapid in August 2022 with an increase of 10% m-o-m. As a result, imports attained the peak of $1.2B. From September 2022 to June 2023, the growth of imports remained at a somewhat lower figure. 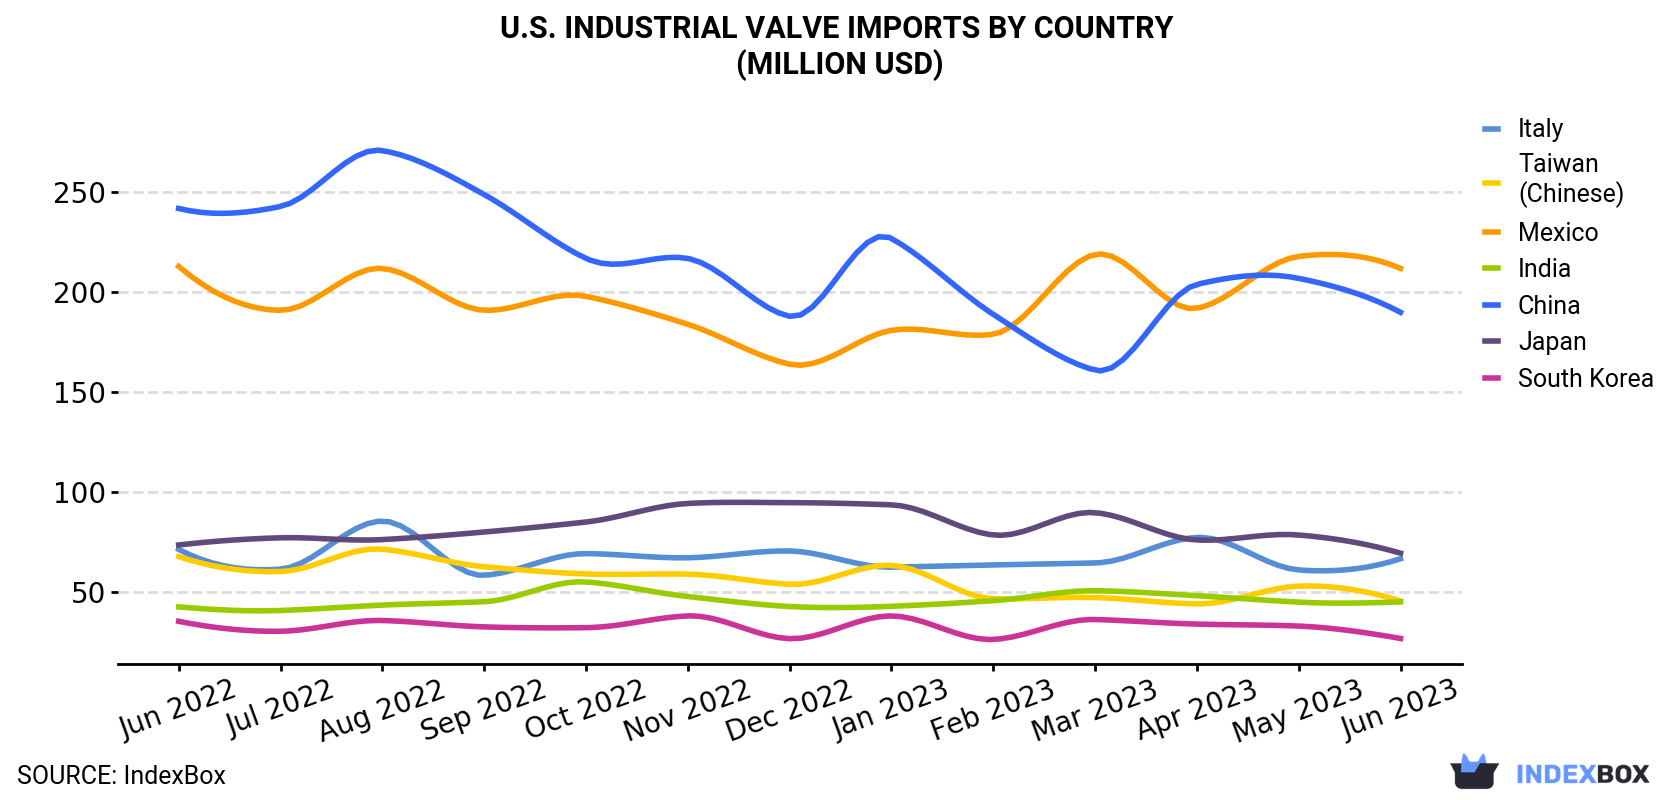
| COUNTRY | Import Value of Industrial Valve in U.S. (million USD) | ||||||||||||
|---|---|---|---|---|---|---|---|---|---|---|---|---|---|
| Jun 2022 | Jul 2022 | Aug 2022 | Sep 2022 | Oct 2022 | Nov 2022 | Dec 2022 | Jan 2023 | Feb 2023 | Mar 2023 | Apr 2023 | May 2023 | Jun 2023 | |
| Mexico | 213 | 191 | 212 | 191 | 198 | 184 | 164 | 181 | 179 | 219 | 192 | 218 | 212 |
| China | 242 | 243 | 271 | 249 | 217 | 217 | 188 | 227 | 189 | 161 | 204 | 207 | 190 |
| Japan | 73.5 | 77.1 | 76.2 | 80.0 | 85.0 | 94.3 | 94.7 | 93.6 | 78.5 | 89.7 | 76.0 | 78.5 | 69.4 |
| Italy | 71.3 | 61.4 | 85.5 | 58.3 | 69.2 | 67.1 | 70.5 | 62.4 | 63.5 | 64.5 | 77.3 | 61.0 | 66.6 |
| Taiwan (Chinese) | 67.7 | 60.2 | 71.4 | 62.6 | 59.0 | 58.9 | 53.8 | 63.3 | 46.6 | 47.2 | 44.0 | 52.9 | 45.5 |
| India | 42.5 | 40.7 | 43.4 | 45.1 | 55.0 | 47.7 | 42.7 | 42.8 | 45.6 | 50.6 | 48.1 | 44.9 | 45.0 |
| South Korea | 35.3 | 30.3 | 35.7 | 32.5 | 32.1 | 38.0 | 26.6 | 38.0 | 26.2 | 36.2 | 33.9 | 32.9 | 26.7 |
| Others | 371 | 364 | 383 | 398 | 376 | 348 | 372 | 364 | 357 | 400 | 353 | 367 | 394 |
| Total | 1,116 | 1,069 | 1,179 | 1,117 | 1,092 | 1,056 | 1,012 | 1,072 | 985 | 1,068 | 1,029 | 1,062 | 1,049 |
Imports by Country
In June 2023, China (17K tons) constituted the largest industrial valve supplier to the United States, accounting for a 37% share of total imports. Moreover, industrial valve imports from China exceeded the figures recorded by the second-largest supplier, Mexico (5.7K tons), threefold. The third position in this ranking was held by Italy (3.6K tons), with a 7.6% share.
From June 2022 to June 2023, the average monthly growth rate of volume from China amounted to -1.6%. The remaining supplying countries recorded the following average monthly rates of imports growth: Mexico (-1.7% per month) and Italy (-1.9% per month).
In value terms, Mexico ($212M), China ($190M) and Japan ($69M) were the largest industrial valve suppliers to the United States, together comprising 45% of total imports. These countries were followed by Italy, Taiwan (Chinese), India and South Korea, which together accounted for a further 18%.
India, with a CAGR of +0.5%, saw the highest rates of growth with regard to the value of imports, in terms of the main suppliers over the period under review, while purchases for the other leaders experienced a decline.
Import Prices by Country
In June 2023, the industrial valve price amounted to $22,161 per ton, therefore (CIF, US), remained relatively stable against the previous month. In general, the import price continues to indicate a relatively flat trend pattern. The pace of growth appeared the most rapid in March 2023 an increase of 9.9% against the previous month. As a result, import price reached the peak level of $24,886 per ton. From April 2023 to June 2023, the average import prices remained at a somewhat lower figure.
There were significant differences in the average prices amongst the major supplying countries. In June 2023, the country with the highest price was Germany ($43,934 per ton), while the price for Israel ($8,840 per ton) was amongst the lowest.
From June 2022 to June 2023, the most notable rate of growth in terms of prices was attained by Japan (+2.5%), while the prices for the other major suppliers experienced more modest paces of growth.
This report provides an in-depth analysis of the industrial valve market in the U.S.. Within it, you will discover the latest data on market trends and opportunities by country, consumption, production and price developments, as well as the global trade (imports and exports). The forecast exhibits the market prospects through 2030.
Product coverage:
- NAICS 332911 - Industrial valve manufacturing
Companies mentioned:
- Rexnord Corporation
- Curtiss-Wright Corporation
- American Cast Iron Pipe Company
- Watts Water Technologies
- GE Oil & Gas Pressure Control
- Mueller Water Products
- Armstrong International
- McWane
- Bray International
- Waterous Company
- Honeywell Analytics
- Kaman Industrial Technologies Corporation
- Xomox Corporation
- Velan Valve Corp.
- McC Holdings
- Flowserve FCD Corporation
- Engineered Controls International
- Pentair Valves & Controls US
- Dezurik, Apcom
- Control Components Inc.
- Dresser
- Gas Breaker
- Tyco Engineered Products & Services
- Fisher Controls International
- Stant Manufacturing
- Alfa Laval
- Curtiss-Wright Flow Control Corporation
- Pentair Valves & Controls
- Watts Regulator Co.
- Eproduction Solutions
- Automatic Switch Company
Country coverage:
- United States
Data coverage:
- Market volume and value
- Per Capita consumption
- Forecast of the market dynamics in the medium term
- Trade (exports and imports) in the U.S.
- Export and import prices
- Market trends, drivers and restraints
- Key market players and their profiles
Reasons to buy this report:
- Take advantage of the latest data
- Find deeper insights into current market developments
- Discover vital success factors affecting the market
This report is designed for manufacturers, distributors, importers, and wholesalers, as well as for investors, consultants and advisors.
In this report, you can find information that helps you to make informed decisions on the following issues:
- How to diversify your business and benefit from new market opportunities
- How to load your idle production capacity
- How to boost your sales on overseas markets
- How to increase your profit margins
- How to make your supply chain more sustainable
- How to reduce your production and supply chain costs
- How to outsource production to other countries
- How to prepare your business for global expansion
While doing this research, we combine the accumulated expertise of our analysts and the capabilities of artificial intelligence. The AI-based platform, developed by our data scientists, constitutes the key working tool for business analysts, empowering them to discover deep insights and ideas from the marketing data.
-
1. INTRODUCTION
Making Data-Driven Decisions to Grow Your Business
- REPORT DESCRIPTION
- RESEARCH METHODOLOGY AND AI PLATFORM
- DATA-DRIVEN DECISIONS FOR YOUR BUSINESS
- GLOSSARY AND SPECIFIC TERMS
-
2. EXECUTIVE SUMMARY
A Quick Overview of Market Performance
- KEY FINDINGS
- MARKET TRENDS This Chapter is Available Only for the Professional Edition PRO
-
3. MARKET OVERVIEW
Understanding the Current State of The Market and Its Prospects
- MARKET SIZE
- MARKET STRUCTURE
- TRADE BALANCE
- PER CAPITA CONSUMPTION
- MARKET FORECAST TO 2030
-
4. MOST PROMISING PRODUCT
Finding New Products to Diversify Your Business
This Chapter is Available Only for the Professional Edition PRO- TOP PRODUCTS TO DIVERSIFY YOUR BUSINESS
- BEST-SELLING PRODUCTS
- MOST CONSUMED PRODUCT
- MOST TRADED PRODUCT
- MOST PROFITABLE PRODUCT FOR EXPORT
-
5. MOST PROMISING SUPPLYING COUNTRIES
Choosing the Best Countries to Establish Your Sustainable Supply Chain
This Chapter is Available Only for the Professional Edition PRO- TOP COUNTRIES TO SOURCE YOUR PRODUCT
- TOP PRODUCING COUNTRIES
- TOP EXPORTING COUNTRIES
- LOW-COST EXPORTING COUNTRIES
-
6. MOST PROMISING OVERSEAS MARKETS
Choosing the Best Countries to Boost Your Exports
This Chapter is Available Only for the Professional Edition PRO- TOP OVERSEAS MARKETS FOR EXPORTING YOUR PRODUCT
- TOP CONSUMING MARKETS
- UNSATURATED MARKETS
- TOP IMPORTING MARKETS
- MOST PROFITABLE MARKETS
7. PRODUCTION
The Latest Trends and Insights into The Industry
- PRODUCTION VOLUME AND VALUE
8. IMPORTS
The Largest Import Supplying Countries
- IMPORTS FROM 2012–2023
- IMPORTS BY COUNTRY
- IMPORT PRICES BY COUNTRY
9. EXPORTS
The Largest Destinations for Exports
- EXPORTS FROM 2012–2023
- EXPORTS BY COUNTRY
- EXPORT PRICES BY COUNTRY
-
10. PROFILES OF MAJOR PRODUCERS
The Largest Producers on The Market and Their Profiles
This Chapter is Available Only for the Professional Edition PRO -
LIST OF TABLES
- Key Findings In 2023
- Market Volume, In Physical Terms, 2012–2023
- Market Value, 2012–2023
- Per Capita Consumption In 2012-2023
- Imports, In Physical Terms, By Country, 2012–2023
- Imports, In Value Terms, By Country, 2012–2023
- Import Prices, By Country Of Origin, 2012–2023
- Exports, In Physical Terms, By Country, 2012–2023
- Exports, In Value Terms, By Country, 2012–2023
- Export Prices, By Country Of Destination, 2012–2023
-
LIST OF FIGURES
- Market Volume, In Physical Terms, 2012–2023
- Market Value, 2012–2023
- Market Structure – Domestic Supply vs. Imports, In Physical Terms, 2012-2023
- Market Structure – Domestic Supply vs. Imports, In Value Terms, 2012-2023
- Trade Balance, In Physical Terms, 2012-2023
- Trade Balance, In Value Terms, 2012-2023
- Per Capita Consumption, 2012-2023
- Market Volume Forecast to 2030
- Market Value Forecast to 2030
- Products: Market Size And Growth, By Type
- Products: Average Per Capita Consumption, By Type
- Products: Exports And Growth, By Type
- Products: Export Prices And Growth, By Type
- Production Volume And Growth
- Exports And Growth
- Export Prices And Growth
- Market Size And Growth
- Per Capita Consumption
- Imports And Growth
- Import Prices
- Production, In Physical Terms, 2012–2023
- Production, In Value Terms, 2012–2023
- Imports, In Physical Terms, 2012–2023
- Imports, In Value Terms, 2012–2023
- Imports, In Physical Terms, By Country, 2023
- Imports, In Physical Terms, By Country, 2012–2023
- Imports, In Value Terms, By Country, 2012–2023
- Import Prices, By Country Of Origin, 2012–2023
- Exports, In Physical Terms, 2012–2023
- Exports, In Value Terms, 2012–2023
- Exports, In Physical Terms, By Country, 2023
- Exports, In Physical Terms, By Country, 2012–2023
- Exports, In Value Terms, By Country, 2012–2023
- Export Prices, By Country Of Destination, 2012–2023


