U.S. Rubber And Plastic Hoses And Belting Market. Analysis And Forecast to 2030
Get instant access to more than 2 million reports, dashboards, and datasets on the IndexBox Platform.
View PricingOctober 2023 Sees An 8% Surge in Hose and Belt Imports, Reaching $429M in the United States.
U.S. Hose And Belt Imports
In October 2023, supplies from abroad of rubber and plastic hoses and belting was finally on the rise to reach 53K tons for the first time since July 2023, thus ending a two-month declining trend. Over the period under review, imports, however, recorded a relatively flat trend pattern. The pace of growth appeared the most rapid in January 2023 when imports increased by 13% against the previous month.
In value terms, hose and belt imports expanded sharply to $429M (IndexBox estimates) in October 2023. Overall, imports, however, recorded a relatively flat trend pattern. The growth pace was the most rapid in March 2023 when imports increased by 11% against the previous month.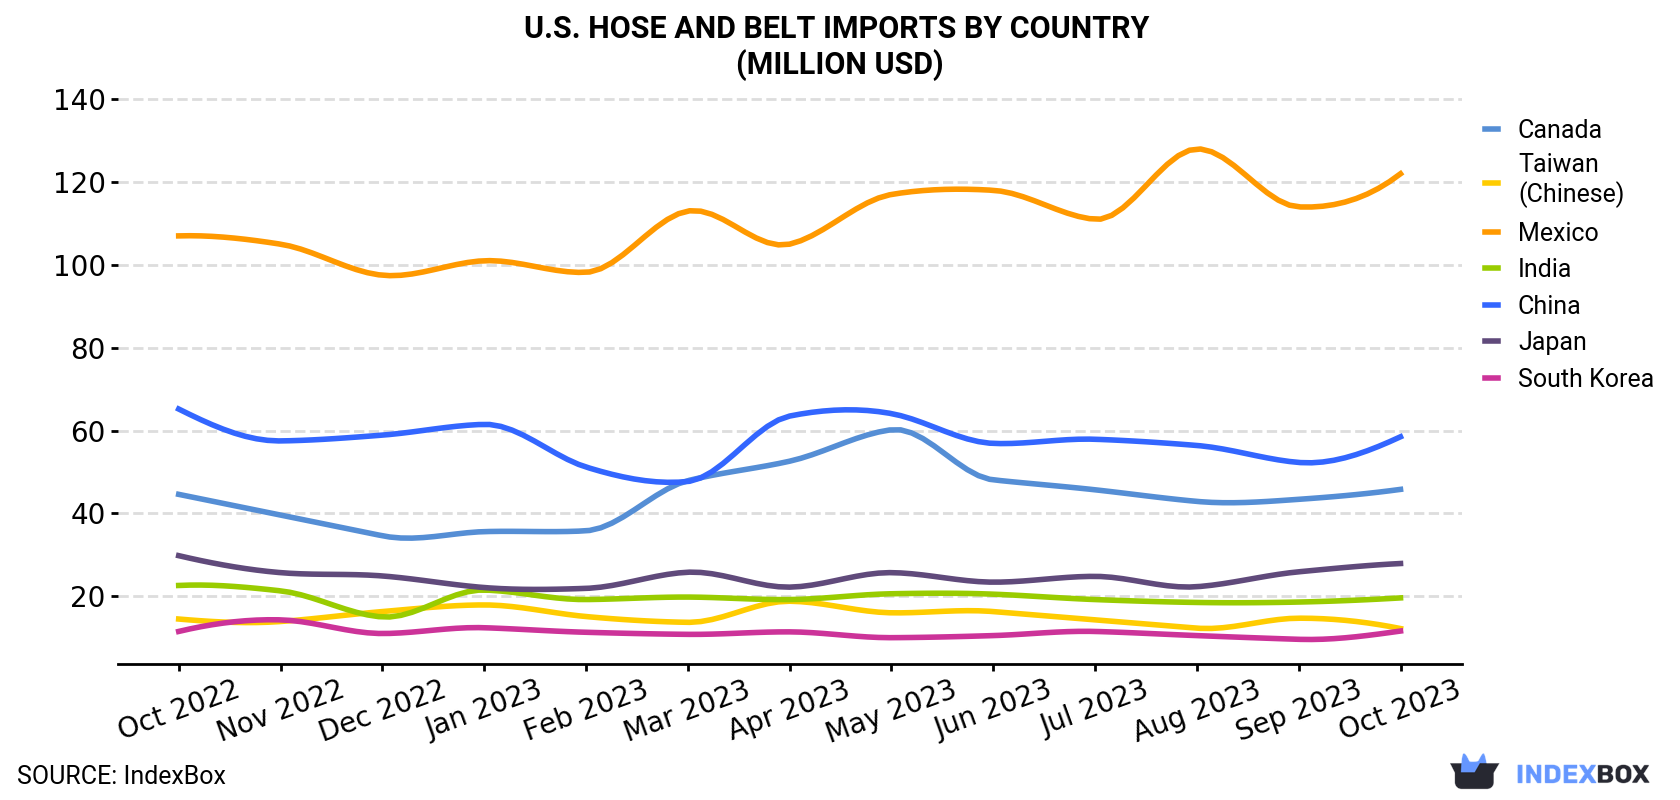
| COUNTRY | Import Value of Hose And Belt in U.S. (million USD) | ||||||||||||
|---|---|---|---|---|---|---|---|---|---|---|---|---|---|
| Oct 2022 | Nov 2022 | Dec 2022 | Jan 2023 | Feb 2023 | Mar 2023 | Apr 2023 | May 2023 | Jun 2023 | Jul 2023 | Aug 2023 | Sep 2023 | Oct 2023 | |
| Mexico | 107 | 105 | 97.5 | 101 | 98.2 | 113 | 105 | 117 | 118 | 111 | 128 | 114 | 122 |
| China | 65.2 | 57.5 | 58.9 | 61.5 | 51.2 | 47.7 | 63.5 | 64.1 | 56.9 | 57.9 | 56.4 | 52.3 | 58.5 |
| Canada | 44.6 | 39.6 | 34.6 | 35.6 | 35.8 | 47.9 | 52.6 | 60.2 | 48.1 | 45.7 | 42.9 | 43.4 | 45.8 |
| Japan | 29.8 | 25.7 | 24.9 | 22.1 | 21.9 | 25.8 | 22.2 | 25.7 | 23.4 | 24.8 | 22.3 | 25.9 | 27.9 |
| India | 22.6 | 21.3 | 15.0 | 21.5 | 19.2 | 19.8 | 19.2 | 20.6 | 20.5 | 19.2 | 18.5 | 18.6 | 19.6 |
| Taiwan (Chinese) | 14.5 | 13.9 | 16.3 | 17.9 | 15.1 | 13.7 | 18.8 | 16.0 | 16.3 | 14.3 | 12.3 | 14.7 | 12.2 |
| South Korea | 11.5 | 14.3 | 11.0 | 12.4 | 11.3 | 10.8 | 11.4 | 10.0 | 10.5 | 11.5 | 10.5 | 9.6 | 11.6 |
| Others | 139 | 139 | 129 | 144 | 118 | 132 | 129 | 125 | 116 | 130 | 133 | 117 | 131 |
| Total | 434 | 416 | 387 | 415 | 370 | 411 | 421 | 438 | 409 | 414 | 424 | 396 | 429 |
Imports by Country
China (14K tons), Mexico (14K tons) and Canada (5.3K tons) were the main suppliers of hose and belt imports to the United States, with a combined 63% share of total imports.
From October 2022 to October 2023, the most notable rate of growth in terms of purchases, amongst the main suppliers, was attained by Mexico (with a CAGR of +0.6%), while imports for the other leaders experienced mixed trend patterns.
In value terms, Mexico ($122M) constituted the largest supplier of hose and belt to the United States, comprising 28% of total imports. The second position in the ranking was held by China ($59M), with a 14% share of total imports. It was followed by Canada, with an 11% share.
From October 2022 to October 2023, the average monthly growth rate of value from Mexico stood at +1.1%. The remaining supplying countries recorded the following average monthly rates of imports growth: China (-0.9% per month) and Canada (+0.2% per month).
Import Prices by Country
In October 2023, the hose and belt price stood at $8,114 per ton (CIF, US), picking up by 1.6% against the previous month. Over the period under review, the import price continues to indicate a relatively flat trend pattern. The pace of growth was the most pronounced in August 2023 when the average import price increased by 6.6% against the previous month. As a result, import price reached the peak level of $8,185 per ton. From September 2023 to October 2023, the average import prices failed to regain momentum.
Prices varied noticeably by the country of origin: the country with the highest price was Germany ($18,524 per ton), while the price for Vietnam ($3,785 per ton) was amongst the lowest.
From October 2022 to October 2023, the most notable rate of growth in terms of prices was attained by Canada (+1.6%), while the prices for the other major suppliers experienced more modest paces of growth.
This report provides an in-depth analysis of the hose and belt market in the U.S.. Within it, you will discover the latest data on market trends and opportunities by country, consumption, production and price developments, as well as the global trade (imports and exports). The forecast exhibits the market prospects through 2030.
Product coverage:
- NAICS 326220 - Rubber and plastics hoses and belting manufacturing
Companies mentioned:
- The Gates Corporation
- Fiskars Brands
- TTI Floor Care North America
- DTR Industries
- J.G.B. Enterprises
- Beltservice Corporation
- Newage Industries
- Hitachi Cable America
- The Flexaust Company
- Titeflex Corporation
- Kongsberg Actuation Systems II
- Fna Group
- Ammeraal Beltech
- Bando Usa
- Flexible Technologies
- Tramec
- Teknor Apex Tennessee Company
- Tedd Smith
- All-American Holdings
- Contitech Thermopol
- Dayco Products
- Continental Plastics Co.
- U.S. Wire & Cable Corporation
- Tigerflex Corporation
- Plastic Specialties and Technologies
- Forbo Siegling
- Fenner U.S. Holdings
- Eaton-Aeroquip
- Aeroquip-Vickers
- HBD Industries
- All-American Hose
Country coverage:
- United States
Data coverage:
- Market volume and value
- Per Capita consumption
- Forecast of the market dynamics in the medium term
- Trade (exports and imports) in the U.S.
- Export and import prices
- Market trends, drivers and restraints
- Key market players and their profiles
Reasons to buy this report:
- Take advantage of the latest data
- Find deeper insights into current market developments
- Discover vital success factors affecting the market
This report is designed for manufacturers, distributors, importers, and wholesalers, as well as for investors, consultants and advisors.
In this report, you can find information that helps you to make informed decisions on the following issues:
- How to diversify your business and benefit from new market opportunities
- How to load your idle production capacity
- How to boost your sales on overseas markets
- How to increase your profit margins
- How to make your supply chain more sustainable
- How to reduce your production and supply chain costs
- How to outsource production to other countries
- How to prepare your business for global expansion
While doing this research, we combine the accumulated expertise of our analysts and the capabilities of artificial intelligence. The AI-based platform, developed by our data scientists, constitutes the key working tool for business analysts, empowering them to discover deep insights and ideas from the marketing data.
-
1. INTRODUCTION
Making Data-Driven Decisions to Grow Your Business
- REPORT DESCRIPTION
- RESEARCH METHODOLOGY AND AI PLATFORM
- DATA-DRIVEN DECISIONS FOR YOUR BUSINESS
- GLOSSARY AND SPECIFIC TERMS
-
2. EXECUTIVE SUMMARY
A Quick Overview of Market Performance
- KEY FINDINGS
- MARKET TRENDS This Chapter is Available Only for the Professional Edition PRO
-
3. MARKET OVERVIEW
Understanding the Current State of The Market and Its Prospects
- MARKET SIZE
- MARKET STRUCTURE
- TRADE BALANCE
- PER CAPITA CONSUMPTION
- MARKET FORECAST TO 2030
-
4. MOST PROMISING PRODUCT
Finding New Products to Diversify Your Business
This Chapter is Available Only for the Professional Edition PRO- TOP PRODUCTS TO DIVERSIFY YOUR BUSINESS
- BEST-SELLING PRODUCTS
- MOST CONSUMED PRODUCT
- MOST TRADED PRODUCT
- MOST PROFITABLE PRODUCT FOR EXPORT
-
5. MOST PROMISING SUPPLYING COUNTRIES
Choosing the Best Countries to Establish Your Sustainable Supply Chain
This Chapter is Available Only for the Professional Edition PRO- TOP COUNTRIES TO SOURCE YOUR PRODUCT
- TOP PRODUCING COUNTRIES
- TOP EXPORTING COUNTRIES
- LOW-COST EXPORTING COUNTRIES
-
6. MOST PROMISING OVERSEAS MARKETS
Choosing the Best Countries to Boost Your Exports
This Chapter is Available Only for the Professional Edition PRO- TOP OVERSEAS MARKETS FOR EXPORTING YOUR PRODUCT
- TOP CONSUMING MARKETS
- UNSATURATED MARKETS
- TOP IMPORTING MARKETS
- MOST PROFITABLE MARKETS
7. PRODUCTION
The Latest Trends and Insights into The Industry
- PRODUCTION VOLUME AND VALUE
8. IMPORTS
The Largest Import Supplying Countries
- IMPORTS FROM 2012–2023
- IMPORTS BY COUNTRY
- IMPORT PRICES BY COUNTRY
9. EXPORTS
The Largest Destinations for Exports
- EXPORTS FROM 2012–2023
- EXPORTS BY COUNTRY
- EXPORT PRICES BY COUNTRY
-
10. PROFILES OF MAJOR PRODUCERS
The Largest Producers on The Market and Their Profiles
This Chapter is Available Only for the Professional Edition PRO -
LIST OF TABLES
- Key Findings In 2023
- Market Volume, In Physical Terms, 2012–2023
- Market Value, 2012–2023
- Per Capita Consumption In 2012-2023
- Imports, In Physical Terms, By Country, 2012–2023
- Imports, In Value Terms, By Country, 2012–2023
- Import Prices, By Country Of Origin, 2012–2023
- Exports, In Physical Terms, By Country, 2012–2023
- Exports, In Value Terms, By Country, 2012–2023
- Export Prices, By Country Of Destination, 2012–2023
-
LIST OF FIGURES
- Market Volume, In Physical Terms, 2012–2023
- Market Value, 2012–2023
- Market Structure – Domestic Supply vs. Imports, In Physical Terms, 2012-2023
- Market Structure – Domestic Supply vs. Imports, In Value Terms, 2012-2023
- Trade Balance, In Physical Terms, 2012-2023
- Trade Balance, In Value Terms, 2012-2023
- Per Capita Consumption, 2012-2023
- Market Volume Forecast to 2030
- Market Value Forecast to 2030
- Products: Market Size And Growth, By Type
- Products: Average Per Capita Consumption, By Type
- Products: Exports And Growth, By Type
- Products: Export Prices And Growth, By Type
- Production Volume And Growth
- Exports And Growth
- Export Prices And Growth
- Market Size And Growth
- Per Capita Consumption
- Imports And Growth
- Import Prices
- Production, In Physical Terms, 2012–2023
- Production, In Value Terms, 2012–2023
- Imports, In Physical Terms, 2012–2023
- Imports, In Value Terms, 2012–2023
- Imports, In Physical Terms, By Country, 2023
- Imports, In Physical Terms, By Country, 2012–2023
- Imports, In Value Terms, By Country, 2012–2023
- Import Prices, By Country Of Origin, 2012–2023
- Exports, In Physical Terms, 2012–2023
- Exports, In Value Terms, 2012–2023
- Exports, In Physical Terms, By Country, 2023
- Exports, In Physical Terms, By Country, 2012–2023
- Exports, In Value Terms, By Country, 2012–2023
- Export Prices, By Country Of Destination, 2012–2023


