U.S. Rubber And Plastic Hoses And Belting Market. Analysis And Forecast to 2030
Get instant access to more than 2 million reports, dashboards, and datasets on the IndexBox Platform.
View PricingU.S. Importation of Hoses and Belts Reaches $4.9 Billion in 2023
U.S. Hose And Belt Imports
In 2023, after two years of growth, there was significant decline in overseas purchases of rubber and plastic hoses and belting, when their volume decreased by -6.3% to 623K tons. Overall, total imports indicated a moderate increase from 2013 to 2023: its volume increased at an average annual rate of +4.6% over the last decade. The trend pattern, however, indicated some noticeable fluctuations being recorded throughout the analyzed period. Based on 2023 figures, imports increased by +36.4% against 2020 indices. The growth pace was the most rapid in 2021 when imports increased by 24% against the previous year. Imports peaked at 665K tons in 2022, and then dropped in the following year.
In value terms, hose and belt imports contracted modestly to $4.9B (IndexBox estimates) in 2023. In general, total imports indicated a notable expansion from 2013 to 2023: its value increased at an average annual rate of +4.7% over the last decade. The trend pattern, however, indicated some noticeable fluctuations being recorded throughout the analyzed period. Based on 2023 figures, imports increased by +54.3% against 2020 indices. The growth pace was the most rapid in 2021 with an increase of 26% against the previous year. Over the period under review, imports reached the maximum at $5B in 2022, and then contracted slightly in the following year.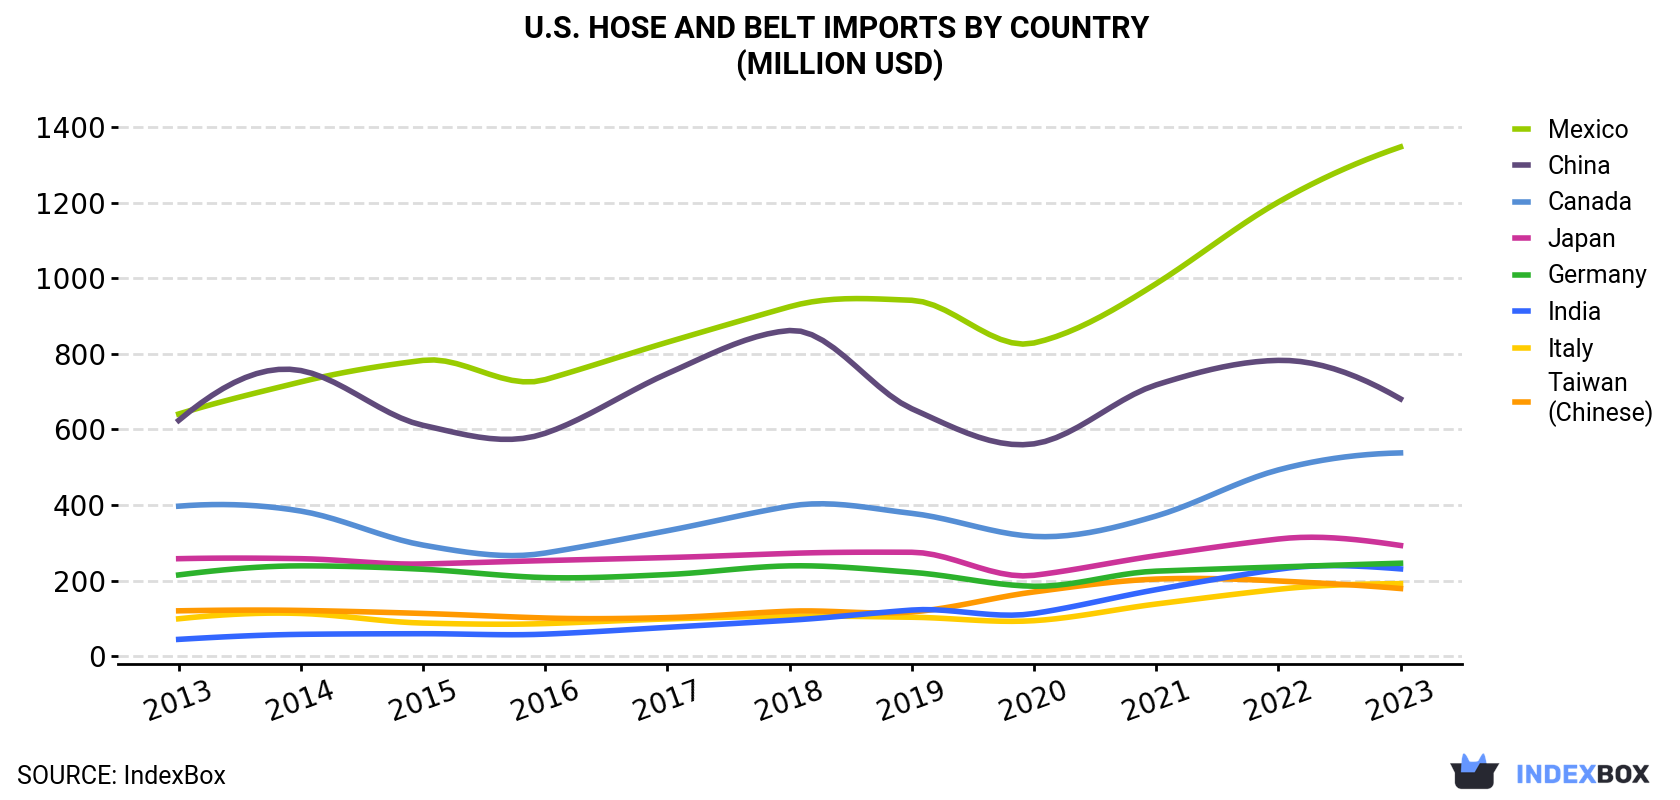
| COUNTRY | Import Value of Hose And Belt in U.S. (million USD) | ||||||||||
|---|---|---|---|---|---|---|---|---|---|---|---|
| 2013 | 2014 | 2015 | 2016 | 2017 | 2018 | 2019 | 2020 | 2021 | 2022 | 2023 | |
| Mexico | 641 | 726 | 783 | 732 | 831 | 925 | 942 | 829 | 986 | 1,202 | 1,348 |
| China | 624 | 756 | 611 | 590 | 748 | 862 | 655 | 562 | 718 | 783 | 681 |
| Canada | 397 | 384 | 294 | 273 | 332 | 397 | 378 | 317 | 371 | 493 | 538 |
| Japan | 258 | 258 | 244 | 253 | 261 | 272 | 275 | 214 | 266 | 310 | 293 |
| Germany | 215 | 239 | 230 | 208 | 216 | 239 | 222 | 185 | 225 | 236 | 246 |
| India | 44.4 | 57.7 | 59.4 | 58.3 | 76.2 | 95.1 | 122 | 113 | 176 | 230 | 231 |
| Italy | 98.9 | 113 | 87.6 | 86.2 | 98.5 | 106 | 103 | 93.9 | 138 | 177 | 192 |
| Taiwan (Chinese) | 120 | 121 | 113 | 101 | 102 | 119 | 117 | 170 | 204 | 199 | 179 |
| Others | 723 | 735 | 760 | 628 | 686 | 788 | 806 | 720 | 949 | 1,323 | 1,237 |
| Total | 3,121 | 3,390 | 3,181 | 2,928 | 3,350 | 3,804 | 3,619 | 3,205 | 4,033 | 4,953 | 4,945 |
Imports by Country
Mexico (167K tons), China (156K tons) and Canada (65K tons) were the main suppliers of hose and belt imports to the United States, together accounting for 62% of total imports. India, Taiwan (Chinese), Italy, Japan and Germany lagged somewhat behind, together accounting for a further 19%.
From 2013 to 2023, the biggest increases were recorded for India (with a CAGR of +18.0%), while purchases for the other leaders experienced more modest paces of growth.
In value terms, Mexico ($1.3B), China ($681M) and Canada ($538M) appeared to be the largest hose and belt suppliers to the United States, together comprising 52% of total imports. Japan, Germany, India, Italy and Taiwan (Chinese) lagged somewhat behind, together comprising a further 23%.
In terms of the main suppliers, India, with a CAGR of +17.9%, saw the highest growth rate of the value of imports, over the period under review, while purchases for the other leaders experienced more modest paces of growth.
Import Prices by Country
In 2023, the hose and belt price amounted to $7,937 per ton (CIF, US), rising by 6.5% against the previous year. Over the period under review, the import price recorded a relatively flat trend pattern. As a result, import price reached the peak level and is likely to continue growth in the immediate term.
Prices varied noticeably by country of origin: amid the top importers, the country with the highest price was Japan ($20,686 per ton), while the price for Vietnam ($3,909 per ton) was amongst the lowest.
From 2013 to 2023, the most notable rate of growth in terms of prices was attained by Thailand (+4.0%), while the prices for the other major suppliers experienced more modest paces of growth.
This report provides an in-depth analysis of the hose and belt market in the U.S.. Within it, you will discover the latest data on market trends and opportunities by country, consumption, production and price developments, as well as the global trade (imports and exports). The forecast exhibits the market prospects through 2030.
Product coverage:
- NAICS 326220 - Rubber and plastics hoses and belting manufacturing
Companies mentioned:
- The Gates Corporation
- Fiskars Brands
- TTI Floor Care North America
- DTR Industries
- J.G.B. Enterprises
- Beltservice Corporation
- Newage Industries
- Hitachi Cable America
- The Flexaust Company
- Titeflex Corporation
- Kongsberg Actuation Systems II
- Fna Group
- Ammeraal Beltech
- Bando Usa
- Flexible Technologies
- Tramec
- Teknor Apex Tennessee Company
- Tedd Smith
- All-American Holdings
- Contitech Thermopol
- Dayco Products
- Continental Plastics Co.
- U.S. Wire & Cable Corporation
- Tigerflex Corporation
- Plastic Specialties and Technologies
- Forbo Siegling
- Fenner U.S. Holdings
- Eaton-Aeroquip
- Aeroquip-Vickers
- HBD Industries
- All-American Hose
Country coverage:
- United States
Data coverage:
- Market volume and value
- Per Capita consumption
- Forecast of the market dynamics in the medium term
- Trade (exports and imports) in the U.S.
- Export and import prices
- Market trends, drivers and restraints
- Key market players and their profiles
Reasons to buy this report:
- Take advantage of the latest data
- Find deeper insights into current market developments
- Discover vital success factors affecting the market
This report is designed for manufacturers, distributors, importers, and wholesalers, as well as for investors, consultants and advisors.
In this report, you can find information that helps you to make informed decisions on the following issues:
- How to diversify your business and benefit from new market opportunities
- How to load your idle production capacity
- How to boost your sales on overseas markets
- How to increase your profit margins
- How to make your supply chain more sustainable
- How to reduce your production and supply chain costs
- How to outsource production to other countries
- How to prepare your business for global expansion
While doing this research, we combine the accumulated expertise of our analysts and the capabilities of artificial intelligence. The AI-based platform, developed by our data scientists, constitutes the key working tool for business analysts, empowering them to discover deep insights and ideas from the marketing data.
-
1. INTRODUCTION
Making Data-Driven Decisions to Grow Your Business
- REPORT DESCRIPTION
- RESEARCH METHODOLOGY AND AI PLATFORM
- DATA-DRIVEN DECISIONS FOR YOUR BUSINESS
- GLOSSARY AND SPECIFIC TERMS
-
2. EXECUTIVE SUMMARY
A Quick Overview of Market Performance
- KEY FINDINGS
- MARKET TRENDS This Chapter is Available Only for the Professional Edition PRO
-
3. MARKET OVERVIEW
Understanding the Current State of The Market and Its Prospects
- MARKET SIZE
- MARKET STRUCTURE
- TRADE BALANCE
- PER CAPITA CONSUMPTION
- MARKET FORECAST TO 2030
-
4. MOST PROMISING PRODUCT
Finding New Products to Diversify Your Business
This Chapter is Available Only for the Professional Edition PRO- TOP PRODUCTS TO DIVERSIFY YOUR BUSINESS
- BEST-SELLING PRODUCTS
- MOST CONSUMED PRODUCT
- MOST TRADED PRODUCT
- MOST PROFITABLE PRODUCT FOR EXPORT
-
5. MOST PROMISING SUPPLYING COUNTRIES
Choosing the Best Countries to Establish Your Sustainable Supply Chain
This Chapter is Available Only for the Professional Edition PRO- TOP COUNTRIES TO SOURCE YOUR PRODUCT
- TOP PRODUCING COUNTRIES
- TOP EXPORTING COUNTRIES
- LOW-COST EXPORTING COUNTRIES
-
6. MOST PROMISING OVERSEAS MARKETS
Choosing the Best Countries to Boost Your Exports
This Chapter is Available Only for the Professional Edition PRO- TOP OVERSEAS MARKETS FOR EXPORTING YOUR PRODUCT
- TOP CONSUMING MARKETS
- UNSATURATED MARKETS
- TOP IMPORTING MARKETS
- MOST PROFITABLE MARKETS
7. PRODUCTION
The Latest Trends and Insights into The Industry
- PRODUCTION VOLUME AND VALUE
8. IMPORTS
The Largest Import Supplying Countries
- IMPORTS FROM 2012–2023
- IMPORTS BY COUNTRY
- IMPORT PRICES BY COUNTRY
9. EXPORTS
The Largest Destinations for Exports
- EXPORTS FROM 2012–2023
- EXPORTS BY COUNTRY
- EXPORT PRICES BY COUNTRY
-
10. PROFILES OF MAJOR PRODUCERS
The Largest Producers on The Market and Their Profiles
This Chapter is Available Only for the Professional Edition PRO -
LIST OF TABLES
- Key Findings In 2023
- Market Volume, In Physical Terms, 2012–2023
- Market Value, 2012–2023
- Per Capita Consumption In 2012-2023
- Imports, In Physical Terms, By Country, 2012–2023
- Imports, In Value Terms, By Country, 2012–2023
- Import Prices, By Country Of Origin, 2012–2023
- Exports, In Physical Terms, By Country, 2012–2023
- Exports, In Value Terms, By Country, 2012–2023
- Export Prices, By Country Of Destination, 2012–2023
-
LIST OF FIGURES
- Market Volume, In Physical Terms, 2012–2023
- Market Value, 2012–2023
- Market Structure – Domestic Supply vs. Imports, In Physical Terms, 2012-2023
- Market Structure – Domestic Supply vs. Imports, In Value Terms, 2012-2023
- Trade Balance, In Physical Terms, 2012-2023
- Trade Balance, In Value Terms, 2012-2023
- Per Capita Consumption, 2012-2023
- Market Volume Forecast to 2030
- Market Value Forecast to 2030
- Products: Market Size And Growth, By Type
- Products: Average Per Capita Consumption, By Type
- Products: Exports And Growth, By Type
- Products: Export Prices And Growth, By Type
- Production Volume And Growth
- Exports And Growth
- Export Prices And Growth
- Market Size And Growth
- Per Capita Consumption
- Imports And Growth
- Import Prices
- Production, In Physical Terms, 2012–2023
- Production, In Value Terms, 2012–2023
- Imports, In Physical Terms, 2012–2023
- Imports, In Value Terms, 2012–2023
- Imports, In Physical Terms, By Country, 2023
- Imports, In Physical Terms, By Country, 2012–2023
- Imports, In Value Terms, By Country, 2012–2023
- Import Prices, By Country Of Origin, 2012–2023
- Exports, In Physical Terms, 2012–2023
- Exports, In Value Terms, 2012–2023
- Exports, In Physical Terms, By Country, 2023
- Exports, In Physical Terms, By Country, 2012–2023
- Exports, In Value Terms, By Country, 2012–2023
- Export Prices, By Country Of Destination, 2012–2023


