Thailand - Canned Food - Market Analysis, Forecast, Size, Trends and Insights
Get instant access to more than 2 million reports, dashboards, and datasets on the IndexBox Platform.
View PricingThailand's Canned Food Export Reaches $344M in September 2023
Thailand Canned Food Exports
In September 2023, the amount of canned food exported from Thailand fell modestly to 110K tons, standing approximately at the previous month's figure. Over the period under review, exports saw a relatively flat trend pattern. The pace of growth was the most pronounced in May 2023 when exports increased by 21% month-to-month. As a result, the exports reached the peak of 118K tons. From June 2023 to September 2023, the growth of the exports remained at a lower figure.
In value terms, canned food exports totaled $344M (IndexBox estimates) in September 2023. In general, exports recorded a relatively flat trend pattern. The growth pace was the most rapid in May 2023 when exports increased by 19% against the previous month.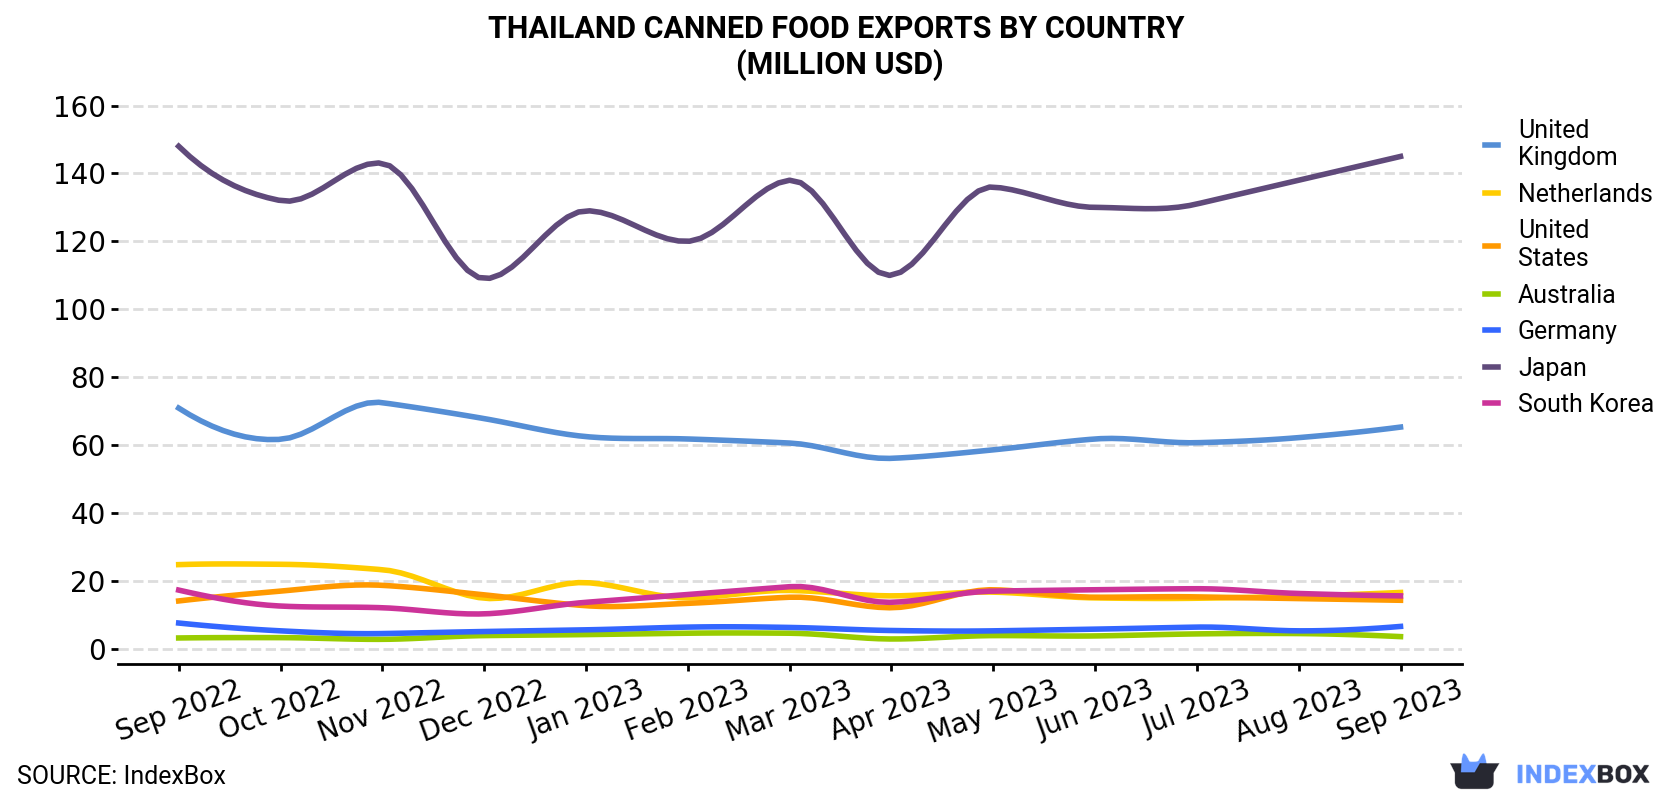
| COUNTRY | Export Value of Canned Food in Thailand (million USD) | ||||||||||||
|---|---|---|---|---|---|---|---|---|---|---|---|---|---|
| Sep 2022 | Oct 2022 | Nov 2022 | Dec 2022 | Jan 2023 | Feb 2023 | Mar 2023 | Apr 2023 | May 2023 | Jun 2023 | Jul 2023 | Aug 2023 | Sep 2023 | |
| Japan | 148 | 132 | 143 | 109 | 129 | 120 | 138 | 110 | 136 | 130 | 131 | 138 | 145 |
| United Kingdom | 70.9 | 61.7 | 72.5 | 67.8 | 62.5 | 61.8 | 60.6 | 56.1 | 58.6 | 61.8 | 60.7 | 62.2 | 65.3 |
| Netherlands | 24.8 | 24.9 | 23.3 | 14.9 | 19.5 | 15.0 | 17.2 | 15.6 | 16.7 | 15.0 | 14.9 | 15.5 | 16.6 |
| South Korea | 17.3 | 12.6 | 12.1 | 10.3 | 13.7 | 16.0 | 18.3 | 13.7 | 17.0 | 17.4 | 17.7 | 16.3 | 15.6 |
| United States | 14.1 | 17.0 | 18.7 | 15.9 | 12.7 | 13.4 | 15.2 | 12.1 | 17.4 | 15.2 | 15.3 | 14.8 | 14.3 |
| Germany | 7.6 | 5.3 | 4.5 | 5.1 | 5.6 | 6.4 | 6.3 | 5.4 | 5.3 | 5.8 | 6.4 | 5.3 | 6.6 |
| Australia | 3.2 | 3.3 | 2.8 | 3.9 | 4.2 | 4.6 | 4.6 | 2.9 | 3.9 | 3.8 | 4.4 | 4.5 | 3.6 |
| Others | 70.6 | 67.9 | 76.7 | 63.8 | 63.2 | 70.2 | 71.7 | 63.0 | 77.9 | 72.5 | 74.9 | 77.6 | 76.4 |
| Total | 356 | 325 | 353 | 291 | 311 | 307 | 332 | 279 | 333 | 322 | 325 | 334 | 344 |
Exports by Country
Japan (33K tons) was the main destination for canned food exports from Thailand, with a 30% share of total exports. Moreover, canned food exports to Japan exceeded the volume sent to the second major destination, the UK (15K tons), twofold. The United States (12K tons) ranked third in terms of total exports with an 11% share.
From September 2022 to September 2023, the average monthly rate of growth in terms of volume to Japan was relatively modest. Exports to the other major destinations recorded the following average monthly rates of exports growth: the UK (-1.0% per month) and the United States (+0.7% per month).
In value terms, Japan ($145M) remains the key foreign market for canned food exports from Thailand, comprising 42% of total exports. The second position in the ranking was held by the UK ($65M), with a 19% share of total exports. It was followed by the Netherlands, with a 4.8% share.
From September 2022 to September 2023, the average monthly rate of growth in terms of value to Japan was relatively modest. Exports to the other major destinations recorded the following average monthly rates of exports growth: the UK (-0.7% per month) and the Netherlands (-3.3% per month).
Export Prices by Country
In September 2023, the canned food price amounted to $3,128 per ton (FOB, Thailand), increasing by 4.2% against the previous month. Over the period under review, the export price showed a relatively flat trend pattern. The growth pace was the most rapid in November 2022 when the average export price increased by 7.5% against the previous month. The export price peaked at $3,352 per ton in January 2023; however, from February 2023 to September 2023, the export prices failed to regain momentum.
There were significant differences in the average prices for the major external markets. In September 2023, the country with the highest price was Japan ($4,359 per ton), while the average price for exports to Russia ($994 per ton) was amongst the lowest.
From September 2022 to September 2023, the most notable rate of growth in terms of prices was recorded for supplies to Canada (+1.8%), while the prices for the other major destinations experienced more modest paces of growth.
This report provides an in-depth analysis of the canned food market in Thailand. Within it, you will discover the latest data on market trends and opportunities by country, consumption, production and price developments, as well as the global trade (imports and exports). The forecast exhibits the market prospects through 2030.
Product coverage:
- Prodcom 10861060 - Homogenised composite food preparations for infant food or dietetic purposes p.r.s. in containers . .250 g
- Prodcom 10861030 - Homogenised vegetables (excluding frozen, preserved by vinegar or acetic acid)
- Prodcom 10861050 - Homogenised preparations of jams, fruit jellies, marmalades, f ruit or nut puree and fruit or nut pastes
- Prodcom 10861060 - Homogenised composite food preparations for infant food or dietetic purposes p.r.s. in containers . .250 g
- Prodcom 10861070 - Food preparations for infants, p.r.s. (excluding homogenised composite food preparations)
- Prodcom 10891100 - Soups and broths and preparations therefor
- Prodcom 10861010 - Homogenised preparations of meat, meat offal or blood (excluding sausages and similar products of meat, food preparations based on these products)
- Prodcom 10131505 - Prepared or preserved goose or duck liver (excluding sausages and prepared meals and dishes)
- Prodcom 10131515 - Prepared or preserved liver of other animals (excluding sausages and prepared meals and dishes)
- Prodcom 10131525 - Prepared or preserved meat or offal of turkeys (excluding sausages, preparations of liver and prepared meals and dishes)
- Prodcom 10131535 - Other prepared or preserved poultry meat (excluding sausages, preparations of liver and prepared meals and dishes)
- Prodcom 10131545 - Prepared or preserved meat of swine: hams and cuts thereof (excluding prepared meals and dishes)
- Prodcom 10131555 - Prepared or preserved meat of swine: shoulders and cuts thereof, of swine (excluding prepared meals and dishes)
- Prodcom 10131565 - Prepared or preserved meat, offal and mixtures of domestic swine, including mixtures, containing < .40 % meat or offal of any kind and fats of any kind (excluding sausages and similar products, homogenised preparations, preparations of liver and prepared meals and dishes)
- Prodcom 10131575 - Other prepared or preserved meat, offal and mixtures of
- Prodcom 10131585 - Prepared or preserved meat or offal of bovine animals (excluding sausages and similar products, homogenised preparations, preparations of liver and prepared meals and dishes)
- Prodcom 10131595 - Other prepared or preserved meat or offal, including blood
- Prodcom 10391710 - Preserved tomatoes, whole or in pieces (excluding prepared vegetable dishes and tomatoes preserved by vinegar or acetic acid)
- Prodcom 10851300 - Prepared meals and dishes based on vegetables
- Prodcom 10391800 - Vegetables (excluding potatoes), fruit, nuts and other edible parts of plants, prepared or preserved by vinegar or acetic acid
- Prodcom 100000Z3 - Vegetables (except potatoes), preserved otherwise than by vinegar or acetic acid, including prepared vegetable dishes
Country coverage:
- Thailand
Data coverage:
- Market volume and value
- Per Capita consumption
- Forecast of the market dynamics in the medium term
- Trade (exports and imports) in Thailand
- Export and import prices
- Market trends, drivers and restraints
- Key market players and their profiles
Reasons to buy this report:
- Take advantage of the latest data
- Find deeper insights into current market developments
- Discover vital success factors affecting the market
This report is designed for manufacturers, distributors, importers, and wholesalers, as well as for investors, consultants and advisors.
In this report, you can find information that helps you to make informed decisions on the following issues:
- How to diversify your business and benefit from new market opportunities
- How to load your idle production capacity
- How to boost your sales on overseas markets
- How to increase your profit margins
- How to make your supply chain more sustainable
- How to reduce your production and supply chain costs
- How to outsource production to other countries
- How to prepare your business for global expansion
While doing this research, we combine the accumulated expertise of our analysts and the capabilities of artificial intelligence. The AI-based platform, developed by our data scientists, constitutes the key working tool for business analysts, empowering them to discover deep insights and ideas from the marketing data.
-
1. INTRODUCTION
Making Data-Driven Decisions to Grow Your Business
- REPORT DESCRIPTION
- RESEARCH METHODOLOGY AND AI PLATFORM
- DATA-DRIVEN DECISIONS FOR YOUR BUSINESS
- GLOSSARY AND SPECIFIC TERMS
-
2. EXECUTIVE SUMMARY
A Quick Overview of Market Performance
- KEY FINDINGS
- MARKET TRENDS This Chapter is Available Only for the Professional Edition PRO
-
3. MARKET OVERVIEW
Understanding the Current State of The Market and Its Prospects
- MARKET SIZE
- MARKET STRUCTURE
- TRADE BALANCE
- PER CAPITA CONSUMPTION
- MARKET FORECAST TO 2030
-
4. MOST PROMISING PRODUCT
Finding New Products to Diversify Your Business
This Chapter is Available Only for the Professional Edition PRO- TOP PRODUCTS TO DIVERSIFY YOUR BUSINESS
- BEST-SELLING PRODUCTS
- MOST CONSUMED PRODUCT
- MOST TRADED PRODUCT
- MOST PROFITABLE PRODUCT FOR EXPORT
-
5. MOST PROMISING SUPPLYING COUNTRIES
Choosing the Best Countries to Establish Your Sustainable Supply Chain
This Chapter is Available Only for the Professional Edition PRO- TOP COUNTRIES TO SOURCE YOUR PRODUCT
- TOP PRODUCING COUNTRIES
- TOP EXPORTING COUNTRIES
- LOW-COST EXPORTING COUNTRIES
-
6. MOST PROMISING OVERSEAS MARKETS
Choosing the Best Countries to Boost Your Exports
This Chapter is Available Only for the Professional Edition PRO- TOP OVERSEAS MARKETS FOR EXPORTING YOUR PRODUCT
- TOP CONSUMING MARKETS
- UNSATURATED MARKETS
- TOP IMPORTING MARKETS
- MOST PROFITABLE MARKETS
7. PRODUCTION
The Latest Trends and Insights into The Industry
- PRODUCTION VOLUME AND VALUE
8. IMPORTS
The Largest Import Supplying Countries
- IMPORTS FROM 2012–2023
- IMPORTS BY COUNTRY
- IMPORT PRICES BY COUNTRY
9. EXPORTS
The Largest Destinations for Exports
- EXPORTS FROM 2012–2023
- EXPORTS BY COUNTRY
- EXPORT PRICES BY COUNTRY
-
10. PROFILES OF MAJOR PRODUCERS
The Largest Producers on The Market and Their Profiles
This Chapter is Available Only for the Professional Edition PRO -
LIST OF TABLES
- Key Findings In 2023
- Market Volume, In Physical Terms, 2012–2023
- Market Value, 2012–2023
- Per Capita Consumption In 2012-2023
- Imports, In Physical Terms, By Country, 2012–2023
- Imports, In Value Terms, By Country, 2012–2023
- Import Prices, By Country Of Origin, 2012–2023
- Exports, In Physical Terms, By Country, 2012–2023
- Exports, In Value Terms, By Country, 2012–2023
- Export Prices, By Country Of Destination, 2012–2023
-
LIST OF FIGURES
- Market Volume, In Physical Terms, 2012–2023
- Market Value, 2012–2023
- Market Structure – Domestic Supply vs. Imports, In Physical Terms, 2012-2023
- Market Structure – Domestic Supply vs. Imports, In Value Terms, 2012-2023
- Trade Balance, In Physical Terms, 2012-2023
- Trade Balance, In Value Terms, 2012-2023
- Per Capita Consumption, 2012-2023
- Market Volume Forecast to 2030
- Market Value Forecast to 2030
- Products: Market Size And Growth, By Type
- Products: Average Per Capita Consumption, By Type
- Products: Exports And Growth, By Type
- Products: Export Prices And Growth, By Type
- Production Volume And Growth
- Exports And Growth
- Export Prices And Growth
- Market Size And Growth
- Per Capita Consumption
- Imports And Growth
- Import Prices
- Production, In Physical Terms, 2012–2023
- Production, In Value Terms, 2012–2023
- Imports, In Physical Terms, 2012–2023
- Imports, In Value Terms, 2012–2023
- Imports, In Physical Terms, By Country, 2023
- Imports, In Physical Terms, By Country, 2012–2023
- Imports, In Value Terms, By Country, 2012–2023
- Import Prices, By Country Of Origin, 2012–2023
- Exports, In Physical Terms, 2012–2023
- Exports, In Value Terms, 2012–2023
- Exports, In Physical Terms, By Country, 2023
- Exports, In Physical Terms, By Country, 2012–2023
- Exports, In Value Terms, By Country, 2012–2023
- Export Prices, By Country Of Destination, 2012–2023


