Nucleic Acids in South Africa Experience 13% Surge, Priced at $24.0 per kg
South Africa Nucleic Acids Import Price in July 2023
In July 2023, the nucleic acids price amounted to $23,959 per ton (CIF, South Africa), picking up by 13% against the previous month. Overall, the import price, however, continues to indicate a abrupt descent. The most prominent rate of growth was recorded in October 2022 an increase of 55% m-o-m. As a result, import price attained the peak level of $46,092 per ton. From November 2022 to July 2023, the average import prices remained at a somewhat lower figure.
There were significant differences in the average prices amongst the major supplying countries. In July 2023, the country with the highest price was India ($189K per ton), while the price for Thailand ($10,712 per ton) was amongst the lowest.
From July 2022 to July 2023, the most notable rate of growth in terms of prices was attained by India (+2.2%), while the prices for the other major suppliers experienced more modest paces of growth.
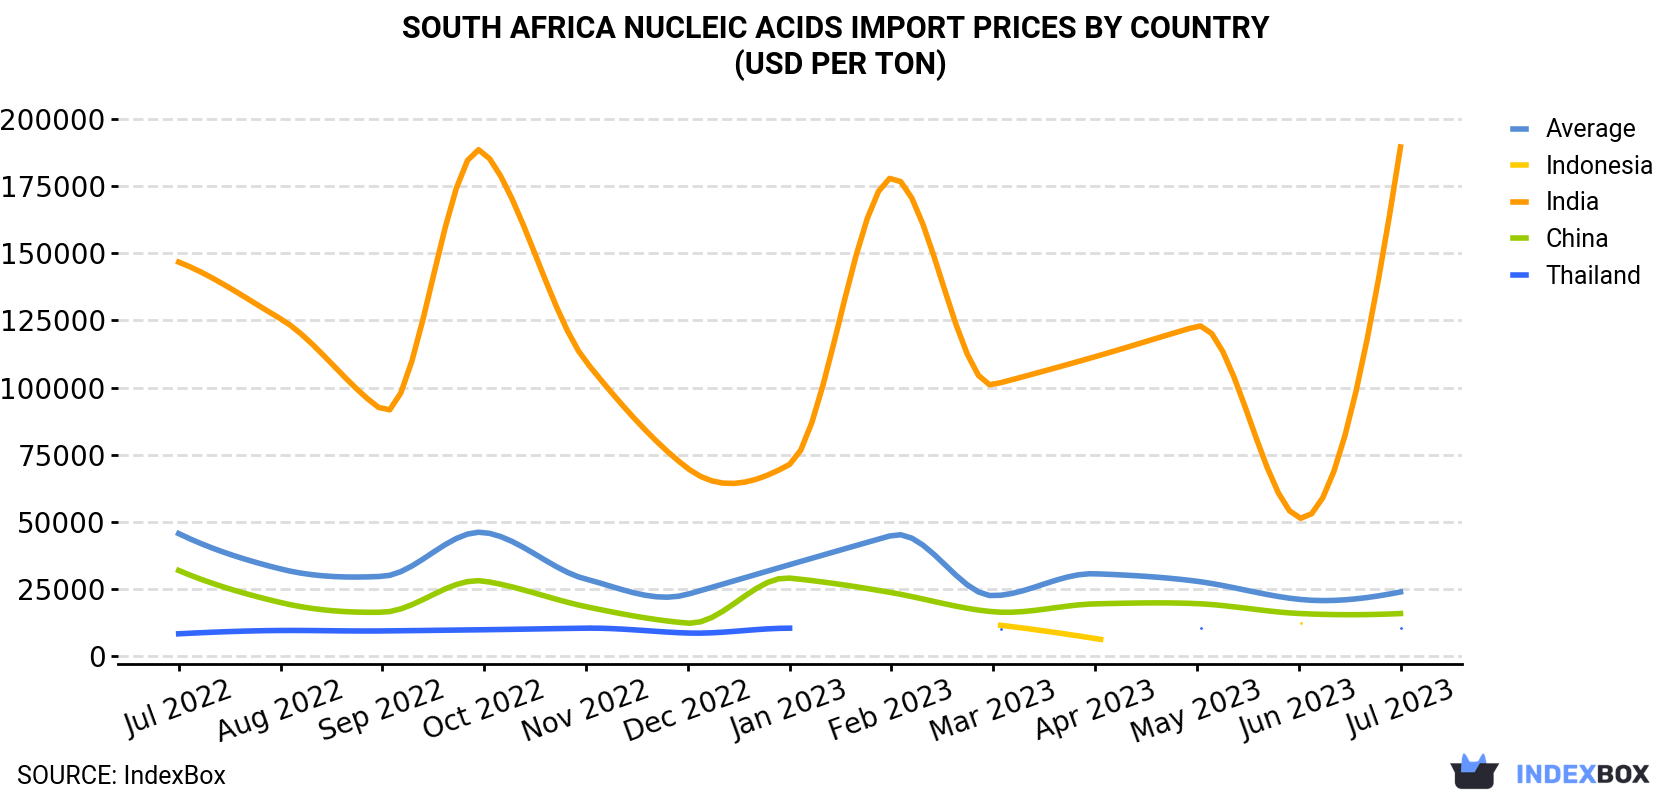
| COUNTRY | Import Price of Nucleic Acids in South Africa (USD per ton) | ||||||||||||
|---|---|---|---|---|---|---|---|---|---|---|---|---|---|
| Jul 2022 | Aug 2022 | Sep 2022 | Oct 2022 | Nov 2022 | Dec 2022 | Jan 2023 | Feb 2023 | Mar 2023 | Apr 2023 | May 2023 | Jun 2023 | Jul 2023 | |
| India | 146,662 | 125,588 | 91,642 | 187,483 | 109,643 | 69,920 | 71,393 | 177,997 | 101,059 | 111,465 | 122,779 | 51,513 | 189,490 |
| China | 31,956 | 20,030 | 16,418 | 27,979 | 18,489 | 12,364 | 29,105 | 23,718 | 16,581 | 19,528 | 19,619 | 15,955 | 15,930 |
| Thailand | 8,394 | 9,623 | 9,457 | 9,905 | 10,487 | 8,674 | 10,485 | N/A | 10,365 | N/A | 10,421 | N/A | 10,712 |
| Indonesia | N/A | N/A | N/A | N/A | 11,318 | N/A | 10,892 | N/A | 11,868 | 6,646 | N/A | 12,544 | N/A |
| Average | 45,669 | 32,523 | 29,758 | 46,092 | 28,714 | 23,110 | 34,100 | 44,958 | 22,552 | 30,732 | 27,934 | 21,224 | 23,959 |
South Africa Nucleic Acids Import Prices by Type
Prices varied noticeably by the product type; the product with the highest price was other heterocyclic compounds, n.e.s. in October 2934, 2934.2 and 2934.3 ($678K per ton), while the price for heterocyclic compounds; containing a benzothiazole ring-system (whether or not hydrogenated), not further fused ($3,790 per ton) was amongst the lowest.
From July 2022 to July 2023, the most notable rate of growth in terms of prices was attained by heterocyclic compounds; containing an unfused thiazole ring (whether or not hydrogenated) in the structure (+14.2%), while the prices for the other products experienced a decline.
South Africa Nucleic Acids Imports
In July 2023, overseas purchases of nucleic acids and their salts decreased by -21.1% to 162 tons for the first time since April 2023, thus ending a two-month rising trend. In general, imports recorded a pronounced descent. The pace of growth appeared the most rapid in March 2023 when imports increased by 70% month-to-month.
In value terms, nucleic acids imports fell to $3.9M (IndexBox estimates) in July 2023. Over the period under review, imports recorded a abrupt contraction. The most prominent rate of growth was recorded in October 2022 with an increase of 31% month-to-month.
South Africa Nucleic Acids Imports by Type
In July 2023, nucleic acids and their salts, other heterocyclic compounds, n.e.c. in heading number 2934 (146 tons) constituted the largest type of nucleic acids supplied to South Africa, with a 90% share of total imports. Moreover, nucleic acids and their salts, other heterocyclic compounds, n.e.c. in heading number 2934 exceeded the figures recorded for the second-largest type, heterocyclic compounds; containing a benzothiazole ring-system (whether or not hydrogenated), not further fused (16 tons), ninefold. Heterocyclic compounds; containing an unfused thiazole ring (whether or not hydrogenated) in the structure (684 kg) ranked third in terms of total imports with a 0.4% share.
From July 2022 to July 2023, the average monthly growth rate of the volume of import of nucleic acids and their salts, other heterocyclic compounds, n.e.c. in heading number 2934 totaled +2.0%. With regard to the other supplied products, the following average monthly rates of growth were recorded: heterocyclic compounds; containing a benzothiazole ring-system (whether or not hydrogenated), not further fused (-6.7% per month) and heterocyclic compounds; containing an unfused thiazole ring (whether or not hydrogenated) in the structure (-30.9% per month).
In value terms, nucleic acids and their salts, other heterocyclic compounds, n.e.c. in heading number 2934 ($3.6M) constituted the largest type of nucleic acids supplied to South Africa, comprising 93% of total imports. The second position in the ranking was taken by heterocyclic compounds; containing an unfused thiazole ring (whether or not hydrogenated) in the structure ($168K), with a 4.3% share of total imports. It was followed by heterocyclic compounds; containing a benzothiazole ring-system (whether or not hydrogenated), not further fused, with a 1.5% share.
South Africa Nucleic Acids Imports by Country
In July 2023, China (119 tons) constituted the largest supplier of nucleic acids to South Africa, with a 74% share of total imports. Moreover, nucleic acids imports from China exceeded the figures recorded by the second-largest supplier, the United States (21 tons), sixfold. Thailand (16 tons) ranked third in terms of total imports with a 9.9% share.
From July 2022 to July 2023, the average monthly rate of growth in terms of volume from China was relatively modest. The remaining supplying countries recorded the following average monthly rates of imports growth: the United States (+29.3% per month) and Thailand (-5.6% per month).
In value terms, China ($1.9M) constituted the largest supplier of nucleic acids to South Africa, comprising 49% of total imports. The second position in the ranking was taken by the United States ($936K), with a 24% share of total imports. It was followed by India, with a 13% share.
From July 2022 to July 2023, the average monthly rate of growth in terms of value from China totaled -6.5%. The remaining supplying countries recorded the following average monthly rates of imports growth: the United States (+12.6% per month) and India (-16.5% per month).
-
1. INTRODUCTION
Making Data-Driven Decisions to Grow Your Business
- REPORT DESCRIPTION
- RESEARCH METHODOLOGY AND AI PLATFORM
- DATA-DRIVEN DECISIONS FOR YOUR BUSINESS
- GLOSSARY AND SPECIFIC TERMS
-
2. EXECUTIVE SUMMARY
A Quick Overview of Market Performance
- KEY FINDINGS
- MARKET TRENDS This Chapter is Available Only for the Professional Edition PRO
-
3. MARKET OVERVIEW
Understanding the Current State of The Market and Its Prospects
- MARKET SIZE
- MARKET STRUCTURE
- TRADE BALANCE
- PER CAPITA CONSUMPTION
- MARKET FORECAST TO 2030
-
4. MOST PROMISING PRODUCT
Finding New Products to Diversify Your Business
This Chapter is Available Only for the Professional Edition PRO- TOP PRODUCTS TO DIVERSIFY YOUR BUSINESS
- BEST-SELLING PRODUCTS
- MOST CONSUMED PRODUCT
- MOST TRADED PRODUCT
- MOST PROFITABLE PRODUCT FOR EXPORT
-
5. MOST PROMISING SUPPLYING COUNTRIES
Choosing the Best Countries to Establish Your Sustainable Supply Chain
This Chapter is Available Only for the Professional Edition PRO- TOP COUNTRIES TO SOURCE YOUR PRODUCT
- TOP PRODUCING COUNTRIES
- TOP EXPORTING COUNTRIES
- LOW-COST EXPORTING COUNTRIES
-
6. MOST PROMISING OVERSEAS MARKETS
Choosing the Best Countries to Boost Your Exports
This Chapter is Available Only for the Professional Edition PRO- TOP OVERSEAS MARKETS FOR EXPORTING YOUR PRODUCT
- TOP CONSUMING MARKETS
- UNSATURATED MARKETS
- TOP IMPORTING MARKETS
- MOST PROFITABLE MARKETS
7. PRODUCTION
The Latest Trends and Insights into The Industry
- PRODUCTION VOLUME AND VALUE
8. IMPORTS
The Largest Import Supplying Countries
- IMPORTS FROM 2012–2023
- IMPORTS BY COUNTRY
- IMPORT PRICES BY COUNTRY
9. EXPORTS
The Largest Destinations for Exports
- EXPORTS FROM 2012–2023
- EXPORTS BY COUNTRY
- EXPORT PRICES BY COUNTRY
-
10. PROFILES OF MAJOR PRODUCERS
The Largest Producers on The Market and Their Profiles
This Chapter is Available Only for the Professional Edition PRO -
LIST OF TABLES
- Key Findings In 2023
- Market Volume, In Physical Terms, 2012–2023
- Market Value, 2012–2023
- Per Capita Consumption In 2012-2023
- Imports, In Physical Terms, By Country, 2012–2023
- Imports, In Value Terms, By Country, 2012–2023
- Import Prices, By Country Of Origin, 2012–2023
- Exports, In Physical Terms, By Country, 2012–2023
- Exports, In Value Terms, By Country, 2012–2023
- Export Prices, By Country Of Destination, 2012–2023
-
LIST OF FIGURES
- Market Volume, In Physical Terms, 2012–2023
- Market Value, 2012–2023
- Market Structure – Domestic Supply vs. Imports, In Physical Terms, 2012-2023
- Market Structure – Domestic Supply vs. Imports, In Value Terms, 2012-2023
- Trade Balance, In Physical Terms, 2012-2023
- Trade Balance, In Value Terms, 2012-2023
- Per Capita Consumption, 2012-2023
- Market Volume Forecast to 2030
- Market Value Forecast to 2030
- Products: Market Size And Growth, By Type
- Products: Average Per Capita Consumption, By Type
- Products: Exports And Growth, By Type
- Products: Export Prices And Growth, By Type
- Production Volume And Growth
- Exports And Growth
- Export Prices And Growth
- Market Size And Growth
- Per Capita Consumption
- Imports And Growth
- Import Prices
- Production, In Physical Terms, 2012–2023
- Production, In Value Terms, 2012–2023
- Imports, In Physical Terms, 2012–2023
- Imports, In Value Terms, 2012–2023
- Imports, In Physical Terms, By Country, 2023
- Imports, In Physical Terms, By Country, 2012–2023
- Imports, In Value Terms, By Country, 2012–2023
- Import Prices, By Country Of Origin, 2012–2023
- Exports, In Physical Terms, 2012–2023
- Exports, In Value Terms, 2012–2023
- Exports, In Physical Terms, By Country, 2023
- Exports, In Physical Terms, By Country, 2012–2023
- Exports, In Value Terms, By Country, 2012–2023
- Export Prices, By Country Of Destination, 2012–2023


