World - Soups And Broths - Market Analysis, Forecast, Size, Trends And Insights
Get instant access to more than 2 million reports, dashboards, and datasets on the IndexBox Platform.
View PricingGlobal Soups and Broths Market to Witness Steady Growth with an Expected CAGR of +2.3% by 2030
IndexBox has just published a new report: World - Soups And Broths - Market Analysis, Forecast, Size, Trends And Insights.
The article highlights the increasing demand for soups and broths worldwide, with the market projected to grow at a CAGR of +2.3% in volume and +4.4% in value terms from 2023 to 2030. Countries like China, the United States, and India lead in consumption, while the United States, Canada, and Mexico are major importers and exporters of these products.
Market Forecast
Driven by increasing demand for soups and broths worldwide, the market is expected to continue an upward consumption trend over the next seven-year period. Market performance is forecast to accelerate, expanding with an anticipated CAGR of +2.3% for the period from 2023 to 2030, which is projected to bring the market volume to 9.7M tons by the end of 2030.
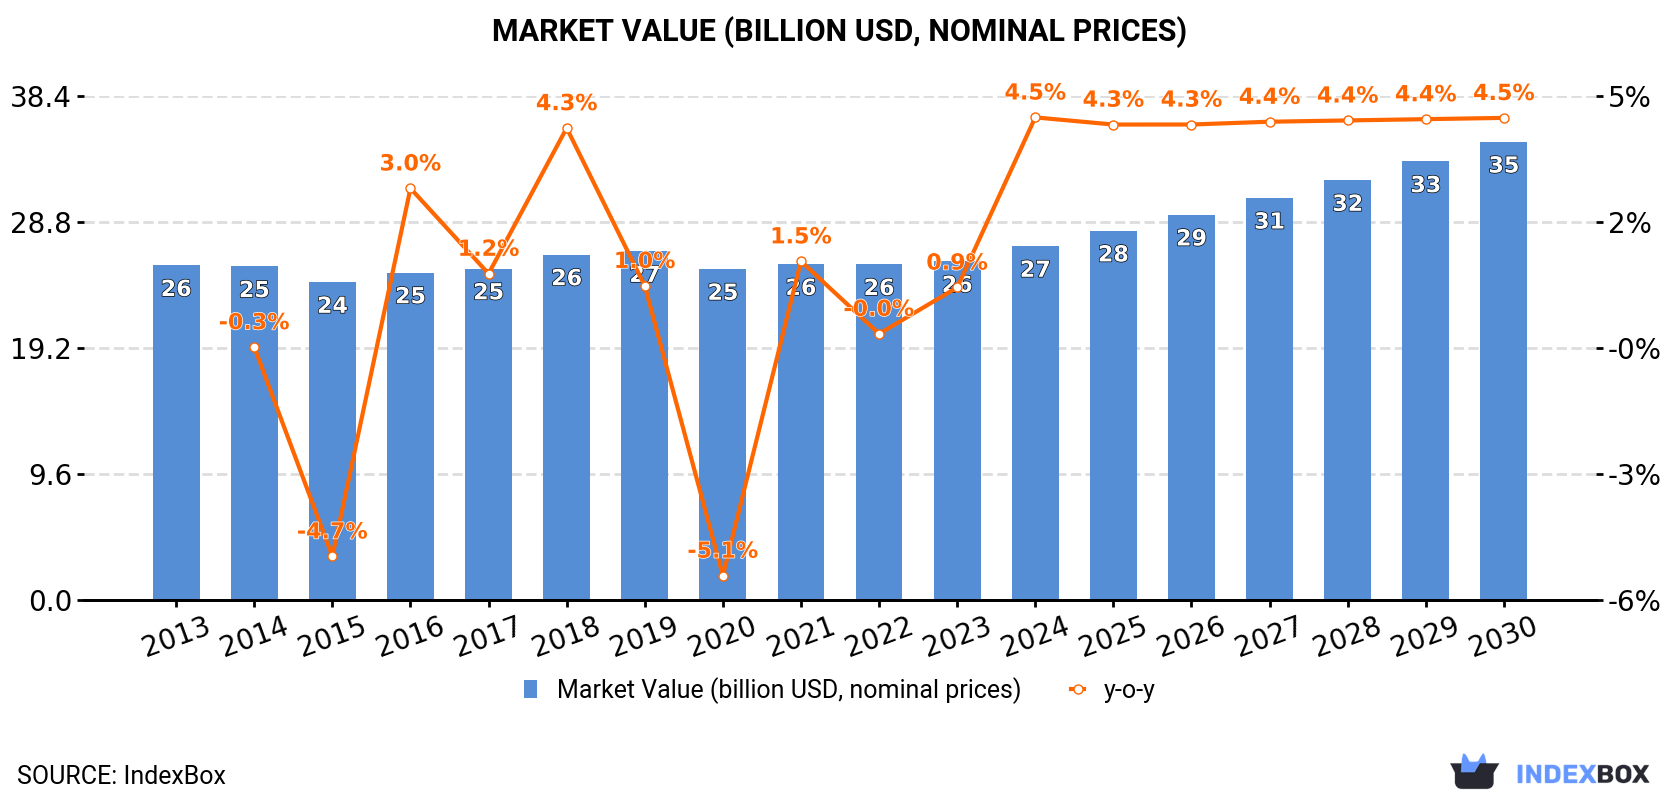
In value terms, the market is forecast to increase with an anticipated CAGR of +4.4% for the period from 2023 to 2030, which is projected to bring the market value to $34.9B (in nominal prices) by the end of 2030.
Consumption
World Consumption of Soups And Broths
In 2023, approx. 8.3M tons of soups and broths were consumed worldwide; leveling off at the previous year's figure. Over the period under review, consumption, however, continues to indicate a relatively flat trend pattern. The pace of growth appeared the most rapid in 2019 with an increase of 5.2% against the previous year. As a result, consumption reached the peak volume of 9M tons. From 2020 to 2023, the growth of the global consumption remained at a somewhat lower figure.
The global soups market value stood at $25.8B in 2023, approximately equating the previous year. This figure reflects the total revenues of producers and importers (excluding logistics costs, retail marketing costs, and retailers' margins, which will be included in the final consumer price). Overall, consumption, however, continues to indicate a relatively flat trend pattern. The most prominent rate of growth was recorded in 2018 when the market value increased by 4.3% against the previous year. Global consumption peaked at $26.6B in 2019; however, from 2020 to 2023, consumption remained at a lower figure.
Consumption By Country
The countries with the highest volumes of consumption in 2023 were China (1.3M tons), the United States (762K tons) and India (526K tons), together comprising 32% of global consumption. The UK, Japan, Pakistan, Spain, Nigeria, Russia, Mexico, Germany, Brazil and Indonesia lagged somewhat behind, together comprising a further 28%.
From 2013 to 2023, the biggest increases were recorded for Pakistan (with a CAGR of +3.9%), while consumption for the other global leaders experienced more modest paces of growth.
In value terms, China ($5.2B) led the market, alone. The second position in the ranking was taken by Japan ($1.8B). It was followed by the United States.
From 2013 to 2023, the average annual growth rate of value in China totaled +3.1%. The remaining consuming countries recorded the following average annual rates of market growth: Japan (-2.6% per year) and the United States (+1.6% per year).
The countries with the highest levels of soups per capita consumption in 2023 were Spain (4.7 kg per person), the UK (4.4 kg per person) and Germany (2.5 kg per person).
From 2013 to 2023, the most notable rate of growth in terms of consumption, amongst the leading consuming countries, was attained by Spain (with a CAGR of +3.4%), while consumption for the other global leaders experienced more modest paces of growth.
Production
World Production of Soups And Broths
In 2023, the amount of soups and broths produced worldwide dropped to 8.3M tons, remaining relatively unchanged against the previous year. In general, production, however, showed a relatively flat trend pattern. The pace of growth appeared the most rapid in 2016 when the production volume increased by 5.3%. Global production peaked at 9M tons in 2019; however, from 2020 to 2023, production stood at a somewhat lower figure.
In value terms, soups production stood at $25.8B in 2023 estimated in export price. Over the period under review, production, however, recorded a relatively flat trend pattern. The most prominent rate of growth was recorded in 2018 with an increase of 6.9%. Global production peaked at $28.2B in 2019; however, from 2020 to 2023, production remained at a lower figure.
Production By Country
The countries with the highest volumes of production in 2023 were China (1.4M tons), the United States (800K tons) and India (529K tons), together comprising 32% of global production. Japan, Spain, the UK, Pakistan, Nigeria, Russia, Brazil, Germany, Indonesia and Bangladesh lagged somewhat behind, together accounting for a further 28%.
From 2013 to 2023, the most notable rate of growth in terms of production, amongst the leading producing countries, was attained by Nigeria (with a CAGR of +7.0%), while production for the other global leaders experienced more modest paces of growth.
Imports
World Imports of Soups And Broths
After two years of decline, overseas purchases of soups and broths increased by 4.1% to 1.2M tons in 2023. The total import volume increased at an average annual rate of +1.3% from 2013 to 2023; the trend pattern remained consistent, with only minor fluctuations in certain years. The pace of growth was the most pronounced in 2020 when imports increased by 9.6% against the previous year. Over the period under review, global imports reached the maximum in 2023 and are likely to continue growth in the immediate term.
In value terms, soups imports skyrocketed to $3.6B in 2023. The total import value increased at an average annual rate of +2.5% from 2013 to 2023; the trend pattern indicated some noticeable fluctuations being recorded throughout the analyzed period. As a result, imports attained the peak and are likely to continue growth in the immediate term.
Imports By Country
In 2023, the United States (252K tons), distantly followed by Canada (135K tons) and Mexico (85K tons) represented the major importers of soups and broths, together comprising 38% of total imports. The Netherlands (54K tons), Germany (51K tons), France (44K tons), Mali (42K tons), Belgium (36K tons), the UK (31K tons), Hong Kong SAR (27K tons), Sweden (22K tons) and Australia (20K tons) followed a long way behind the leaders.
From 2013 to 2023, the biggest increases were recorded for Canada (with a CAGR of +10.0%), while purchases for the other global leaders experienced more modest paces of growth.
In value terms, the United States ($514M), Mexico ($425M) and Canada ($310M) appeared to be the countries with the highest levels of imports in 2023, together accounting for 35% of global imports.
Mexico, with a CAGR of +7.3%, recorded the highest rates of growth with regard to the value of imports, in terms of the main importing countries over the period under review, while purchases for the other global leaders experienced more modest paces of growth.
Import Prices By Country
The average soups import price stood at $2,929 per ton in 2023, with an increase of 11% against the previous year. Over the period from 2013 to 2023, it increased at an average annual rate of +1.2%. As a result, import price reached the peak level and is likely to continue growth in the immediate term.
Prices varied noticeably by country of destination: amid the top importers, the country with the highest price was Mexico ($5,020 per ton), while Mali ($1,853 per ton) was amongst the lowest.
From 2013 to 2023, the most notable rate of growth in terms of prices was attained by Mexico (+6.2%), while the other global leaders experienced more modest paces of growth.
Exports
World Exports of Soups And Broths
In 2023, shipments abroad of soups and broths increased by 0.2% to 1.2M tons for the first time since 2020, thus ending a two-year declining trend. The total export volume increased at an average annual rate of +1.5% over the period from 2013 to 2023; the trend pattern remained consistent, with only minor fluctuations in certain years. The most prominent rate of growth was recorded in 2020 when exports increased by 7.4%. As a result, the exports attained the peak of 1.2M tons; afterwards, it flattened through to 2023.
In value terms, soups exports expanded notably to $3.4B in 2023. The total export value increased at an average annual rate of +2.0% over the period from 2013 to 2023; the trend pattern remained consistent, with somewhat noticeable fluctuations being recorded throughout the analyzed period. As a result, the exports reached the peak and are likely to continue growth in the immediate term.
Exports By Country
In 2023, the United States (289K tons), distantly followed by Canada (155K tons), Senegal (80K tons) and Spain (69K tons) represented the key exporters of soups and broths, together achieving 50% of total exports. The following exporters - Germany (42K tons), South Africa (41K tons), Poland (37K tons), Cote d'Ivoire (34K tons), the Netherlands (32K tons), Guatemala (29K tons), Italy (24K tons), Australia (23K tons) and France (21K tons) - together made up 24% of total exports.
From 2013 to 2023, the biggest increases were recorded for Cote d'Ivoire (with a CAGR of +8.1%), while shipments for the other global leaders experienced more modest paces of growth.
In value terms, the United States ($816M) remains the largest soups supplier worldwide, comprising 24% of global exports. The second position in the ranking was taken by Spain ($197M), with a 5.8% share of global exports. It was followed by Canada, with a 5.7% share.
From 2013 to 2023, the average annual growth rate of value in the United States totaled +6.3%. The remaining exporting countries recorded the following average annual rates of exports growth: Spain (+5.2% per year) and Canada (-0.2% per year).
Export Prices By Country
The average soups export price stood at $2,837 per ton in 2023, surging by 11% against the previous year. In general, the export price saw a relatively flat trend pattern. As a result, the export price attained the peak level and is likely to continue growth in the immediate term.
There were significant differences in the average prices amongst the major exporting countries. In 2023, amid the top suppliers, the country with the highest price was Germany ($4,297 per ton), while Canada ($1,247 per ton) was amongst the lowest.
From 2013 to 2023, the most notable rate of growth in terms of prices was attained by Guatemala (+4.6%), while the other global leaders experienced more modest paces of growth.
This report provides an in-depth analysis of the global soups market. Within it, you will discover the latest data on market trends and opportunities by country, consumption, production and price developments, as well as the global trade (imports and exports). The forecast exhibits the market prospects through 2030.
Product coverage:
- Prodcom 10891100 - Soups and broths and preparations therefor
Country coverage:
Worldwide - the report contains statistical data for 200 countries and includes detailed profiles of the 50 largest consuming countries:
- USA
- China
- Japan
- Germany
- United Kingdom
- France
- Brazil
- Italy
- Russian Federation
- India
- Canada
- Australia
- Republic of Korea
- Spain
- Mexico
- Indonesia
- Netherlands
- Turkey
- Saudi Arabia
- Switzerland
- Sweden
- Nigeria
- Poland
- Belgium
- Argentina
- Norway
- Austria
- Thailand
- United Arab Emirates
- Colombia
- Denmark
- South Africa
- Malaysia
- Israel
- Singapore
- Egypt
- Philippines
- Finland
- Chile
- Ireland
- Pakistan
- Greece
- Portugal
- Kazakhstan
- Algeria
- Czech Republic
- Qatar
- Peru
- Romania
- Vietnam
+ the largest producing countries
Data coverage:
- Global market volume and value
- Per Capita consumption
- Forecast of the market dynamics in the medium term
- Global production, split by region and country
- Global trade (exports and imports)
- Export and import prices
- Market trends, drivers and restraints
- Key market players and their profiles
Company coverage:
Reasons to buy this report:
- Take advantage of the latest data
- Find deeper insights into current market developments
- Discover vital success factors affecting the market
This report is designed for manufacturers, distributors, importers, and wholesalers, as well as for investors, consultants and advisors.
In this report, you can find information that helps you to make informed decisions on the following issues:
- How to diversify your business and benefit from new market opportunities
- How to load your idle production capacity
- How to boost your sales on overseas markets
- How to increase your profit margins
- How to make your supply chain more sustainable
- How to reduce your production and supply chain costs
- How to outsource production to other countries
- How to prepare your business for global expansion
While doing this research, we combine the accumulated expertise of our analysts and the capabilities of artificial intelligence. The AI-based platform, developed by our data scientists, constitutes the key working tool for business analysts, empowering them to discover deep insights and ideas from the marketing data.
-
1. INTRODUCTION
Making Data-Driven Decisions to Grow Your Business
- REPORT DESCRIPTION
- RESEARCH METHODOLOGY AND AI PLATFORM
- DATA-DRIVEN DECISIONS FOR YOUR BUSINESS
- GLOSSARY AND SPECIFIC TERMS
-
2. EXECUTIVE SUMMARY
A Quick Overview of Market Performance
- KEY FINDINGS
- MARKET TRENDS This Chapter is Available Only for the Professional Edition PRO
-
3. MARKET OVERVIEW
Understanding the Current State of The Market and Its Prospects
- MARKET SIZE
- CONSUMPTION BY COUNTRY
- MARKET FORECAST TO 2030
-
4. MOST PROMISING PRODUCT
Finding New Products to Diversify Your Business
This Chapter is Available Only for the Professional Edition PRO- TOP PRODUCTS TO DIVERSIFY YOUR BUSINESS
- BEST-SELLING PRODUCTS
- MOST CONSUMED PRODUCT
- MOST TRADED PRODUCT
- MOST PROFITABLE PRODUCT FOR EXPORT
-
5. MOST PROMISING SUPPLYING COUNTRIES
Choosing the Best Countries to Establish Your Sustainable Supply Chain
This Chapter is Available Only for the Professional Edition PRO- TOP COUNTRIES TO SOURCE YOUR PRODUCT
- TOP PRODUCING COUNTRIES
- TOP EXPORTING COUNTRIES
- LOW-COST EXPORTING COUNTRIES
-
6. MOST PROMISING OVERSEAS MARKETS
Choosing the Best Countries to Boost Your Exports
This Chapter is Available Only for the Professional Edition PRO- TOP OVERSEAS MARKETS FOR EXPORTING YOUR PRODUCT
- TOP CONSUMING MARKETS
- UNSATURATED MARKETS
- TOP IMPORTING MARKETS
- MOST PROFITABLE MARKETS
7. GLOBAL PRODUCTION
The Latest Trends and Insights into The Industry
- PRODUCTION VOLUME AND VALUE
- PRODUCTION BY COUNTRY
8. GLOBAL IMPORTS
The Largest Importers on The Market and How They Succeed
- IMPORTS FROM 2012–2023
- IMPORTS BY COUNTRY
- IMPORT PRICES BY COUNTRY
9. GLOBAL EXPORTS
The Largest Exporters on The Market and How They Succeed
- EXPORTS FROM 2012–2023
- EXPORTS BY COUNTRY
- EXPORT PRICES BY COUNTRY
-
10. PROFILES OF MAJOR PRODUCERS
The Largest Producers on The Market and Their Profiles
This Chapter is Available Only for the Professional Edition PRO -
11. COUNTRY PROFILES
The Largest Markets And Their Profiles
This Chapter is Available Only for the Professional Edition PRO- United States
- China
- Japan
- Germany
- United Kingdom
- France
- Brazil
- Italy
- Russian Federation
- India
- Canada
- Australia
- Republic of Korea
- Spain
- Mexico
- Indonesia
- Netherlands
- Turkey
- Saudi Arabia
- Switzerland
- Sweden
- Nigeria
- Poland
- Belgium
- Argentina
- Norway
- Austria
- Thailand
- United Arab Emirates
- Colombia
- Denmark
- South Africa
- Malaysia
- Israel
- Singapore
- Egypt
- Philippines
- Finland
- Chile
- Ireland
- Pakistan
- Greece
- Portugal
- Kazakhstan
- Algeria
- Czech Republic
- Qatar
- Peru
- Romania
- Vietnam
-
LIST OF TABLES
- Key Findings In 2023
- Market Volume, In Physical Terms, 2012–2023
- Market Value, 2012–2023
- Per Capita Consumption, By Country, 2018–2023
- Production, In Physical Terms, By Country, 2012–2023
- Imports, In Physical Terms, By Country, 2012–2023
- Imports, In Value Terms, By Country, 2012–2023
- Import Prices, By Country Of Destination, 2012–2023
- Exports, In Physical Terms, By Country, 2012–2023
- Exports, In Value Terms, By Country, 2012–2023
- Export Prices, By Country Of Origin, 2012–2023
-
LIST OF FIGURES
- Market Volume, In Physical Terms, 2012–2023
- Market Value, 2012–2023
- Consumption, By Country, 2023
- Market Volume Forecast to 2030
- Market Value Forecast to 2030
- Products: Market Size And Growth, By Type
- Products: Average Per Capita Consumption, By Type
- Products: Exports And Growth, By Type
- Products: Export Prices And Growth, By Type
- Production Volume And Growth
- Exports And Growth
- Export Prices And Growth
- Market Size And Growth
- Per Capita Consumption
- Imports And Growth
- Import Prices
- Production, In Physical Terms, 2012–2023
- Production, In Value Terms, 2012–2023
- Production, By Country, 2023
- Production, In Physical Terms, By Country, 2012–2023
- Imports, In Physical Terms, 2012–2023
- Imports, In Value Terms, 2012–2023
- Imports, In Physical Terms, By Country, 2023
- Imports, In Physical Terms, By Country, 2012–2023
- Imports, In Value Terms, By Country, 2012–2023
- Import Prices, By Country, 2012–2023
- Exports, In Physical Terms, 2012–2023
- Exports, In Value Terms, 2012–2023
- Exports, In Physical Terms, By Country, 2023
- Exports, In Physical Terms, By Country, 2012–2023
- Exports, In Value Terms, By Country, 2012–2023
- Export Prices, 2012–2023


