
Qatar - Angles, Shapes And Sections Of Stainless Steel Or Other Alloy Steel - Market Analysis, Forecast, Size, Trends and Insights
Get instant access to more than 2 million reports, dashboards, and datasets on the IndexBox Platform.
View PricingQatar Sees Significant Reduction in Imports of Stainless Steel Angles, Dropping to $208K in October 2023
Qatar Stainless Steel Angle Imports
In October 2023, approximately 31 tons of angles, shapes and sections of stainless steel or other alloy steel were imported into Qatar; waning by -71.6% compared with the previous month's figure. Over the period under review, imports faced a sharp downturn. The pace of growth was the most pronounced in March 2023 with an increase of 221% month-to-month.
In value terms, stainless steel angle imports shrank significantly to $208K (IndexBox estimates) in October 2023. In general, imports saw a abrupt descent. The pace of growth appeared the most rapid in March 2023 with an increase of 234% against the previous month.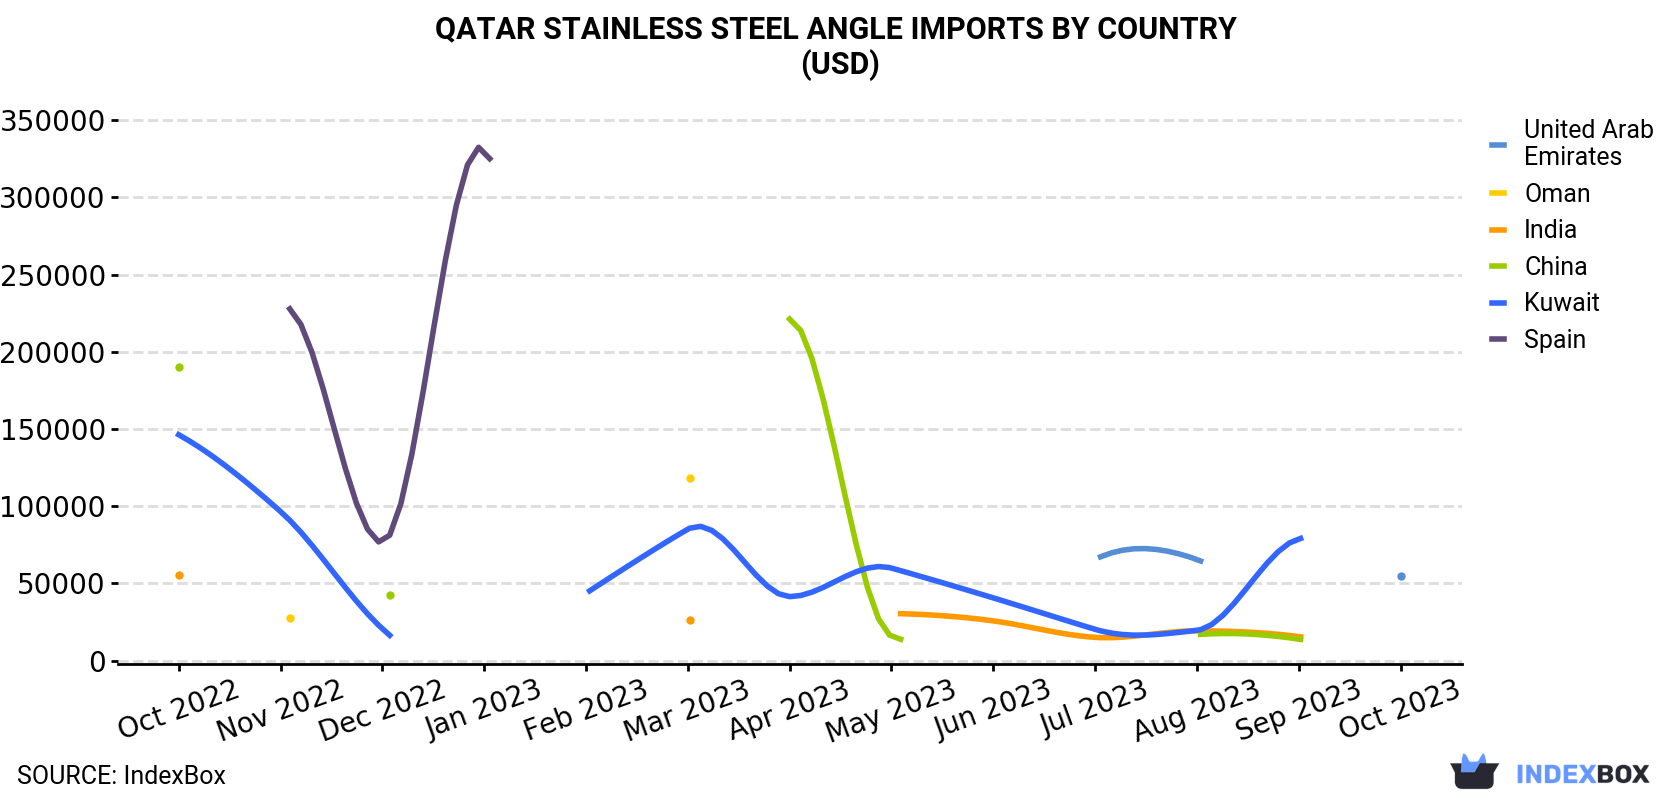
| COUNTRY | Import Value of Stainless Steel Angle in Qatar (USD) | ||||||||||||
|---|---|---|---|---|---|---|---|---|---|---|---|---|---|
| Oct 2022 | Nov 2022 | Dec 2022 | Jan 2023 | Feb 2023 | Mar 2023 | Apr 2023 | May 2023 | Jun 2023 | Jul 2023 | Aug 2023 | Sep 2023 | Oct 2023 | |
| United Arab Emirates | N/A | N/A | N/A | N/A | N/A | N/A | N/A | N/A | N/A | 65,584 | 65,547 | N/A | 54,795 |
| Oman | N/A | 27,813 | N/A | N/A | N/A | 118,086 | N/A | N/A | N/A | N/A | N/A | N/A | N/A |
| India | 55,522 | N/A | N/A | N/A | N/A | 26,344 | N/A | 30,584 | 25,765 | 15,071 | 19,315 | 15,573 | N/A |
| China | 190,105 | N/A | 42,314 | N/A | N/A | N/A | 221,187 | 15,939 | N/A | N/A | 16,845 | 13,945 | N/A |
| Kuwait | 146,322 | 96,621 | 20,681 | N/A | 43,657 | 85,147 | 41,445 | 59,971 | 40,654 | 20,281 | 19,587 | 78,853 | N/A |
| Spain | N/A | 228,048 | 76,550 | 331,279 | N/A | N/A | N/A | N/A | N/A | N/A | N/A | N/A | N/A |
| Others | N/A | N/A | N/A | N/A | 25,087 | N/A | 24,905 | 36,131 | 1.0 | 23,303 | N/A | 153,078 | 152,755 |
| Total | 391,949 | 352,482 | 139,545 | 331,279 | 68,744 | 229,577 | 287,537 | 142,625 | 66,420 | 124,239 | 121,294 | 261,449 | 207,550 |
Imports by Country
In October 2023, the United Arab Emirates (31 tons) was the main supplier of stainless steel angle to Qatar, with a approximately 99% share of total imports.
From October 2022 to October 2023, the average monthly growth rate of volume from the United Arab Emirates totaled -9.3%.
In value terms, the United Arab Emirates ($55K) constituted the largest supplier of stainless steel angle to Qatar.
From October 2022 to October 2023, the average monthly growth rate of value from the United Arab Emirates stood at -5.8%.
Imports by Type
In October 2023, steel, alloy; angles, shapes and sections (31 tons) was the main type of stainless steel angle supplied to Qatar, accounting for a 99% share of total imports. It was followed by steel, stainless (397 kg), with a 1.3% share of total imports.
From October 2022 to October 2023, the average monthly growth rate of the volume of import of steel, alloy; angles, shapes and sections stood at -20.2%.
In value terms, steel, stainless ($153K) constituted the largest type of stainless steel angle supplied to Qatar, comprising 74% of total imports. The second position in the ranking was taken by steel, alloy; angles, shapes and sections ($55K), with a 26% share of total imports.
Import Prices by Country
In October 2023, the stainless steel angle price amounted to $6,663 per ton (CIF, Qatar), rising by 179% against the previous month. Overall, the import price enjoyed a resilient increase. As a result, import price reached the peak level and is likely to continue growth in the immediate term.
As there is only one major supplying country, the average price level is determined by prices for the United Arab Emirates.
From October 2022 to October 2023, the rate of growth in terms of prices for China amounted to +33.2% per month.
This report provides an in-depth analysis of the stainless steel angle market in Qatar. Within it, you will discover the latest data on market trends and opportunities by country, consumption, production and price developments, as well as the global trade (imports and exports). The forecast exhibits the market prospects through 2030.
Product coverage:
- Prodcom 24107200 - Open sections, not further worked than hot-rolled, hot-drawn or extruded, of stainless steel
- Prodcom 24107300 - Open sections, not further worked than hot-rolled, hot-drawn or extruded, of other alloy steel
- Prodcom 24312050 - Sections, of alloy steel other than stainless, cold-finished or cold-formed (e.g. by cold-drawing)
- Prodcom 24331200 - Cold-formed sections, obtained from flat products, of stainless steel
Country coverage:
- Qatar
Data coverage:
- Market volume and value
- Per Capita consumption
- Forecast of the market dynamics in the medium term
- Trade (exports and imports) in Qatar
- Export and import prices
- Market trends, drivers and restraints
- Key market players and their profiles
Reasons to buy this report:
- Take advantage of the latest data
- Find deeper insights into current market developments
- Discover vital success factors affecting the market
This report is designed for manufacturers, distributors, importers, and wholesalers, as well as for investors, consultants and advisors.
In this report, you can find information that helps you to make informed decisions on the following issues:
- How to diversify your business and benefit from new market opportunities
- How to load your idle production capacity
- How to boost your sales on overseas markets
- How to increase your profit margins
- How to make your supply chain more sustainable
- How to reduce your production and supply chain costs
- How to outsource production to other countries
- How to prepare your business for global expansion
While doing this research, we combine the accumulated expertise of our analysts and the capabilities of artificial intelligence. The AI-based platform, developed by our data scientists, constitutes the key working tool for business analysts, empowering them to discover deep insights and ideas from the marketing data.
-
1. INTRODUCTION
Making Data-Driven Decisions to Grow Your Business
- REPORT DESCRIPTION
- RESEARCH METHODOLOGY AND AI PLATFORM
- DATA-DRIVEN DECISIONS FOR YOUR BUSINESS
- GLOSSARY AND SPECIFIC TERMS
-
2. EXECUTIVE SUMMARY
A Quick Overview of Market Performance
- KEY FINDINGS
- MARKET TRENDS This Chapter is Available Only for the Professional Edition PRO
-
3. MARKET OVERVIEW
Understanding the Current State of The Market and Its Prospects
- MARKET SIZE
- MARKET STRUCTURE
- TRADE BALANCE
- PER CAPITA CONSUMPTION
- MARKET FORECAST TO 2030
-
4. MOST PROMISING PRODUCT
Finding New Products to Diversify Your Business
This Chapter is Available Only for the Professional Edition PRO- TOP PRODUCTS TO DIVERSIFY YOUR BUSINESS
- BEST-SELLING PRODUCTS
- MOST CONSUMED PRODUCT
- MOST TRADED PRODUCT
- MOST PROFITABLE PRODUCT FOR EXPORT
-
5. MOST PROMISING SUPPLYING COUNTRIES
Choosing the Best Countries to Establish Your Sustainable Supply Chain
This Chapter is Available Only for the Professional Edition PRO- TOP COUNTRIES TO SOURCE YOUR PRODUCT
- TOP PRODUCING COUNTRIES
- TOP EXPORTING COUNTRIES
- LOW-COST EXPORTING COUNTRIES
-
6. MOST PROMISING OVERSEAS MARKETS
Choosing the Best Countries to Boost Your Exports
This Chapter is Available Only for the Professional Edition PRO- TOP OVERSEAS MARKETS FOR EXPORTING YOUR PRODUCT
- TOP CONSUMING MARKETS
- UNSATURATED MARKETS
- TOP IMPORTING MARKETS
- MOST PROFITABLE MARKETS
7. PRODUCTION
The Latest Trends and Insights into The Industry
- PRODUCTION VOLUME AND VALUE
8. IMPORTS
The Largest Import Supplying Countries
- IMPORTS FROM 2012–2023
- IMPORTS BY COUNTRY
- IMPORT PRICES BY COUNTRY
9. EXPORTS
The Largest Destinations for Exports
- EXPORTS FROM 2012–2023
- EXPORTS BY COUNTRY
- EXPORT PRICES BY COUNTRY
-
10. PROFILES OF MAJOR PRODUCERS
The Largest Producers on The Market and Their Profiles
This Chapter is Available Only for the Professional Edition PRO -
LIST OF TABLES
- Key Findings In 2023
- Market Volume, In Physical Terms, 2012–2023
- Market Value, 2012–2023
- Per Capita Consumption In 2012-2023
- Imports, In Physical Terms, By Country, 2012–2023
- Imports, In Value Terms, By Country, 2012–2023
- Import Prices, By Country Of Origin, 2012–2023
- Exports, In Physical Terms, By Country, 2012–2023
- Exports, In Value Terms, By Country, 2012–2023
- Export Prices, By Country Of Destination, 2012–2023
-
LIST OF FIGURES
- Market Volume, In Physical Terms, 2012–2023
- Market Value, 2012–2023
- Market Structure – Domestic Supply vs. Imports, In Physical Terms, 2012-2023
- Market Structure – Domestic Supply vs. Imports, In Value Terms, 2012-2023
- Trade Balance, In Physical Terms, 2012-2023
- Trade Balance, In Value Terms, 2012-2023
- Per Capita Consumption, 2012-2023
- Market Volume Forecast to 2030
- Market Value Forecast to 2030
- Products: Market Size And Growth, By Type
- Products: Average Per Capita Consumption, By Type
- Products: Exports And Growth, By Type
- Products: Export Prices And Growth, By Type
- Production Volume And Growth
- Exports And Growth
- Export Prices And Growth
- Market Size And Growth
- Per Capita Consumption
- Imports And Growth
- Import Prices
- Production, In Physical Terms, 2012–2023
- Production, In Value Terms, 2012–2023
- Imports, In Physical Terms, 2012–2023
- Imports, In Value Terms, 2012–2023
- Imports, In Physical Terms, By Country, 2023
- Imports, In Physical Terms, By Country, 2012–2023
- Imports, In Value Terms, By Country, 2012–2023
- Import Prices, By Country Of Origin, 2012–2023
- Exports, In Physical Terms, 2012–2023
- Exports, In Value Terms, 2012–2023
- Exports, In Physical Terms, By Country, 2023
- Exports, In Physical Terms, By Country, 2012–2023
- Exports, In Value Terms, By Country, 2012–2023
- Export Prices, By Country Of Destination, 2012–2023


