
Australia - Angles, Shapes And Sections Of Stainless Steel Or Other Alloy Steel - Market Analysis, Forecast, Size, Trends and Insights
Get instant access to more than 2 million reports, dashboards, and datasets on the IndexBox Platform.
View PricingAustralia's July 2023 Imports of Stainless Steel Angles Surge by 108% to Reach $1.2M
Australia Stainless Steel Angle Imports
Stainless steel angle imports into Australia soared to 370 tons in July 2023, increasing by 50% compared with June 2023. Over the period under review, imports, however, recorded a mild contraction. The growth pace was the most rapid in April 2023 when imports increased by 227% m-o-m.
In value terms, stainless steel angle imports soared to $1.2M (IndexBox estimates) in July 2023. Overall, imports, however, recorded a mild descent.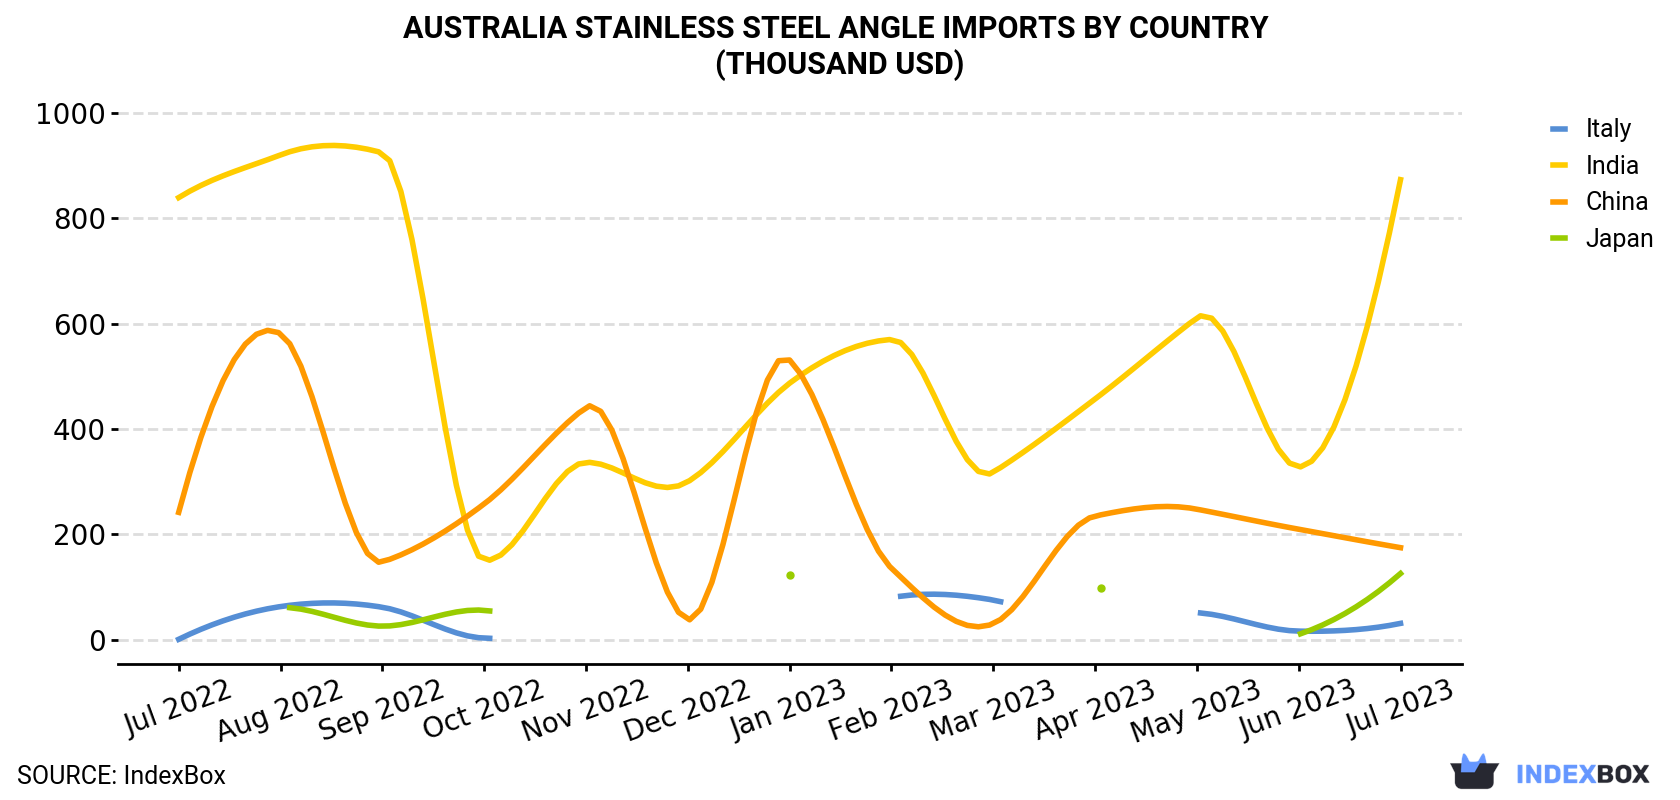
| COUNTRY | Import Value of Stainless Steel Angle in Australia (thousand USD) | ||||||||||||
|---|---|---|---|---|---|---|---|---|---|---|---|---|---|
| Jul 2022 | Aug 2022 | Sep 2022 | Oct 2022 | Nov 2022 | Dec 2022 | Jan 2023 | Feb 2023 | Mar 2023 | Apr 2023 | May 2023 | Jun 2023 | Jul 2023 | |
| India | 839 | 920 | 924 | 151 | 337 | 300 | 487 | 570 | 318 | 457 | 611 | 328 | 873 |
| China | 242 | 581 | 148 | 258 | 441 | 38.5 | 531 | 136 | 30.8 | 235 | 248 | 210 | 175 |
| Japan | N/A | 61.7 | 26.1 | 56.2 | N/A | N/A | 124 | N/A | N/A | 99.0 | N/A | 10.5 | 126 |
| Italy | 1.2 | 63.3 | 62.0 | 3.5 | N/A | N/A | N/A | 80.1 | 75.7 | N/A | 51.6 | 16.7 | 31.4 |
| Others | 299 | 1,019 | 113 | 666 | 871 | 728 | 373 | 169 | 54.0 | 21.0 | 48.6 | 26.4 | 23.1 |
| Total | 1,381 | 2,645 | 1,272 | 1,134 | 1,648 | 1,066 | 1,515 | 956 | 479 | 812 | 959 | 591 | 1,229 |
Imports by Country
India (214 tons), China (130 tons) and Japan (19 tons) were the main suppliers of stainless steel angle imports to Australia, together comprising 98% of total imports. These countries were followed by Italy, which accounted for a further 1.5%.
From July 2022 to July 2023, the biggest increases were in Italy (with a CAGR of +39.6%), while purchases for the other leaders experienced more modest paces of growth.
In value terms, India ($873K) constituted the largest supplier of stainless steel angle to Australia, comprising 71% of total imports. The second position in the ranking was held by China ($175K), with a 14% share of total imports. It was followed by Japan, with a 10% share.
From July 2022 to July 2023, the average monthly rate of growth in terms of value from India was relatively modest. The remaining supplying countries recorded the following average monthly rates of imports growth: China (-2.6% per month) and Japan (+6.7% per month).
Imports by Type
Steel, stainless (242 tons) and steel, alloy; angles, shapes and sections (128 tons) were the main products of stainless steel angle imports to Australia.
From July 2022 to July 2023, the biggest increases were in steel, stainless; angles, shapes and sections (with a CAGR of +2.9%).
In value terms, steel, stainless ($1.1M) constituted the largest type of stainless steel angle supplied to Australia, comprising 87% of total imports. The second position in the ranking was taken by steel, alloy; angles, shapes and sections ($158K), with a 13% share of total imports.
Import Prices by Country
In July 2023, the stainless steel angle price stood at $3,323 per ton (CIF, Australia), picking up by 39% against the previous month. In general, the import price saw a relatively flat trend pattern. The pace of growth appeared the most rapid in March 2023 when the average import price increased by 80% against the previous month. As a result, import price reached the peak level of $5,010 per ton. From April 2023 to July 2023, the average import prices remained at a somewhat lower figure.
Prices varied noticeably by the country of origin: the country with the highest price was Japan ($6,627 per ton), while the price for China ($1,347 per ton) was amongst the lowest.
From July 2022 to July 2023, the most notable rate of growth in terms of prices was attained by Japan (+0.1%), while the prices for the other major suppliers experienced a decline.
This report provides an in-depth analysis of the stainless steel angle market in Australia. Within it, you will discover the latest data on market trends and opportunities by country, consumption, production and price developments, as well as the global trade (imports and exports). The forecast exhibits the market prospects through 2030.
Product coverage:
- Prodcom 24107200 - Open sections, not further worked than hot-rolled, hot-drawn or extruded, of stainless steel
- Prodcom 24107300 - Open sections, not further worked than hot-rolled, hot-drawn or extruded, of other alloy steel
- Prodcom 24312050 - Sections, of alloy steel other than stainless, cold-finished or cold-formed (e.g. by cold-drawing)
- Prodcom 24331200 - Cold-formed sections, obtained from flat products, of stainless steel
Country coverage:
- Australia
Data coverage:
- Market volume and value
- Per Capita consumption
- Forecast of the market dynamics in the medium term
- Trade (exports and imports) in Australia
- Export and import prices
- Market trends, drivers and restraints
- Key market players and their profiles
Reasons to buy this report:
- Take advantage of the latest data
- Find deeper insights into current market developments
- Discover vital success factors affecting the market
This report is designed for manufacturers, distributors, importers, and wholesalers, as well as for investors, consultants and advisors.
In this report, you can find information that helps you to make informed decisions on the following issues:
- How to diversify your business and benefit from new market opportunities
- How to load your idle production capacity
- How to boost your sales on overseas markets
- How to increase your profit margins
- How to make your supply chain more sustainable
- How to reduce your production and supply chain costs
- How to outsource production to other countries
- How to prepare your business for global expansion
While doing this research, we combine the accumulated expertise of our analysts and the capabilities of artificial intelligence. The AI-based platform, developed by our data scientists, constitutes the key working tool for business analysts, empowering them to discover deep insights and ideas from the marketing data.
-
1. INTRODUCTION
Making Data-Driven Decisions to Grow Your Business
- REPORT DESCRIPTION
- RESEARCH METHODOLOGY AND AI PLATFORM
- DATA-DRIVEN DECISIONS FOR YOUR BUSINESS
- GLOSSARY AND SPECIFIC TERMS
-
2. EXECUTIVE SUMMARY
A Quick Overview of Market Performance
- KEY FINDINGS
- MARKET TRENDS This Chapter is Available Only for the Professional Edition PRO
-
3. MARKET OVERVIEW
Understanding the Current State of The Market and Its Prospects
- MARKET SIZE
- MARKET STRUCTURE
- TRADE BALANCE
- PER CAPITA CONSUMPTION
- MARKET FORECAST TO 2030
-
4. MOST PROMISING PRODUCT
Finding New Products to Diversify Your Business
This Chapter is Available Only for the Professional Edition PRO- TOP PRODUCTS TO DIVERSIFY YOUR BUSINESS
- BEST-SELLING PRODUCTS
- MOST CONSUMED PRODUCT
- MOST TRADED PRODUCT
- MOST PROFITABLE PRODUCT FOR EXPORT
-
5. MOST PROMISING SUPPLYING COUNTRIES
Choosing the Best Countries to Establish Your Sustainable Supply Chain
This Chapter is Available Only for the Professional Edition PRO- TOP COUNTRIES TO SOURCE YOUR PRODUCT
- TOP PRODUCING COUNTRIES
- TOP EXPORTING COUNTRIES
- LOW-COST EXPORTING COUNTRIES
-
6. MOST PROMISING OVERSEAS MARKETS
Choosing the Best Countries to Boost Your Exports
This Chapter is Available Only for the Professional Edition PRO- TOP OVERSEAS MARKETS FOR EXPORTING YOUR PRODUCT
- TOP CONSUMING MARKETS
- UNSATURATED MARKETS
- TOP IMPORTING MARKETS
- MOST PROFITABLE MARKETS
7. PRODUCTION
The Latest Trends and Insights into The Industry
- PRODUCTION VOLUME AND VALUE
8. IMPORTS
The Largest Import Supplying Countries
- IMPORTS FROM 2012–2023
- IMPORTS BY COUNTRY
- IMPORT PRICES BY COUNTRY
9. EXPORTS
The Largest Destinations for Exports
- EXPORTS FROM 2012–2023
- EXPORTS BY COUNTRY
- EXPORT PRICES BY COUNTRY
-
10. PROFILES OF MAJOR PRODUCERS
The Largest Producers on The Market and Their Profiles
This Chapter is Available Only for the Professional Edition PRO -
LIST OF TABLES
- Key Findings In 2023
- Market Volume, In Physical Terms, 2012–2023
- Market Value, 2012–2023
- Per Capita Consumption In 2012-2023
- Imports, In Physical Terms, By Country, 2012–2023
- Imports, In Value Terms, By Country, 2012–2023
- Import Prices, By Country Of Origin, 2012–2023
- Exports, In Physical Terms, By Country, 2012–2023
- Exports, In Value Terms, By Country, 2012–2023
- Export Prices, By Country Of Destination, 2012–2023
-
LIST OF FIGURES
- Market Volume, In Physical Terms, 2012–2023
- Market Value, 2012–2023
- Market Structure – Domestic Supply vs. Imports, In Physical Terms, 2012-2023
- Market Structure – Domestic Supply vs. Imports, In Value Terms, 2012-2023
- Trade Balance, In Physical Terms, 2012-2023
- Trade Balance, In Value Terms, 2012-2023
- Per Capita Consumption, 2012-2023
- Market Volume Forecast to 2030
- Market Value Forecast to 2030
- Products: Market Size And Growth, By Type
- Products: Average Per Capita Consumption, By Type
- Products: Exports And Growth, By Type
- Products: Export Prices And Growth, By Type
- Production Volume And Growth
- Exports And Growth
- Export Prices And Growth
- Market Size And Growth
- Per Capita Consumption
- Imports And Growth
- Import Prices
- Production, In Physical Terms, 2012–2023
- Production, In Value Terms, 2012–2023
- Imports, In Physical Terms, 2012–2023
- Imports, In Value Terms, 2012–2023
- Imports, In Physical Terms, By Country, 2023
- Imports, In Physical Terms, By Country, 2012–2023
- Imports, In Value Terms, By Country, 2012–2023
- Import Prices, By Country Of Origin, 2012–2023
- Exports, In Physical Terms, 2012–2023
- Exports, In Value Terms, 2012–2023
- Exports, In Physical Terms, By Country, 2023
- Exports, In Physical Terms, By Country, 2012–2023
- Exports, In Value Terms, By Country, 2012–2023
- Export Prices, By Country Of Destination, 2012–2023


