Qatar - Cheese and Curd - Market Analysis, Forecast, Size, Trends And Insights
Get instant access to more than 2 million reports, dashboards, and datasets on the IndexBox Platform.
View PricingImports of Cheese and Curd in Qatar Surge 67% to $8.4M in August 2023
Qatar Cheese And Curd Imports
In August 2023, overseas purchases of cheese and curd were finally on the rise to reach 1.2K tons for the first time since May 2023, thus ending a two-month declining trend. Overall, total imports indicated a mild expansion from August 2022 to August 2023: its volume increased at an average monthly rate of +1.9% over the last twelve months. The trend pattern, however, indicated some noticeable fluctuations being recorded throughout the analyzed period. Based on August 2023 figures, imports increased by +69.7% against July 2023 indices. As a result, imports reached the peak and are likely to continue growth in the immediate term.
In value terms, cheese and curd imports surged to $8.4M (IndexBox estimates) in August 2023. In general, total imports indicated temperate growth from August 2022 to August 2023: its value increased at an average monthly rate of +2.6% over the last twelve-month period. The trend pattern, however, indicated some noticeable fluctuations being recorded throughout the analyzed period. Based on August 2023 figures, imports increased by +21.4% against May 2023 indices. As a result, imports reached the peak and are likely to continue growth in the immediate term.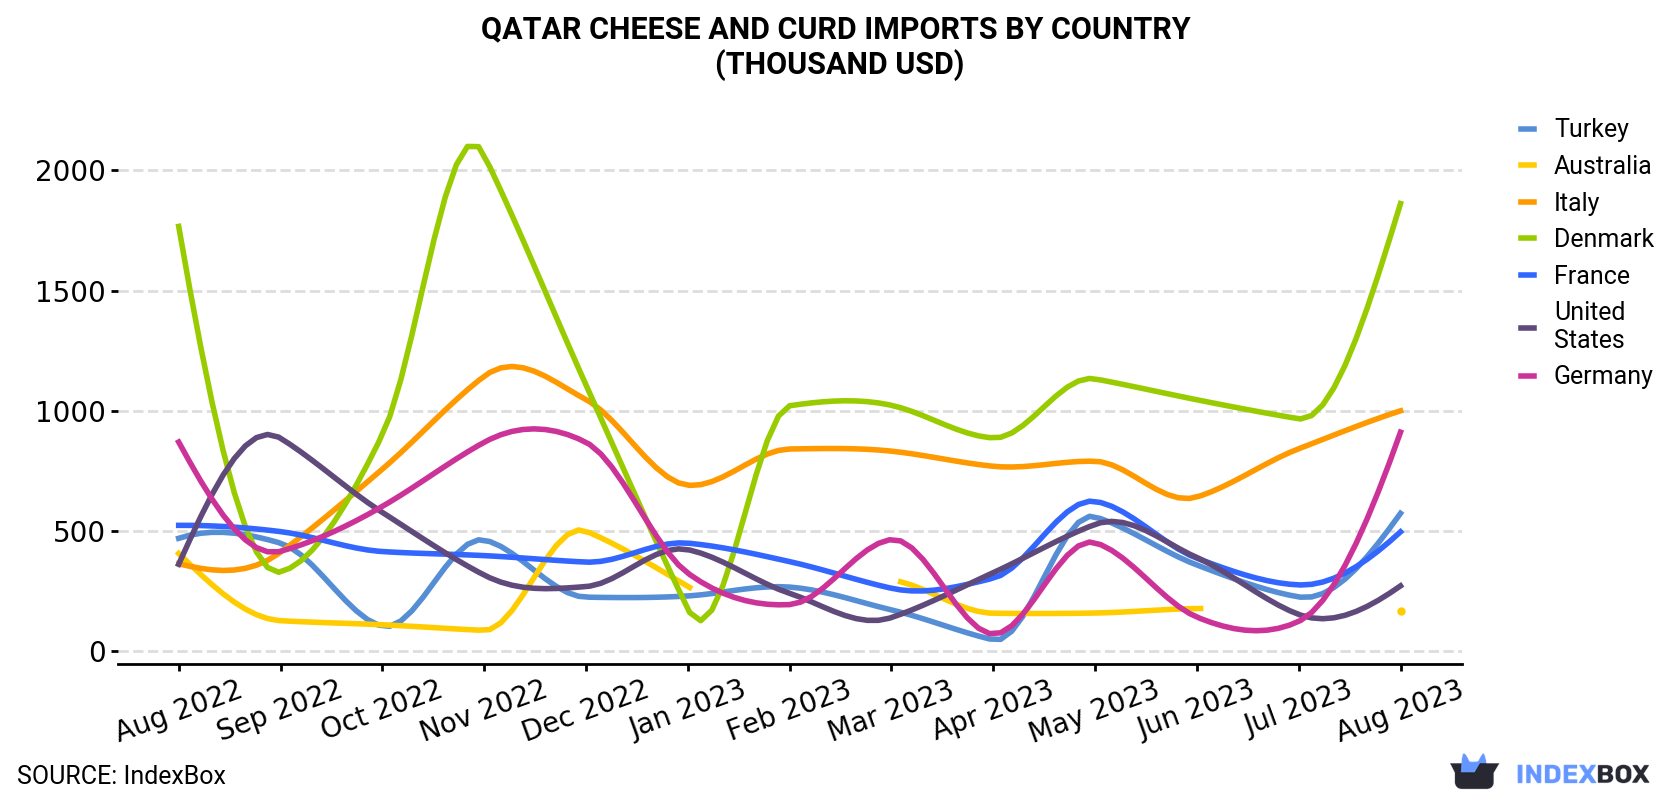
| COUNTRY | Import Value of Cheese And Curd in Qatar (thousand USD) | ||||||||||||
|---|---|---|---|---|---|---|---|---|---|---|---|---|---|
| Aug 2022 | Sep 2022 | Oct 2022 | Nov 2022 | Dec 2022 | Jan 2023 | Feb 2023 | Mar 2023 | Apr 2023 | May 2023 | Jun 2023 | Jul 2023 | Aug 2023 | |
| Denmark | 1,767 | 328 | 899 | 2,064 | 1,107 | 174 | 1,020 | 1,022 | 886 | 1,132 | 1,045 | 966 | 1,862 |
| Italy | 362 | 410 | 756 | 1,143 | 1,046 | 689 | 840 | 831 | 768 | 789 | 640 | 841 | 999 |
| Germany | 869 | 414 | 601 | 868 | 868 | 323 | 192 | 463 | 69.1 | 450 | 140 | 122 | 910 |
| Turkey | 468 | 448 | 102 | 461 | 223 | 228 | 265 | 170 | 45.1 | 558 | 357 | 224 | 572 |
| France | 522 | 496 | 413 | 396 | 369 | 448 | 371 | 260 | 302 | 622 | 385 | 274 | 495 |
| United States | 360 | 885 | 576 | 315 | 267 | 421 | 239 | 138 | 325 | 526 | 388 | 151 | 270 |
| Australia | 405 | 125 | 108 | 84.6 | 498 | 268 | N/A | 294 | 156 | 157 | 176 | N/A | 166 |
| Others | 1,402 | 2,372 | 2,863 | 2,565 | 3,327 | 2,087 | 2,239 | 2,310 | 1,962 | 2,681 | 1,736 | 2,462 | 3,123 |
| Total | 6,153 | 5,478 | 6,318 | 7,897 | 7,706 | 4,638 | 5,166 | 5,489 | 4,513 | 6,916 | 4,866 | 5,041 | 8,397 |
Imports by Country
Denmark (266 tons), Germany (136 tons) and Turkey (112 tons) were the main suppliers of cheese and curd imports to Qatar, with a combined 44% share of total imports. Italy, France, Australia and the United States lagged somewhat behind, together accounting for a further 16%.
From August 2022 to August 2023, the biggest increases were in Italy (with a CAGR of +7.9%), while purchases for the other leaders experienced more modest paces of growth.
In value terms, the largest cheese and curd suppliers to Qatar were Denmark ($1.9M), Italy ($999K) and Germany ($910K), together accounting for 45% of total imports.
Among the main suppliers, Italy, with a CAGR of +8.8%, saw the highest rates of growth with regard to the value of imports, over the period under review, while purchases for the other leaders experienced more modest paces of growth.
Imports by Type
In August 2023, processed cheese (excluding grated or powdered) (648 tons) constituted the largest type of cheese and curd supplied to Qatar, accounting for a 55% share of total imports. Moreover, processed cheese (excluding grated or powdered) exceeded the figures recorded for the second-largest type, cheese, other than blue-veined, grated, powdered or processed (257 tons), threefold. Unripened or uncured cheese (198 tons) ranked third in terms of total imports with a 17% share.
From August 2022 to August 2023, the average monthly rate of growth in terms of the volume of import of processed cheese (excluding grated or powdered) amounted to +1.8%. With regard to the other supplied products, the following average monthly rates of growth were recorded: cheese, other than blue-veined, grated, powdered or processed (+3.8% per month) and unripened or uncured cheese (-0.2% per month).
In value terms, processed cheese (excluding grated or powdered) ($4.5M) constituted the largest type of cheese and curd supplied to Qatar, comprising 53% of total imports. The second position in the ranking was taken by cheese, other than blue-veined, grated, powdered or processed ($2M), with a 23% share of total imports. It was followed by unripened or uncured cheese, with an 18% share.
Import Prices by Country
In August 2023, the cheese and curd price stood at $7,145 per ton (CIF, Qatar), waning by -1.8% against the previous month. Overall, the import price, however, continues to indicate a relatively flat trend pattern. The most prominent rate of growth was recorded in November 2022 an increase of 19% against the previous month. The import price peaked at $7,920 per ton in April 2023; however, from May 2023 to August 2023, import prices stood at a somewhat lower figure.
There were significant differences in the average prices amongst the major supplying countries. In August 2023, the country with the highest price was France ($13,233 per ton), while the price for Austria ($3,922 per ton) was amongst the lowest.
From August 2022 to August 2023, the most notable rate of growth in terms of prices was attained by Denmark (+1.6%), while the prices for the other major suppliers experienced more modest paces of growth.
This report provides an in-depth analysis of the cheese and curd market in Qatar. Within it, you will discover the latest data on market trends and opportunities by country, consumption, production and price developments, as well as the global trade (imports and exports). The forecast exhibits the market prospects through 2030.
Product coverage:
- FCL 901 - Cheese from Whole Cow Milk
- FCL 904 - Cheese from Skimmed Cow Milk
- FCL 905 - Whey Cheese
- FCL 907 - Processed Cheese
- FCL 955 - Cheese of Buffalo Milk
- FCL 984 - Cheese of Sheep Milk
- FCL 1021 - Cheese of Goat Milk
Country coverage:
- Qatar
Data coverage:
- Market volume and value
- Per Capita consumption
- Forecast of the market dynamics in the medium term
- Trade (exports and imports) in Qatar
- Export and import prices
- Market trends, drivers and restraints
- Key market players and their profiles
Reasons to buy this report:
- Take advantage of the latest data
- Find deeper insights into current market developments
- Discover vital success factors affecting the market
This report is designed for manufacturers, distributors, importers, and wholesalers, as well as for investors, consultants and advisors.
In this report, you can find information that helps you to make informed decisions on the following issues:
- How to diversify your business and benefit from new market opportunities
- How to load your idle production capacity
- How to boost your sales on overseas markets
- How to increase your profit margins
- How to make your supply chain more sustainable
- How to reduce your production and supply chain costs
- How to outsource production to other countries
- How to prepare your business for global expansion
While doing this research, we combine the accumulated expertise of our analysts and the capabilities of artificial intelligence. The AI-based platform, developed by our data scientists, constitutes the key working tool for business analysts, empowering them to discover deep insights and ideas from the marketing data.
-
1. INTRODUCTION
Making Data-Driven Decisions to Grow Your Business
- REPORT DESCRIPTION
- RESEARCH METHODOLOGY AND AI PLATFORM
- DATA-DRIVEN DECISIONS FOR YOUR BUSINESS
- GLOSSARY AND SPECIFIC TERMS
-
2. EXECUTIVE SUMMARY
A Quick Overview of Market Performance
- KEY FINDINGS
- MARKET TRENDS This Chapter is Available Only for the Professional Edition PRO
-
3. MARKET OVERVIEW
Understanding the Current State of The Market and Its Prospects
- MARKET SIZE
- MARKET STRUCTURE
- TRADE BALANCE
- PER CAPITA CONSUMPTION
- MARKET FORECAST TO 2030
-
4. MOST PROMISING PRODUCT
Finding New Products to Diversify Your Business
This Chapter is Available Only for the Professional Edition PRO- TOP PRODUCTS TO DIVERSIFY YOUR BUSINESS
- BEST-SELLING PRODUCTS
- MOST CONSUMED PRODUCT
- MOST TRADED PRODUCT
- MOST PROFITABLE PRODUCT FOR EXPORT
-
5. MOST PROMISING SUPPLYING COUNTRIES
Choosing the Best Countries to Establish Your Sustainable Supply Chain
This Chapter is Available Only for the Professional Edition PRO- TOP COUNTRIES TO SOURCE YOUR PRODUCT
- TOP PRODUCING COUNTRIES
- TOP EXPORTING COUNTRIES
- LOW-COST EXPORTING COUNTRIES
-
6. MOST PROMISING OVERSEAS MARKETS
Choosing the Best Countries to Boost Your Exports
This Chapter is Available Only for the Professional Edition PRO- TOP OVERSEAS MARKETS FOR EXPORTING YOUR PRODUCT
- TOP CONSUMING MARKETS
- UNSATURATED MARKETS
- TOP IMPORTING MARKETS
- MOST PROFITABLE MARKETS
7. PRODUCTION
The Latest Trends and Insights into The Industry
- PRODUCTION VOLUME AND VALUE
8. IMPORTS
The Largest Import Supplying Countries
- IMPORTS FROM 2012–2023
- IMPORTS BY COUNTRY
- IMPORT PRICES BY COUNTRY
9. EXPORTS
The Largest Destinations for Exports
- EXPORTS FROM 2012–2023
- EXPORTS BY COUNTRY
- EXPORT PRICES BY COUNTRY
-
10. PROFILES OF MAJOR PRODUCERS
The Largest Producers on The Market and Their Profiles
This Chapter is Available Only for the Professional Edition PRO -
LIST OF TABLES
- Key Findings In 2023
- Market Volume, In Physical Terms, 2012–2023
- Market Value, 2012–2023
- Per Capita Consumption In 2012-2023
- Imports, In Physical Terms, By Country, 2012–2023
- Imports, In Value Terms, By Country, 2012–2023
- Import Prices, By Country Of Origin, 2012–2023
- Exports, In Physical Terms, By Country, 2012–2023
- Exports, In Value Terms, By Country, 2012–2023
- Export Prices, By Country Of Destination, 2012–2023
-
LIST OF FIGURES
- Market Volume, In Physical Terms, 2012–2023
- Market Value, 2012–2023
- Market Structure – Domestic Supply vs. Imports, In Physical Terms, 2012-2023
- Market Structure – Domestic Supply vs. Imports, In Value Terms, 2012-2023
- Trade Balance, In Physical Terms, 2012-2023
- Trade Balance, In Value Terms, 2012-2023
- Per Capita Consumption, 2012-2023
- Market Volume Forecast to 2030
- Market Value Forecast to 2030
- Products: Market Size And Growth, By Type
- Products: Average Per Capita Consumption, By Type
- Products: Exports And Growth, By Type
- Products: Export Prices And Growth, By Type
- Production Volume And Growth
- Exports And Growth
- Export Prices And Growth
- Market Size And Growth
- Per Capita Consumption
- Imports And Growth
- Import Prices
- Production, In Physical Terms, 2012–2023
- Production, In Value Terms, 2012–2023
- Imports, In Physical Terms, 2012–2023
- Imports, In Value Terms, 2012–2023
- Imports, In Physical Terms, By Country, 2023
- Imports, In Physical Terms, By Country, 2012–2023
- Imports, In Value Terms, By Country, 2012–2023
- Import Prices, By Country Of Origin, 2012–2023
- Exports, In Physical Terms, 2012–2023
- Exports, In Value Terms, 2012–2023
- Exports, In Physical Terms, By Country, 2023
- Exports, In Physical Terms, By Country, 2012–2023
- Exports, In Value Terms, By Country, 2012–2023
- Export Prices, By Country Of Destination, 2012–2023


