
World - Motor Graders And Levellers - Market Analysis, Forecast, Size, Trends And Insights
Get instant access to more than 2 million reports, dashboards, and datasets on the IndexBox Platform.
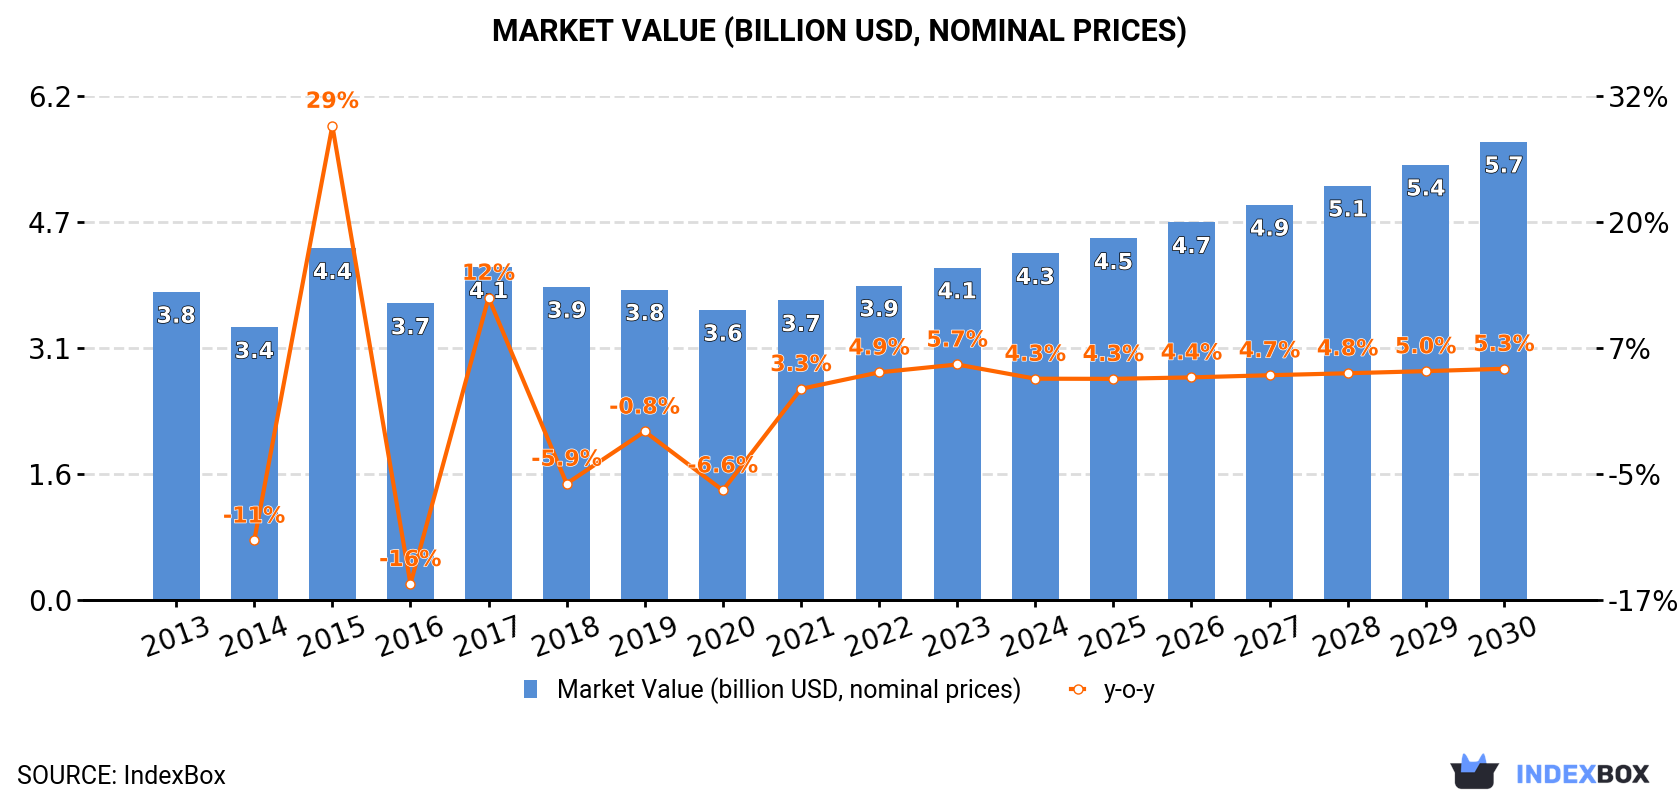
View PricingGlobal Market for Motor Graders and Levellers Expected to Reach $5.7B by 2030 with a CAGR of +4.7%
IndexBox has just published a new report: World - Motor Graders And Levellers - Market Analysis, Forecast, Size, Trends And Insights.
The global motor grader and leveller market is predicted to experience growth with an anticipated CAGR of +2.4% in volume and +4.7% in value from 2023 to 2030. Sales of motor graders saw a slight increase in 2023, with countries like China, the United States, and Singapore leading in consumption. China remains the largest producer of motor graders, while the United States is a key exporter. Prices and imports are fluctuating, with countries like Italy and Brazil showing significant growth rates. Overall, the industry is expected to continue growing in the coming years.
Market Forecast
Market Forecast
Driven by increasing demand for motor graders and levellers worldwide, the market is expected to continue an upward consumption trend over the next seven-year period. Market performance is forecast to accelerate, expanding with an anticipated CAGR of +2.4% for the period from 2023 to 2030, which is projected to bring the market volume to 42K units by the end of 2030.
In value terms, the market is forecast to increase with an anticipated CAGR of +4.7% for the period from 2023 to 2030, which is projected to bring the market value to $5.7B (in nominal prices) by the end of 2030.
Consumption
Consumption
In 2023, approx. 36K units of motor graders and levellers were consumed worldwide; picking up by 7.2% on the previous year's figure. Overall, consumption recorded a relatively flat trend pattern. Over the period under review, global consumption reached the peak volume at 39K units in 2017; however, from 2018 to 2023, consumption remained at a lower figure.
The global motor grader market revenue was estimated at $4.1B in 2023, picking up by 5.7% against the previous year. This figure reflects the total revenues of producers and importers (excluding logistics costs, retail marketing costs, and retailers' margins, which will be included in the final consumer price). Over the period under review, consumption recorded a relatively flat trend pattern. As a result, consumption reached the peak level of $4.4B. From 2016 to 2023, the growth of the global market failed to regain momentum.
Consumption By Country
The countries with the highest volumes of consumption in 2023 were China (6.2K units), the United States (5.1K units) and Singapore (2.1K units), with a combined 37% share of global consumption. Japan, Russia, Mexico, Germany, Indonesia, the UK, Canada, Australia, Brazil and India lagged somewhat behind, together accounting for a further 32%.
From 2013 to 2023, the most notable rate of growth in terms of consumption, amongst the key consuming countries, was attained by India (with a CAGR of +14.4%), while consumption for the other global leaders experienced more modest paces of growth.
In value terms, the United States ($867M), China ($476M) and Australia ($289M) were the countries with the highest levels of market value in 2023, with a combined 40% share of the global market. Canada, Singapore, Brazil, Russia, Germany, Japan, Indonesia, Mexico, India and the UK lagged somewhat behind, together accounting for a further 34%.
India, with a CAGR of +16.4%, saw the highest rates of growth with regard to market size in terms of the main consuming countries over the period under review, while market for the other global leaders experienced more modest paces of growth.
In 2023, the highest levels of motor grader per capita consumption was registered in Singapore (356 units per million persons), followed by Australia (33 units per million persons), Canada (23 units per million persons) and the UK (15 units per million persons), while the world average per capita consumption of motor grader was estimated at 4.5 units per million persons.
From 2013 to 2023, the average annual rate of growth in terms of the motor grader per capita consumption in Singapore stood at +7.9%. The remaining consuming countries recorded the following average annual rates of per capita consumption growth: Australia (+5.0% per year) and Canada (-1.5% per year).
Production
Production
In 2023, the amount of motor graders and levellers produced worldwide expanded to 36K units, increasing by 2.6% on the previous year. The total output volume increased at an average annual rate of +1.1% from 2013 to 2023; the trend pattern remained consistent, with only minor fluctuations throughout the analyzed period. The pace of growth appeared the most rapid in 2020 with an increase of 2.9%. Over the period under review, global production hit record highs in 2023 and is likely to see gradual growth in the near future.
In value terms, motor grader production stood at $3.7B in 2023 estimated in export price. Over the period under review, production showed a relatively flat trend pattern. The most prominent rate of growth was recorded in 2015 with an increase of 12% against the previous year. As a result, production reached the peak level of $4.2B. From 2016 to 2023, global production growth remained at a somewhat lower figure.
Production By Country
China (14K units) remains the largest motor grader producing country worldwide, accounting for 39% of total volume. Moreover, motor grader production in China exceeded the figures recorded by the second-largest producer, the United States (5.3K units), threefold. The third position in this ranking was held by Brazil (3.9K units), with an 11% share.
In China, motor grader production remained relatively stable over the period from 2013-2023. The remaining producing countries recorded the following average annual rates of production growth: the United States (+0.5% per year) and Brazil (+0.6% per year).
Imports
Imports
In 2023, overseas purchases of motor graders and levellers decreased by -5.6% to 23K units for the first time since 2020, thus ending a two-year rising trend. In general, imports, however, continue to indicate a relatively flat trend pattern. The most prominent rate of growth was recorded in 2021 with an increase of 45%. Over the period under review, global imports attained the maximum at 24K units in 2022, and then contracted in the following year.
In value terms, motor grader imports skyrocketed to $2.8B in 2023. Overall, total imports indicated a notable increase from 2013 to 2023: its value increased at an average annual rate of +2.5% over the last decade. The trend pattern, however, indicated some noticeable fluctuations being recorded throughout the analyzed period. Based on 2023 figures, imports increased by +86.7% against 2020 indices. The pace of growth appeared the most rapid in 2021 when imports increased by 39%. Global imports peaked in 2023 and are expected to retain growth in the near future.
Imports By Country
In 2023, the United States (2.1K units), Singapore (1.8K units), Mexico (1.2K units), Indonesia (1.1K units), Canada (1K units), Russia (0.9K units), Australia (0.9K units), the UK (0.8K units), India (0.8K units), South Africa (0.7K units), the Philippines (0.6K units) and Argentina (0.6K units) represented the main importer of motor graders and levellers in the world, generating 55% of total import. Chile (418 units) took a relatively small share of total imports.
From 2013 to 2023, the most notable rate of growth in terms of purchases, amongst the main importing countries, was attained by Singapore (with a CAGR of +24.0%), while imports for the other global leaders experienced more modest paces of growth.
In value terms, the United States ($485M), Australia ($336M) and Canada ($317M) were the countries with the highest levels of imports in 2023, together accounting for 41% of global imports. Indonesia, India, Argentina, Mexico, Russia, South Africa, Chile, the Philippines, the UK and Singapore lagged somewhat behind, together accounting for a further 26%.
India, with a CAGR of +20.1%, saw the highest rates of growth with regard to the value of imports, in terms of the main importing countries over the period under review, while purchases for the other global leaders experienced more modest paces of growth.
Import Prices By Country
The average motor grader import price stood at $122,660 per unit in 2023, with an increase of 33% against the previous year. Over the last decade, it increased at an average annual rate of +1.6%. As a result, import price reached the peak level and is likely to continue growth in the immediate term.
Prices varied noticeably by country of destination: amid the top importers, the country with the highest price was Australia ($367,882 per unit), while Singapore ($1,563 per unit) was amongst the lowest.
From 2013 to 2023, the most notable rate of growth in terms of prices was attained by the UK (+13.9%), while the other global leaders experienced more modest paces of growth.
Exports
Exports
After two years of growth, overseas shipments of motor graders and levellers decreased by -11.3% to 22K units in 2023. In general, total exports indicated temperate growth from 2013 to 2023: its volume increased at an average annual rate of +2.0% over the last decade. The trend pattern, however, indicated some noticeable fluctuations being recorded throughout the analyzed period. Based on 2023 figures, exports increased by +60.2% against 2020 indices. The pace of growth appeared the most rapid in 2021 when exports increased by 39% against the previous year. The global exports peaked at 25K units in 2022, and then contracted in the following year.
In value terms, motor grader exports surged to $2.7B in 2023. Overall, total exports indicated noticeable growth from 2013 to 2023: its value increased at an average annual rate of +2.2% over the last decade. The trend pattern, however, indicated some noticeable fluctuations being recorded throughout the analyzed period. Based on 2023 figures, exports increased by +91.4% against 2020 indices. The most prominent rate of growth was recorded in 2021 with an increase of 37%. The global exports peaked in 2023 and are expected to retain growth in years to come.
Exports By Country
China was the largest exporting country with an export of about 7.6K units, which accounted for 34% of total exports. Brazil (3.4K units) held the second position in the ranking, followed by the United States (2.4K units), Japan (2.2K units) and Poland (1.6K units). All these countries together held near 43% share of total exports. Singapore (749 units), Italy (557 units), the Netherlands (436 units) and Turkey (427 units) followed a long way behind the leaders.
Exports from China increased at an average annual rate of +5.1% from 2013 to 2023. At the same time, Poland (+30.4%), Turkey (+17.0%), Singapore (+11.0%), Brazil (+3.9%) and the Netherlands (+2.7%) displayed positive paces of growth. Moreover, Poland emerged as the fastest-growing exporter exported in the world, with a CAGR of +30.4% from 2013-2023. Japan experienced a relatively flat trend pattern. By contrast, Italy (-1.3%) and the United States (-5.4%) illustrated a downward trend over the same period. While the share of China (+8.8 p.p.), Poland (+6.6 p.p.), Brazil (+2.6 p.p.) and Singapore (+1.9 p.p.) increased significantly in terms of the global exports from 2013-2023, the share of the United States (-12 p.p.) displayed negative dynamics. The shares of the other countries remained relatively stable throughout the analyzed period.
In value terms, Brazil ($844M), the United States ($684M) and China ($603M) constituted the countries with the highest levels of exports in 2023, with a combined 78% share of global exports. Japan, the Netherlands, Italy, Turkey, Singapore and Poland lagged somewhat behind, together comprising a further 12%.
In terms of the main exporting countries, Italy, with a CAGR of +26.1%, recorded the highest growth rate of the value of exports, over the period under review, while shipments for the other global leaders experienced more modest paces of growth.
Export Prices By Country
The average motor grader export price stood at $120,709 per unit in 2023, increasing by 45% against the previous year. In general, the export price recorded a relatively flat trend pattern. Over the period under review, the average export prices hit record highs at $131,940 per unit in 2015; however, from 2016 to 2023, the export prices failed to regain momentum.
Prices varied noticeably by country of origin: amid the top suppliers, the country with the highest price was the United States ($284,701 per unit), while Poland ($3,308 per unit) was amongst the lowest.
From 2013 to 2023, the most notable rate of growth in terms of prices was attained by Italy (+27.8%), while the other global leaders experienced more modest paces of growth.
This report provides an in-depth analysis of the global motor grader market. Within it, you will discover the latest data on market trends and opportunities by country, consumption, production and price developments, as well as the global trade (imports and exports). The forecast exhibits the market prospects through 2030.
Product coverage:
- Prodcom 28922200 - Motor graders and levellers
Country coverage:
Worldwide - the report contains statistical data for 200 countries and includes detailed profiles of the 50 largest consuming countries:
- USA
- China
- Japan
- Germany
- United Kingdom
- France
- Brazil
- Italy
- Russian Federation
- India
- Canada
- Australia
- Republic of Korea
- Spain
- Mexico
- Indonesia
- Netherlands
- Turkey
- Saudi Arabia
- Switzerland
- Sweden
- Nigeria
- Poland
- Belgium
- Argentina
- Norway
- Austria
- Thailand
- United Arab Emirates
- Colombia
- Denmark
- South Africa
- Malaysia
- Israel
- Singapore
- Egypt
- Philippines
- Finland
- Chile
- Ireland
- Pakistan
- Greece
- Portugal
- Kazakhstan
- Algeria
- Czech Republic
- Qatar
- Peru
- Romania
- Vietnam
+ the largest producing countries
Data coverage:
- Global market volume and value
- Per Capita consumption
- Forecast of the market dynamics in the medium term
- Global production, split by region and country
- Global trade (exports and imports)
- Export and import prices
- Market trends, drivers and restraints
- Key market players and their profiles
Reasons to buy this report:
- Take advantage of the latest data
- Find deeper insights into current market developments
- Discover vital success factors affecting the market
This report is designed for manufacturers, distributors, importers, and wholesalers, as well as for investors, consultants and advisors.
In this report, you can find information that helps you to make informed decisions on the following issues:
- How to diversify your business and benefit from new market opportunities
- How to load your idle production capacity
- How to boost your sales on overseas markets
- How to increase your profit margins
- How to make your supply chain more sustainable
- How to reduce your production and supply chain costs
- How to outsource production to other countries
- How to prepare your business for global expansion
While doing this research, we combine the accumulated expertise of our analysts and the capabilities of artificial intelligence. The AI-based platform, developed by our data scientists, constitutes the key working tool for business analysts, empowering them to discover deep insights and ideas from the marketing data.
-
1. INTRODUCTION
Making Data-Driven Decisions to Grow Your Business
- REPORT DESCRIPTION
- RESEARCH METHODOLOGY AND AI PLATFORM
- DATA-DRIVEN DECISIONS FOR YOUR BUSINESS
- GLOSSARY AND SPECIFIC TERMS
-
2. EXECUTIVE SUMMARY
A Quick Overview of Market Performance
- KEY FINDINGS
- MARKET TRENDS This Chapter is Available Only for the Professional Edition PRO
-
3. MARKET OVERVIEW
Understanding the Current State of The Market and Its Prospects
- MARKET SIZE
- CONSUMPTION BY COUNTRY
- MARKET FORECAST TO 2030
-
4. MOST PROMISING PRODUCT
Finding New Products to Diversify Your Business
This Chapter is Available Only for the Professional Edition PRO- TOP PRODUCTS TO DIVERSIFY YOUR BUSINESS
- BEST-SELLING PRODUCTS
- MOST CONSUMED PRODUCT
- MOST TRADED PRODUCT
- MOST PROFITABLE PRODUCT FOR EXPORT
-
5. MOST PROMISING SUPPLYING COUNTRIES
Choosing the Best Countries to Establish Your Sustainable Supply Chain
This Chapter is Available Only for the Professional Edition PRO- TOP COUNTRIES TO SOURCE YOUR PRODUCT
- TOP PRODUCING COUNTRIES
- TOP EXPORTING COUNTRIES
- LOW-COST EXPORTING COUNTRIES
-
6. MOST PROMISING OVERSEAS MARKETS
Choosing the Best Countries to Boost Your Exports
This Chapter is Available Only for the Professional Edition PRO- TOP OVERSEAS MARKETS FOR EXPORTING YOUR PRODUCT
- TOP CONSUMING MARKETS
- UNSATURATED MARKETS
- TOP IMPORTING MARKETS
- MOST PROFITABLE MARKETS
7. GLOBAL PRODUCTION
The Latest Trends and Insights into The Industry
- PRODUCTION VOLUME AND VALUE
- PRODUCTION BY COUNTRY
8. GLOBAL IMPORTS
The Largest Importers on The Market and How They Succeed
- IMPORTS FROM 2012–2023
- IMPORTS BY COUNTRY
- IMPORT PRICES BY COUNTRY
9. GLOBAL EXPORTS
The Largest Exporters on The Market and How They Succeed
- EXPORTS FROM 2012–2023
- EXPORTS BY COUNTRY
- EXPORT PRICES BY COUNTRY
-
10. PROFILES OF MAJOR PRODUCERS
The Largest Producers on The Market and Their Profiles
This Chapter is Available Only for the Professional Edition PRO -
11. COUNTRY PROFILES
The Largest Markets And Their Profiles
This Chapter is Available Only for the Professional Edition PRO- United States
- China
- Japan
- Germany
- United Kingdom
- France
- Brazil
- Italy
- Russian Federation
- India
- Canada
- Australia
- Republic of Korea
- Spain
- Mexico
- Indonesia
- Netherlands
- Turkey
- Saudi Arabia
- Switzerland
- Sweden
- Nigeria
- Poland
- Belgium
- Argentina
- Norway
- Austria
- Thailand
- United Arab Emirates
- Colombia
- Denmark
- South Africa
- Malaysia
- Israel
- Singapore
- Egypt
- Philippines
- Finland
- Chile
- Ireland
- Pakistan
- Greece
- Portugal
- Kazakhstan
- Algeria
- Czech Republic
- Qatar
- Peru
- Romania
- Vietnam
-
LIST OF TABLES
- Key Findings In 2023
- Market Volume, In Physical Terms, 2012–2023
- Market Value, 2012–2023
- Per Capita Consumption, By Country, 2018–2023
- Production, In Physical Terms, By Country, 2012–2023
- Imports, In Physical Terms, By Country, 2012–2023
- Imports, In Value Terms, By Country, 2012–2023
- Import Prices, By Country Of Destination, 2012–2023
- Exports, In Physical Terms, By Country, 2012–2023
- Exports, In Value Terms, By Country, 2012–2023
- Export Prices, By Country Of Origin, 2012–2023
-
LIST OF FIGURES
- Market Volume, In Physical Terms, 2012–2023
- Market Value, 2012–2023
- Consumption, By Country, 2023
- Market Volume Forecast to 2030
- Market Value Forecast to 2030
- Products: Market Size And Growth, By Type
- Products: Average Per Capita Consumption, By Type
- Products: Exports And Growth, By Type
- Products: Export Prices And Growth, By Type
- Production Volume And Growth
- Exports And Growth
- Export Prices And Growth
- Market Size And Growth
- Per Capita Consumption
- Imports And Growth
- Import Prices
- Production, In Physical Terms, 2012–2023
- Production, In Value Terms, 2012–2023
- Production, By Country, 2023
- Production, In Physical Terms, By Country, 2012–2023
- Imports, In Physical Terms, 2012–2023
- Imports, In Value Terms, 2012–2023
- Imports, In Physical Terms, By Country, 2023
- Imports, In Physical Terms, By Country, 2012–2023
- Imports, In Value Terms, By Country, 2012–2023
- Import Prices, By Country, 2012–2023
- Exports, In Physical Terms, 2012–2023
- Exports, In Value Terms, 2012–2023
- Exports, In Physical Terms, By Country, 2023
- Exports, In Physical Terms, By Country, 2012–2023
- Exports, In Value Terms, By Country, 2012–2023
- Export Prices, 2012–2023


