
Mexico - Luggage And Handbags - Market Analysis, Forecast, Size, Trends and Insights
Get instant access to more than 2 million reports, dashboards, and datasets on the IndexBox Platform.
View PricingSharp Decrease in Price of Mexican Luggage to $3.5 per Unit
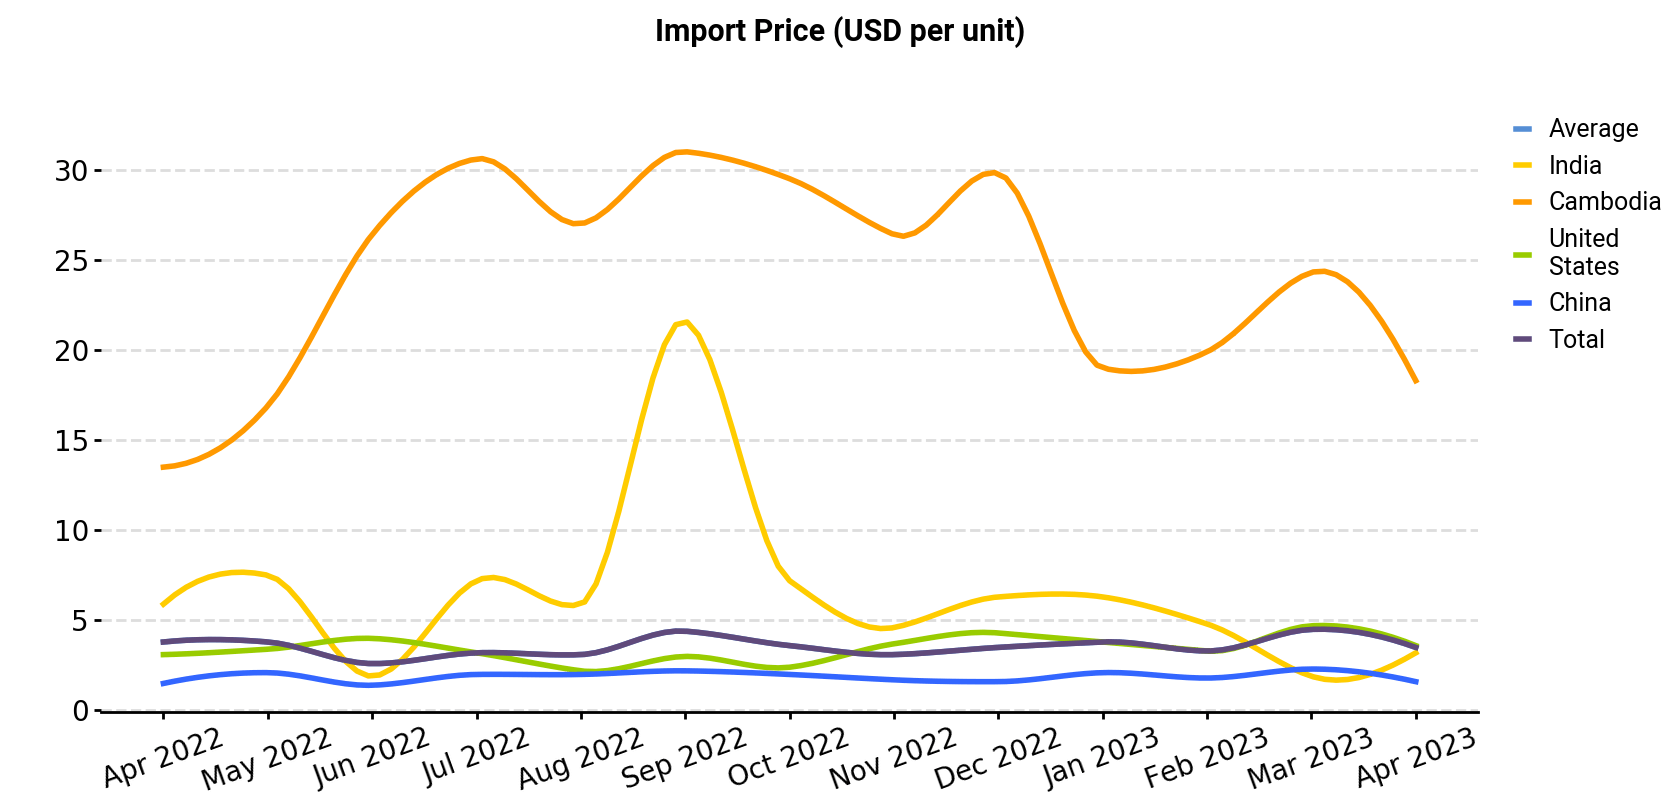
Mexico Luggage Import Price in April 2023
In April 2023, the luggage price amounted to $3.5 per unit (CIF, Mexico), shrinking by -23.7% against the previous month. Overall, the import price recorded a relatively flat trend pattern. The growth pace was the most rapid in September 2022 an increase of 43% against the previous month. Over the period under review, average import prices hit record highs at $4.5 per unit in March 2023, and then declined dramatically in the following month.
Prices varied noticeably by the country of origin: the country with the highest price was Cambodia ($18.3 per unit), while the price for China ($1.6 per unit) was amongst the lowest.
From April 2022 to April 2023, the most notable rate of growth in terms of prices was attained by Cambodia (+2.6%), while the prices for the other major suppliers experienced more modest paces of growth.
Mexico Luggage Import Prices by Type
Prices varied noticeably by the product type; the product with the highest price was handbags with outer surface of leather, composition leather, or patent leather ($26.2 per unit), while the price for cases and containers; trunks, suit-cases, vanity-cases, executive-cases, brief-cases, school satchels and similar containers, with outer surface of leather, of composition leather or of patent leather ($799 per thousand units) was amongst the lowest.
From April 2022 to April 2023, the most notable rate of growth in terms of prices was attained by travel sets; for personal toilet, sewing, shoe or clothes cleaning (+19.7%), while the prices for the other products experienced more modest paces of growth.
Mexico Luggage Imports
Luggage imports into Mexico skyrocketed to 9.9M units in April 2023, with an increase of 29% against the previous month. Over the period under review, imports showed slight growth. The most prominent rate of growth was recorded in June 2022 when imports increased by 68% against the previous month. Imports peaked at 18M units in August 2022; however, from September 2022 to April 2023, imports failed to regain momentum.
In value terms, luggage imports fell slightly to $34M (IndexBox estimates) in April 2023. Overall, imports showed a relatively flat trend pattern. The most prominent rate of growth was recorded in July 2022 with an increase of 28% against the previous month. Over the period under review, imports attained the maximum at 60M units in October 2022; however, from November 2022 to April 2023, imports stood at a somewhat lower figure.
Mexico Luggage Imports by Type
Handbags with outer surface of plastic sheeting or of textile materials (5.6M units), cases and containers; trunks, suit-cases, vanity-cases, executive-cases, brief-cases, school satchels and similar containers, with outer surface of plastics or of textile materials (3.1M units) and handbags with outer surface of leather, composition leather, or patent leather (459K units) were the main products of luggage imports to Mexico, with a combined 93% share of total imports. Cases and containers; trunks, suit-cases, vanity-cases, executive-cases, brief-cases, school satchels and similar containers, with outer surface of vulcanised fibre or of paperboard, cases and containers; trunks, suit-cases, vanity-cases, executive-cases, brief-cases, school satchels and similar containers, with outer surface of leather, of composition leather or of patent leather, travel sets; for personal toilet, sewing, shoe or clothes cleaning and handbags with outer surface of vulcanised fibre or of paperboard lagged somewhat behind, together accounting for a further 6.6%.
From April 2022 to April 2023, the biggest increases were in cases and containers; trunks, suit-cases, vanity-cases, executive-cases, brief-cases, school satchels and similar containers, with outer surface of leather, of composition leather or of patent leather (with a CAGR of +65.5%), while purchases for the other products experienced more modest paces of growth.
In value terms, handbags with outer surface of plastic sheeting or of textile materials ($13M), handbags with outer surface of leather, composition leather, or patent leather ($12M) and cases and containers; trunks, suit-cases, vanity-cases, executive-cases, brief-cases, school satchels and similar containers, with outer surface of plastics or of textile materials ($8.4M) appeared to be the most imported types of luggage and handbags in Mexico, with a combined 96% share of total imports. These products were followed by cases and containers; trunks, suit-cases, vanity-cases, executive-cases, brief-cases, school satchels and similar containers, with outer surface of vulcanised fibre or of paperboard, cases and containers; trunks, suit-cases, vanity-cases, executive-cases, brief-cases, school satchels and similar containers, with outer surface of leather, of composition leather or of patent leather, travel sets; for personal toilet, sewing, shoe or clothes cleaning and handbags with outer surface of vulcanised fibre or of paperboard, which together accounted for a further 3.8%.
Mexico Luggage Imports by Country
In April 2023, China (9M units) was the main supplier of luggage to Mexico, accounting for a 90% share of total imports. Moreover, luggage imports from China exceeded the figures recorded by the second-largest supplier, the United States (377K units), more than tenfold. India (201K units) ranked third in terms of total imports with a 2% share.
From April 2022 to April 2023, the average monthly rate of growth in terms of volume from China was relatively modest. The remaining supplying countries recorded the following average monthly rates of imports growth: the United States (+8.0% per month) and India (+15.3% per month).
In value terms, China ($15M) constituted the largest supplier of luggage to Mexico, comprising 43% of total imports. The second position in the ranking was held by Cambodia ($3.6M), with a 10% share of total imports. It was followed by the United States, with a 3.9% share.
From April 2022 to April 2023, the average monthly rate of growth in terms of value from China amounted to +1.2%. The remaining supplying countries recorded the following average monthly rates of imports growth: Cambodia (+17.1% per month) and the United States (+9.1% per month).
This report provides an in-depth analysis of the luggage market in Mexico. Within it, you will discover the latest data on market trends and opportunities by country, consumption, production and price developments, as well as the global trade (imports and exports). The forecast exhibits the market prospects through 2030.
Product coverage:
- Prodcom 15121210 - Trunks, suitcases, vanity cases, briefcases, school satchels and similar containers of leather, composition leather, patent leather, plastics, textile materials, aluminium or other materials
- Prodcom 15121220 - Handbags of leather, composition leather, patent leather, p lastic sheeting, textile materials or other materials (including those without a handle)
- Prodcom 15121270 - Travel sets for personal toilet, sewing, or shoe or clothes cleaning (excluding manicure sets)
Country coverage:
- Mexico
Data coverage:
- Market volume and value
- Per Capita consumption
- Forecast of the market dynamics in the medium term
- Trade (exports and imports) in Mexico
- Export and import prices
- Market trends, drivers and restraints
- Key market players and their profiles
Reasons to buy this report:
- Take advantage of the latest data
- Find deeper insights into current market developments
- Discover vital success factors affecting the market
This report is designed for manufacturers, distributors, importers, and wholesalers, as well as for investors, consultants and advisors.
In this report, you can find information that helps you to make informed decisions on the following issues:
- How to diversify your business and benefit from new market opportunities
- How to load your idle production capacity
- How to boost your sales on overseas markets
- How to increase your profit margins
- How to make your supply chain more sustainable
- How to reduce your production and supply chain costs
- How to outsource production to other countries
- How to prepare your business for global expansion
While doing this research, we combine the accumulated expertise of our analysts and the capabilities of artificial intelligence. The AI-based platform, developed by our data scientists, constitutes the key working tool for business analysts, empowering them to discover deep insights and ideas from the marketing data.
-
1. INTRODUCTION
Making Data-Driven Decisions to Grow Your Business
- REPORT DESCRIPTION
- RESEARCH METHODOLOGY AND AI PLATFORM
- DATA-DRIVEN DECISIONS FOR YOUR BUSINESS
- GLOSSARY AND SPECIFIC TERMS
-
2. EXECUTIVE SUMMARY
A Quick Overview of Market Performance
- KEY FINDINGS
- MARKET TRENDS This Chapter is Available Only for the Professional Edition PRO
-
3. MARKET OVERVIEW
Understanding the Current State of The Market and Its Prospects
- MARKET SIZE
- MARKET STRUCTURE
- TRADE BALANCE
- PER CAPITA CONSUMPTION
- MARKET FORECAST TO 2030
-
4. MOST PROMISING PRODUCT
Finding New Products to Diversify Your Business
This Chapter is Available Only for the Professional Edition PRO- TOP PRODUCTS TO DIVERSIFY YOUR BUSINESS
- BEST-SELLING PRODUCTS
- MOST CONSUMED PRODUCT
- MOST TRADED PRODUCT
- MOST PROFITABLE PRODUCT FOR EXPORT
-
5. MOST PROMISING SUPPLYING COUNTRIES
Choosing the Best Countries to Establish Your Sustainable Supply Chain
This Chapter is Available Only for the Professional Edition PRO- TOP COUNTRIES TO SOURCE YOUR PRODUCT
- TOP PRODUCING COUNTRIES
- TOP EXPORTING COUNTRIES
- LOW-COST EXPORTING COUNTRIES
-
6. MOST PROMISING OVERSEAS MARKETS
Choosing the Best Countries to Boost Your Exports
This Chapter is Available Only for the Professional Edition PRO- TOP OVERSEAS MARKETS FOR EXPORTING YOUR PRODUCT
- TOP CONSUMING MARKETS
- UNSATURATED MARKETS
- TOP IMPORTING MARKETS
- MOST PROFITABLE MARKETS
7. PRODUCTION
The Latest Trends and Insights into The Industry
- PRODUCTION VOLUME AND VALUE
8. IMPORTS
The Largest Import Supplying Countries
- IMPORTS FROM 2012–2023
- IMPORTS BY COUNTRY
- IMPORT PRICES BY COUNTRY
9. EXPORTS
The Largest Destinations for Exports
- EXPORTS FROM 2012–2023
- EXPORTS BY COUNTRY
- EXPORT PRICES BY COUNTRY
-
10. PROFILES OF MAJOR PRODUCERS
The Largest Producers on The Market and Their Profiles
This Chapter is Available Only for the Professional Edition PRO -
LIST OF TABLES
- Key Findings In 2023
- Market Volume, In Physical Terms, 2012–2023
- Market Value, 2012–2023
- Per Capita Consumption In 2012-2023
- Imports, In Physical Terms, By Country, 2012–2023
- Imports, In Value Terms, By Country, 2012–2023
- Import Prices, By Country Of Origin, 2012–2023
- Exports, In Physical Terms, By Country, 2012–2023
- Exports, In Value Terms, By Country, 2012–2023
- Export Prices, By Country Of Destination, 2012–2023
-
LIST OF FIGURES
- Market Volume, In Physical Terms, 2012–2023
- Market Value, 2012–2023
- Market Structure – Domestic Supply vs. Imports, In Physical Terms, 2012-2023
- Market Structure – Domestic Supply vs. Imports, In Value Terms, 2012-2023
- Trade Balance, In Physical Terms, 2012-2023
- Trade Balance, In Value Terms, 2012-2023
- Per Capita Consumption, 2012-2023
- Market Volume Forecast to 2030
- Market Value Forecast to 2030
- Products: Market Size And Growth, By Type
- Products: Average Per Capita Consumption, By Type
- Products: Exports And Growth, By Type
- Products: Export Prices And Growth, By Type
- Production Volume And Growth
- Exports And Growth
- Export Prices And Growth
- Market Size And Growth
- Per Capita Consumption
- Imports And Growth
- Import Prices
- Production, In Physical Terms, 2012–2023
- Production, In Value Terms, 2012–2023
- Imports, In Physical Terms, 2012–2023
- Imports, In Value Terms, 2012–2023
- Imports, In Physical Terms, By Country, 2023
- Imports, In Physical Terms, By Country, 2012–2023
- Imports, In Value Terms, By Country, 2012–2023
- Import Prices, By Country Of Origin, 2012–2023
- Exports, In Physical Terms, 2012–2023
- Exports, In Value Terms, 2012–2023
- Exports, In Physical Terms, By Country, 2023
- Exports, In Physical Terms, By Country, 2012–2023
- Exports, In Value Terms, By Country, 2012–2023
- Export Prices, By Country Of Destination, 2012–2023


