Italy - Mixed Fertilizers - Market Analysis, Forecast, Size, Trends And Insights
Get instant access to more than 2 million reports, dashboards, and datasets on the IndexBox Platform.
View PricingMixed Fertilizer Prices in Italy Surge by 17%, Reaching $1,081 per Ton
Italy Mixed Fertilizer Import Price in May 2023
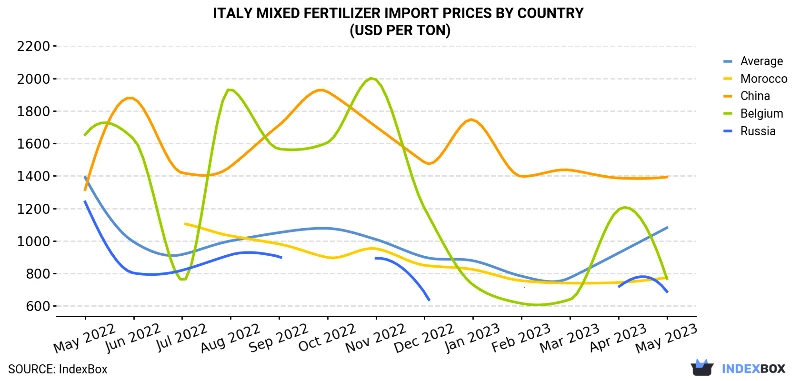
In May 2023, the mixed fertilizer price stood at $1,081 per ton (CIF, Italy), with an increase of 17% against the previous month. In general, the import price, however, showed a pronounced shrinkage. The growth pace was the most rapid in April 2023 when the average import price increased by 20% against the previous month. The import price peaked at $1,391 per ton in May 2022; however, from June 2022 to May 2023, import prices failed to regain momentum.
Prices varied noticeably by the country of origin: the country with the highest price was China ($1,393 per ton), while the price for Russia ($688 per ton) was amongst the lowest.
From May 2022 to May 2023, the most notable rate of growth in terms of prices was attained by China (+0.5%), while the prices for the other major suppliers experienced a decline.
| COUNTRY | Import Price of Mixed Fertilizer in Italy (USD per ton) | ||||||||||||
|---|---|---|---|---|---|---|---|---|---|---|---|---|---|
| May 2022 | Jun 2022 | Jul 2022 | Aug 2022 | Sep 2022 | Oct 2022 | Nov 2022 | Dec 2022 | Jan 2023 | Feb 2023 | Mar 2023 | Apr 2023 | May 2023 | |
| China | 1,315 | 1,877 | 1,419 | 1,458 | 1,712 | 1,918 | 1,703 | 1,483 | 1,746 | 1,397 | 1,436 | 1,387 | 1,393 |
| Morocco | N/A | N/A | 1,108 | 1,031 | 981 | 898 | 952 | 850 | 824 | 755 | 740 | 744 | 774 |
| Belgium | 1,653 | 1,628 | 755 | 1,935 | 1,566 | 1,605 | 1,993 | 1,201 | 730 | 615 | 639 | 1,192 | 767 |
| Russia | 1,240 | 802 | 819 | 914 | 904 | N/A | 893 | 683 | N/A | 722 | N/A | 716 | 688 |
| Average | 1,391 | 994 | 916 | 1,000 | 1,051 | 1,077 | 1,009 | 900 | 878 | 783 | 773 | 925 | 1,081 |
Italy Mixed Fertilizer Import Prices by Type
Prices varied noticeably by the product type; the product with the highest price was mixed phosphorus and potassium (PK) fertilizers ($2,649 per ton), while the price for fertilizers, mineral or chemical; containing nitrates and phosphates ($479 per ton) was amongst the lowest.
From May 2022 to May 2023, the most notable rate of growth in terms of prices was attained by mixed phosphorus and potassium fertilizers (+5.3%), while the prices for the other products experienced a decline.
Italy Mixed Fertilizer Imports
In May 2023, supplies from abroad of mixed fertilizers decreased by -48.9% to 10K tons, falling for the second month in a row after two months of growth. Over the period under review, imports, however, recorded a relatively flat trend pattern. The most prominent rate of growth was recorded in July 2022 with an increase of 161% against the previous month.
In value terms, mixed fertilizer imports contracted rapidly to $11M (IndexBox estimates) in May 2023. In general, imports showed a slight contraction. The most prominent rate of growth was recorded in July 2022 when imports increased by 141% m-o-m.
Italy Mixed Fertilizer Imports by Type
Mixed nitrogen, phosphorus and potassium (NPK) fertilizers (4.2K tons), monoammonium phosphate (MAP) (3.5K tons) and fertilizers, mineral or chemical; containing nitrates and phosphates (1.1K tons) were the main products of mixed fertilizer imports to Italy, with a combined 88% share of total imports.
From May 2022 to May 2023, the biggest increases were in fertilizers, mineral or chemical; containing nitrates and phosphates (with a CAGR of +48.8%), while purchases for the other products experienced more modest paces of growth.
In value terms, the most traded types of mixed fertilizers in Italy were mixed nitrogen, phosphorus and potassium (NPK) fertilizers ($5.5M), monoammonium phosphate (MAP) ($3.1M) and diammonium phosphate ($785K), together comprising 86% of total imports. Fertilizers, mineral or chemical; containing nitrates and phosphates, mixed phosphorus and potassium (PK) fertilizers and fertilizers, mineral or chemical; containing the two fertilizing elements nitrogen and phosphorus, other than nitrates and phosphates lagged somewhat behind, together accounting for a further 14%.
Italy Mixed Fertilizer Imports by Country
Russia (2.5K tons), Belgium (1.7K tons) and Israel (1K tons) were the main suppliers of mixed fertilizer imports to Italy, together comprising 52% of total imports. Morocco, Germany, Tunisia, China, Spain and the Netherlands lagged somewhat behind, together comprising a further 41%.
From May 2022 to May 2023, the most notable rate of growth in terms of purchases, amongst the main suppliers, was attained by Tunisia (with a CAGR of +34.3%), while imports for the other leaders experienced more modest paces of growth.
In value terms, the largest mixed fertilizer suppliers to Italy were Israel ($1.9M), Russia ($1.7M) and Belgium ($1.3M), together accounting for 45% of total imports. These countries were followed by Germany, the Netherlands, China, Morocco, Spain and Tunisia, which together accounted for a further 44%.
In terms of the main suppliers, Tunisia, with a CAGR of +38.3%, saw the highest rates of growth with regard to the value of imports, over the period under review, while purchases for the other leaders experienced more modest paces of growth.
This report provides an in-depth analysis of the mixed fertilizer market in Italy. Within it, you will discover the latest data on market trends and opportunities by country, consumption, production and price developments, as well as the global trade (imports and exports). The forecast exhibits the market prospects through 2030.
Product coverage:
- Prodcom 20157130 -
- Prodcom 20157180 -
- Prodcom 20157200 - Diammonium hydrogenorthophosphate (diammonium phosphate) (excluding in tablets or similar forms or in packages of a weight of . .10 kg)
- Prodcom 20157300 - Ammonium dihydrogenorthophosphate (monoammonium phosphate)
- Prodcom 20157400 - Other mineral or chemical fertilisers containing the two fertilising elements nitrogen and phosphorus
- Prodcom 20157500 - Mineral or chemical fertilisers containing the two fertilising elements phosphorus and potassium
- Prodcom 20157100 - Mineral or chemical fertilisers containing the three fertilising elements nitrogen, phosphorus and potassium (excluding those in tablets or similar forms, or in packages with a gross weight of . .10 kg)
- Prodcom 20157200 - Diammonium hydrogenorthophosphate (diammonium phosphate) (excluding in tablets or similar forms or in packages of a weight of . .10 kg)
- Prodcom 20157300 - Ammonium dihydrogenorthophosphate (monoammonium phosphate)
- Prodcom 20157400 - Other mineral or chemical fertilisers containing the two fertilising elements nitrogen and phosphorus
- Prodcom 20157500 - Mineral or chemical fertilisers containing the two fertilising elements phosphorus and potassium
Country coverage:
- Italy
Data coverage:
- Market volume and value
- Per Capita consumption
- Forecast of the market dynamics in the medium term
- Trade (exports and imports) in Italy
- Export and import prices
- Market trends, drivers and restraints
- Key market players and their profiles
Reasons to buy this report:
- Take advantage of the latest data
- Find deeper insights into current market developments
- Discover vital success factors affecting the market
This report is designed for manufacturers, distributors, importers, and wholesalers, as well as for investors, consultants and advisors.
In this report, you can find information that helps you to make informed decisions on the following issues:
- How to diversify your business and benefit from new market opportunities
- How to load your idle production capacity
- How to boost your sales on overseas markets
- How to increase your profit margins
- How to make your supply chain more sustainable
- How to reduce your production and supply chain costs
- How to outsource production to other countries
- How to prepare your business for global expansion
While doing this research, we combine the accumulated expertise of our analysts and the capabilities of artificial intelligence. The AI-based platform, developed by our data scientists, constitutes the key working tool for business analysts, empowering them to discover deep insights and ideas from the marketing data.
-
1. INTRODUCTION
Making Data-Driven Decisions to Grow Your Business
- REPORT DESCRIPTION
- RESEARCH METHODOLOGY AND AI PLATFORM
- DATA-DRIVEN DECISIONS FOR YOUR BUSINESS
- GLOSSARY AND SPECIFIC TERMS
-
2. EXECUTIVE SUMMARY
A Quick Overview of Market Performance
- KEY FINDINGS
- MARKET TRENDS This Chapter is Available Only for the Professional Edition PRO
-
3. MARKET OVERVIEW
Understanding the Current State of The Market and Its Prospects
- MARKET SIZE
- MARKET STRUCTURE
- TRADE BALANCE
- PER CAPITA CONSUMPTION
- MARKET FORECAST TO 2030
-
4. MOST PROMISING PRODUCT
Finding New Products to Diversify Your Business
This Chapter is Available Only for the Professional Edition PRO- TOP PRODUCTS TO DIVERSIFY YOUR BUSINESS
- BEST-SELLING PRODUCTS
- MOST CONSUMED PRODUCT
- MOST TRADED PRODUCT
- MOST PROFITABLE PRODUCT FOR EXPORT
-
5. MOST PROMISING SUPPLYING COUNTRIES
Choosing the Best Countries to Establish Your Sustainable Supply Chain
This Chapter is Available Only for the Professional Edition PRO- TOP COUNTRIES TO SOURCE YOUR PRODUCT
- TOP PRODUCING COUNTRIES
- TOP EXPORTING COUNTRIES
- LOW-COST EXPORTING COUNTRIES
-
6. MOST PROMISING OVERSEAS MARKETS
Choosing the Best Countries to Boost Your Exports
This Chapter is Available Only for the Professional Edition PRO- TOP OVERSEAS MARKETS FOR EXPORTING YOUR PRODUCT
- TOP CONSUMING MARKETS
- UNSATURATED MARKETS
- TOP IMPORTING MARKETS
- MOST PROFITABLE MARKETS
7. PRODUCTION
The Latest Trends and Insights into The Industry
- PRODUCTION VOLUME AND VALUE
8. IMPORTS
The Largest Import Supplying Countries
- IMPORTS FROM 2012–2023
- IMPORTS BY COUNTRY
- IMPORT PRICES BY COUNTRY
9. EXPORTS
The Largest Destinations for Exports
- EXPORTS FROM 2012–2023
- EXPORTS BY COUNTRY
- EXPORT PRICES BY COUNTRY
-
10. PROFILES OF MAJOR PRODUCERS
The Largest Producers on The Market and Their Profiles
This Chapter is Available Only for the Professional Edition PRO -
LIST OF TABLES
- Key Findings In 2023
- Market Volume, In Physical Terms, 2012–2023
- Market Value, 2012–2023
- Per Capita Consumption In 2012-2023
- Imports, In Physical Terms, By Country, 2012–2023
- Imports, In Value Terms, By Country, 2012–2023
- Import Prices, By Country Of Origin, 2012–2023
- Exports, In Physical Terms, By Country, 2012–2023
- Exports, In Value Terms, By Country, 2012–2023
- Export Prices, By Country Of Destination, 2012–2023
-
LIST OF FIGURES
- Market Volume, In Physical Terms, 2012–2023
- Market Value, 2012–2023
- Market Structure – Domestic Supply vs. Imports, In Physical Terms, 2012-2023
- Market Structure – Domestic Supply vs. Imports, In Value Terms, 2012-2023
- Trade Balance, In Physical Terms, 2012-2023
- Trade Balance, In Value Terms, 2012-2023
- Per Capita Consumption, 2012-2023
- Market Volume Forecast to 2030
- Market Value Forecast to 2030
- Products: Market Size And Growth, By Type
- Products: Average Per Capita Consumption, By Type
- Products: Exports And Growth, By Type
- Products: Export Prices And Growth, By Type
- Production Volume And Growth
- Exports And Growth
- Export Prices And Growth
- Market Size And Growth
- Per Capita Consumption
- Imports And Growth
- Import Prices
- Production, In Physical Terms, 2012–2023
- Production, In Value Terms, 2012–2023
- Imports, In Physical Terms, 2012–2023
- Imports, In Value Terms, 2012–2023
- Imports, In Physical Terms, By Country, 2023
- Imports, In Physical Terms, By Country, 2012–2023
- Imports, In Value Terms, By Country, 2012–2023
- Import Prices, By Country Of Origin, 2012–2023
- Exports, In Physical Terms, 2012–2023
- Exports, In Value Terms, 2012–2023
- Exports, In Physical Terms, By Country, 2023
- Exports, In Physical Terms, By Country, 2012–2023
- Exports, In Value Terms, By Country, 2012–2023
- Export Prices, By Country Of Destination, 2012–2023


