India - Polycarboxylic Acids - Market Analysis, Forecast, Size, Trends and Insights
Get instant access to more than 2 million reports, dashboards, and datasets on the IndexBox Platform.
View PricingAverage Price of Polycarboxylic Acid in India Is $937 per Ton
India Polycarboxylic Acid Import Price in June 2023
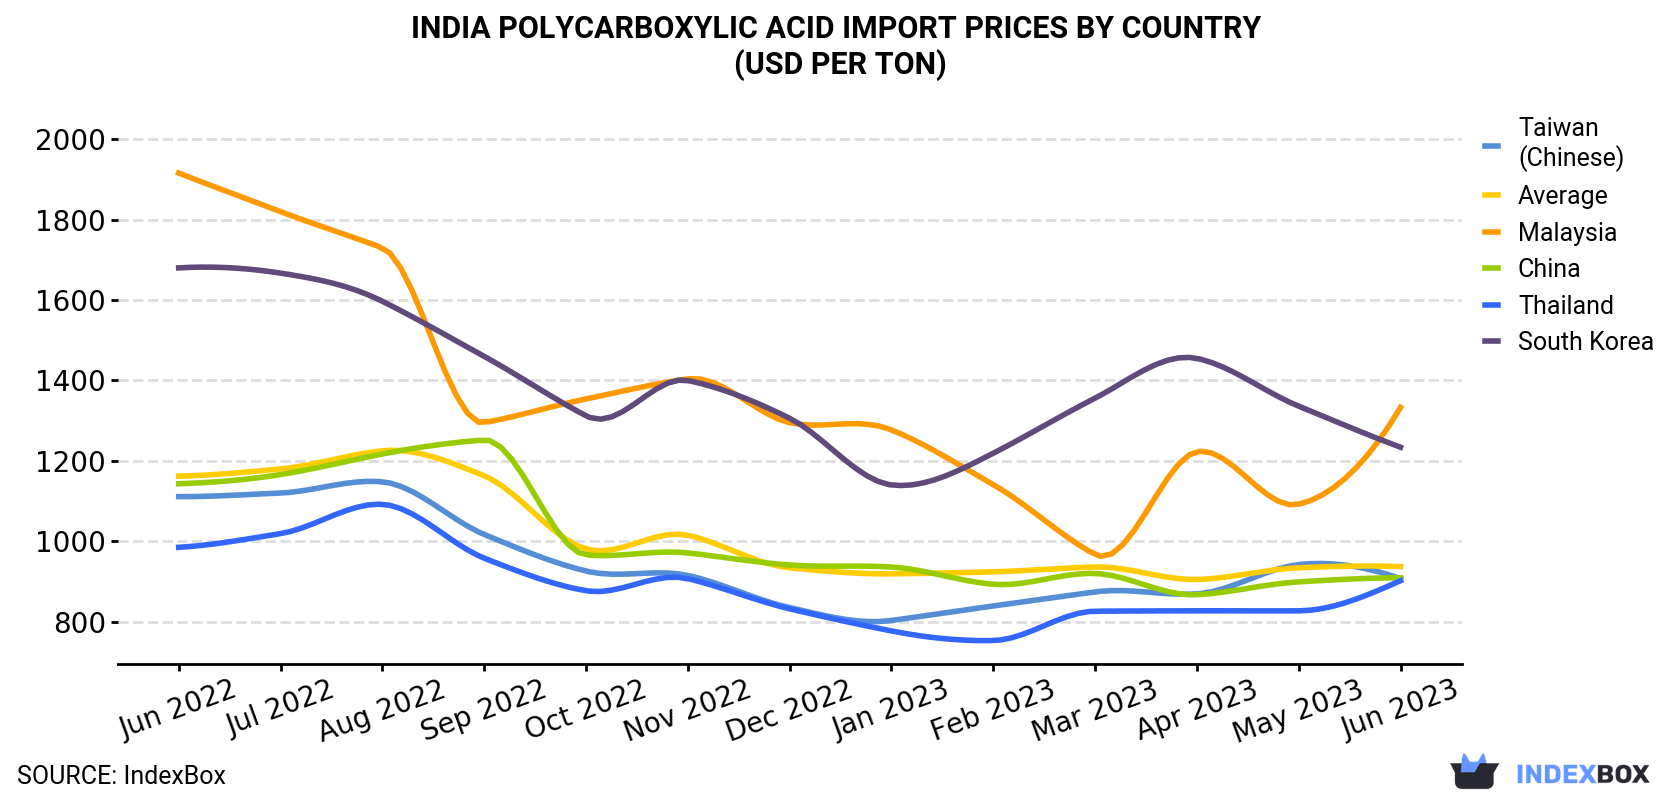
In June 2023, the polycarboxylic acid price amounted to $937 per ton (CIF, India), approximately mirroring the previous month. In general, the import price, however, saw a slight slump. The growth pace was the most rapid in August 2022 when the average import price increased by 3.8% against the previous month. As a result, import price attained the peak level of $1,225 per ton. From September 2022 to June 2023, the average import prices failed to regain momentum.
Average prices varied somewhat amongst the major supplying countries. In June 2023, the countries with the highest prices were Malaysia ($1,333 per ton) and South Korea ($1,234 per ton), while the price for Thailand ($902 per ton) and Taiwan (Chinese) ($907 per ton) were amongst the lowest.
From June 2022 to June 2023, the most notable rate of growth in terms of prices was attained by Thailand (-0.7%), while the prices for the other major suppliers experienced a decline.
| COUNTRY | Import Price of Polycarboxylic Acid in India (USD per ton) | ||||||||||||
|---|---|---|---|---|---|---|---|---|---|---|---|---|---|
| Jun 2022 | Jul 2022 | Aug 2022 | Sep 2022 | Oct 2022 | Nov 2022 | Dec 2022 | Jan 2023 | Feb 2023 | Mar 2023 | Apr 2023 | May 2023 | Jun 2023 | |
| Malaysia | 1,916 | 1,820 | 1,730 | 1,295 | 1,354 | 1,404 | 1,295 | 1,277 | 1,141 | 967 | 1,223 | 1,092 | 1,333 |
| South Korea | 1,680 | 1,667 | 1,597 | 1,460 | 1,312 | 1,400 | 1,306 | 1,140 | 1,219 | 1,356 | 1,455 | 1,336 | 1,234 |
| China | 1,143 | 1,166 | 1,217 | 1,252 | 966 | 971 | 941 | 936 | 893 | 920 | 867 | 899 | 909 |
| Taiwan (Chinese) | 1,111 | 1,120 | 1,148 | 1,017 | 926 | 915 | 835 | 803 | 839 | 874 | 869 | 942 | 907 |
| Thailand | 985 | 1,019 | 1,092 | 958 | 877 | 907 | 832 | 777 | 753 | 826 | 827 | 827 | 902 |
| Average | 1,162 | 1,180 | 1,225 | 1,163 | 981 | 1,015 | 934 | 919 | 924 | 936 | 905 | 934 | 937 |
India Polycarboxylic Acid Imports
After two months of decline, overseas purchases of polycarboxylic acids increased by 12% to 213K tons in June 2023. In general, imports continue to indicate a relatively flat trend pattern. The most prominent rate of growth was recorded in March 2023 when imports increased by 62% against the previous month. As a result, imports attained the peak of 221K tons. From April 2023 to June 2023, the growth of imports remained at a somewhat lower figure.
In value terms, polycarboxylic acid imports rose rapidly to $200M (IndexBox estimates) in June 2023. Over the period under review, imports, however, showed a slight curtailment. The growth pace was the most rapid in March 2023 with an increase of 65% m-o-m.
India Polycarboxylic Acid Imports by Country
In June 2023, China (146K tons) constituted the largest supplier of polycarboxylic acid to India, accounting for a 69% share of total imports. Moreover, polycarboxylic acid imports from China exceeded the figures recorded by the second-largest supplier, Taiwan (Chinese) (34K tons), fourfold. The third position in this ranking was taken by Thailand (11K tons), with a 5.4% share.
From June 2022 to June 2023, the average monthly rate of growth in terms of volume from China stood at +2.2%. The remaining supplying countries recorded the following average monthly rates of imports growth: Taiwan (Chinese) (-0.2% per month) and Thailand (-9.3% per month).
In value terms, China ($133M) constituted the largest supplier of polycarboxylic acid to India, comprising 67% of total imports. The second position in the ranking was held by Taiwan (Chinese) ($31M), with a 15% share of total imports. It was followed by Thailand, with a 5.2% share.
From June 2022 to June 2023, the average monthly growth rate of value from China was relatively modest. The remaining supplying countries recorded the following average monthly rates of imports growth: Taiwan (Chinese) (-1.9% per month) and Thailand (-9.9% per month).
This report provides an in-depth analysis of the polycarboxylic acid market in India. Within it, you will discover the latest data on market trends and opportunities by country, consumption, production and price developments, as well as the global trade (imports and exports). The forecast exhibits the market prospects through 2030.
Product coverage:
- Prodcom 20143383 - Oxalic, azelaic, malonic, other, cyclanic, cylenic or cycloterpenic polycarboxylic acids, salts
- Prodcom 20143385 - Adipic acid, its salts and esters
- Prodcom 20143387 - Maleic anhydride
- Prodcom 20143410 - Dibutyl and dioctyl orthophthalates
- Prodcom 20143420 - Other esters of orthophthalic acid
- Prodcom 20143430 - Phthalic anhydride, terephthalic acid and its salts
- Prodcom 20143440 - Aromatic polycarboxylic acids, their anhydrides, halides, p eroxides, peroxyacids and their halogenated, sulphonated, n itrated or nitrosated derivatives (excluding esters of orthophthalic acid, phthalic anhydride, terephthalic acid and
Country coverage:
- India
Data coverage:
- Market volume and value
- Per Capita consumption
- Forecast of the market dynamics in the medium term
- Trade (exports and imports) in India
- Export and import prices
- Market trends, drivers and restraints
- Key market players and their profiles
Reasons to buy this report:
- Take advantage of the latest data
- Find deeper insights into current market developments
- Discover vital success factors affecting the market
This report is designed for manufacturers, distributors, importers, and wholesalers, as well as for investors, consultants and advisors.
In this report, you can find information that helps you to make informed decisions on the following issues:
- How to diversify your business and benefit from new market opportunities
- How to load your idle production capacity
- How to boost your sales on overseas markets
- How to increase your profit margins
- How to make your supply chain more sustainable
- How to reduce your production and supply chain costs
- How to outsource production to other countries
- How to prepare your business for global expansion
While doing this research, we combine the accumulated expertise of our analysts and the capabilities of artificial intelligence. The AI-based platform, developed by our data scientists, constitutes the key working tool for business analysts, empowering them to discover deep insights and ideas from the marketing data.
-
1. INTRODUCTION
Making Data-Driven Decisions to Grow Your Business
- REPORT DESCRIPTION
- RESEARCH METHODOLOGY AND AI PLATFORM
- DATA-DRIVEN DECISIONS FOR YOUR BUSINESS
- GLOSSARY AND SPECIFIC TERMS
-
2. EXECUTIVE SUMMARY
A Quick Overview of Market Performance
- KEY FINDINGS
- MARKET TRENDS This Chapter is Available Only for the Professional Edition PRO
-
3. MARKET OVERVIEW
Understanding the Current State of The Market and Its Prospects
- MARKET SIZE
- MARKET STRUCTURE
- TRADE BALANCE
- PER CAPITA CONSUMPTION
- MARKET FORECAST TO 2030
-
4. MOST PROMISING PRODUCT
Finding New Products to Diversify Your Business
This Chapter is Available Only for the Professional Edition PRO- TOP PRODUCTS TO DIVERSIFY YOUR BUSINESS
- BEST-SELLING PRODUCTS
- MOST CONSUMED PRODUCT
- MOST TRADED PRODUCT
- MOST PROFITABLE PRODUCT FOR EXPORT
-
5. MOST PROMISING SUPPLYING COUNTRIES
Choosing the Best Countries to Establish Your Sustainable Supply Chain
This Chapter is Available Only for the Professional Edition PRO- TOP COUNTRIES TO SOURCE YOUR PRODUCT
- TOP PRODUCING COUNTRIES
- TOP EXPORTING COUNTRIES
- LOW-COST EXPORTING COUNTRIES
-
6. MOST PROMISING OVERSEAS MARKETS
Choosing the Best Countries to Boost Your Exports
This Chapter is Available Only for the Professional Edition PRO- TOP OVERSEAS MARKETS FOR EXPORTING YOUR PRODUCT
- TOP CONSUMING MARKETS
- UNSATURATED MARKETS
- TOP IMPORTING MARKETS
- MOST PROFITABLE MARKETS
7. PRODUCTION
The Latest Trends and Insights into The Industry
- PRODUCTION VOLUME AND VALUE
8. IMPORTS
The Largest Import Supplying Countries
- IMPORTS FROM 2012–2023
- IMPORTS BY COUNTRY
- IMPORT PRICES BY COUNTRY
9. EXPORTS
The Largest Destinations for Exports
- EXPORTS FROM 2012–2023
- EXPORTS BY COUNTRY
- EXPORT PRICES BY COUNTRY
-
10. PROFILES OF MAJOR PRODUCERS
The Largest Producers on The Market and Their Profiles
This Chapter is Available Only for the Professional Edition PRO -
LIST OF TABLES
- Key Findings In 2023
- Market Volume, In Physical Terms, 2012–2023
- Market Value, 2012–2023
- Per Capita Consumption In 2012-2023
- Imports, In Physical Terms, By Country, 2012–2023
- Imports, In Value Terms, By Country, 2012–2023
- Import Prices, By Country Of Origin, 2012–2023
- Exports, In Physical Terms, By Country, 2012–2023
- Exports, In Value Terms, By Country, 2012–2023
- Export Prices, By Country Of Destination, 2012–2023
-
LIST OF FIGURES
- Market Volume, In Physical Terms, 2012–2023
- Market Value, 2012–2023
- Market Structure – Domestic Supply vs. Imports, In Physical Terms, 2012-2023
- Market Structure – Domestic Supply vs. Imports, In Value Terms, 2012-2023
- Trade Balance, In Physical Terms, 2012-2023
- Trade Balance, In Value Terms, 2012-2023
- Per Capita Consumption, 2012-2023
- Market Volume Forecast to 2030
- Market Value Forecast to 2030
- Products: Market Size And Growth, By Type
- Products: Average Per Capita Consumption, By Type
- Products: Exports And Growth, By Type
- Products: Export Prices And Growth, By Type
- Production Volume And Growth
- Exports And Growth
- Export Prices And Growth
- Market Size And Growth
- Per Capita Consumption
- Imports And Growth
- Import Prices
- Production, In Physical Terms, 2012–2023
- Production, In Value Terms, 2012–2023
- Imports, In Physical Terms, 2012–2023
- Imports, In Value Terms, 2012–2023
- Imports, In Physical Terms, By Country, 2023
- Imports, In Physical Terms, By Country, 2012–2023
- Imports, In Value Terms, By Country, 2012–2023
- Import Prices, By Country Of Origin, 2012–2023
- Exports, In Physical Terms, 2012–2023
- Exports, In Value Terms, 2012–2023
- Exports, In Physical Terms, By Country, 2023
- Exports, In Physical Terms, By Country, 2012–2023
- Exports, In Value Terms, By Country, 2012–2023
- Export Prices, By Country Of Destination, 2012–2023


