
Hong Kong SAR, China - Hot-Rolled Steel Bars and Rods - Market Analysis, Forecast, Size, Trends and Insights
Get instant access to more than 2 million reports, dashboards, and datasets on the IndexBox Platform.
View PricingImport of Hot-Rolled Steel Bar and Rod in Hong Kongs Soars 15% to $88M in September 2023
Hong Kong Hot-Rolled Steel Bar and Rod Imports
In September 2023, overseas purchases of hot-rolled steel bars and rods were finally on the rise to reach 144K tons after two months of decline. Overall, imports, however, showed a relatively flat trend pattern. The most prominent rate of growth was recorded in January 2023 with an increase of 70% against the previous month.
In value terms, hot-rolled steel bar and rod imports rose significantly to $88M (IndexBox estimates) in September 2023. In general, imports, however, recorded a mild decline. The pace of growth was the most pronounced in January 2023 with an increase of 60% against the previous month.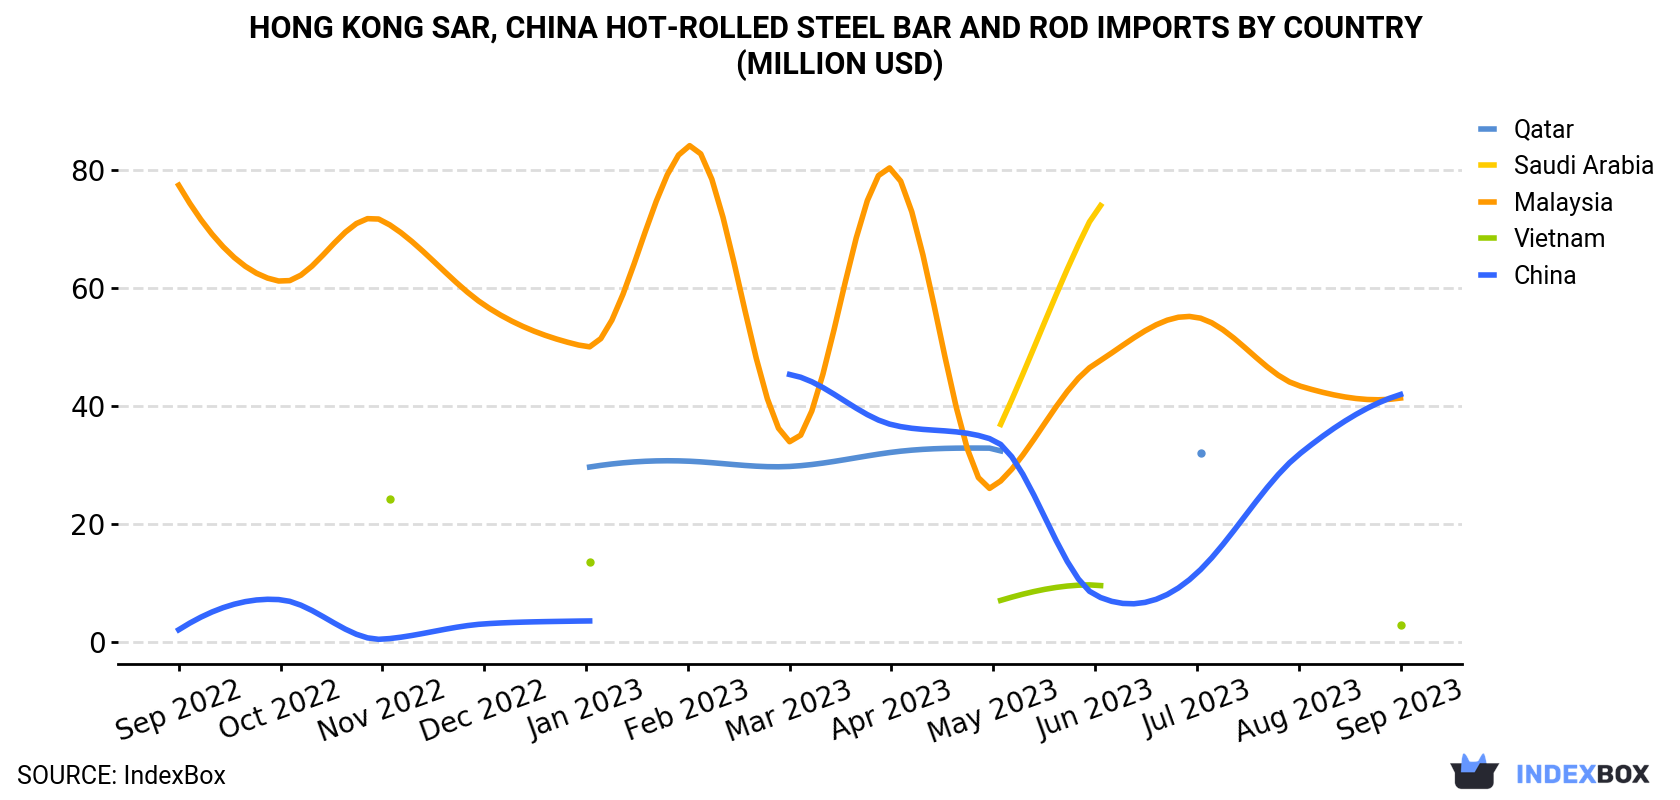
| COUNTRY | Import Value of Hot-Rolled Steel Bar and Rod in Hong Kong (million USD) | ||||||||||||
|---|---|---|---|---|---|---|---|---|---|---|---|---|---|
| Sep 2022 | Oct 2022 | Nov 2022 | Dec 2022 | Jan 2023 | Feb 2023 | Mar 2023 | Apr 2023 | May 2023 | Jun 2023 | Jul 2023 | Aug 2023 | Sep 2023 | |
| China | 2.1 | 7.2 | 0.5 | 3.1 | 3.6 | < 0.1 | 45.4 | 36.9 | 34.3 | 8.0 | 11.7 | 31.8 | 42.0 |
| Malaysia | 77.5 | 61.2 | 71.5 | 57.2 | 50.1 | 84.1 | 34.0 | 80.3 | 26.3 | 47.2 | 55.1 | 43.5 | 41.4 |
| Vietnam | 21.6 | N/A | 24.3 | N/A | 13.6 | N/A | N/A | N/A | 6.7 | 9.7 | N/A | N/A | 2.9 |
| Qatar | N/A | N/A | N/A | N/A | 29.6 | 30.7 | 29.8 | 32.2 | 32.9 | N/A | 32.0 | N/A | N/A |
| Saudi Arabia | N/A | N/A | N/A | N/A | N/A | N/A | N/A | N/A | 34.3 | 73.1 | N/A | N/A | N/A |
| Others | 0.6 | 33.7 | 1.5 | 0.8 | 0.6 | 0.7 | 1.9 | 1.0 | 2.0 | 0.4 | 1.0 | 0.9 | 1.3 |
| Total | 102 | 102 | 97.8 | 61.1 | 97.5 | 116 | 111 | 150 | 137 | 138 | 99.7 | 76.2 | 87.6 |
Imports by Country
China (71K tons), Malaysia (67K tons) and Vietnam (5.2K tons) were the main suppliers of hot-rolled steel bar and rod imports to Hong Kong, together accounting for 99% of total imports.
From September 2022 to September 2023, the biggest increases were in China (with a CAGR of +31.3%), while purchases for the other leaders experienced a decline.
In value terms, the largest hot-rolled steel bar and rod suppliers to Hong Kong were China ($42M), Malaysia ($41M) and Vietnam ($2.9M), with a combined 99% share of total imports.
Among the main suppliers, China, with a CAGR of +28.4%, recorded the highest rates of growth with regard to the value of imports, over the period under review, while purchases for the other leaders experienced a decline.
Imports by Type
In September 2023, iron or non-alloy steel; bars and rods, not further worked than forged, hot-rolled, hot drawn or hot-extruded, but including those twisted after rolling (139K tons) was the main type of hot-rolled steel bar and rod supplied to Hong Kong, accounting for a 97% share of total imports. It was followed by iron or non-alloy steel; bars and rods, hot-rolled, in irregularly wound coils (4.3K tons), with a 3% share of total imports. Hot-rolled bars in bearing steels (10 tons) ranked third in terms of total imports with less than 0.1% share.
From September 2022 to September 2023, the average monthly rate of growth in terms of the volume of import of iron or non-alloy steel; bars and rods, not further worked than forged, hot-rolled, hot drawn or hot-extruded, but including those twisted after rolling was relatively modest. With regard to the other supplied products, the following average monthly rates of growth were recorded: iron or non-alloy steel; bars and rods, hot-rolled, in irregularly wound coils (+4.2% per month) and hot-rolled bars in bearing steels (-11.6% per month).
In value terms, iron or non-alloy steel; bars and rods, not further worked than forged, hot-rolled, hot drawn or hot-extruded, but including those twisted after rolling ($85M) constituted the largest type of hot-rolled steel bar and rod supplied to Hong Kong, comprising 97% of total imports. The second position in the ranking was held by iron or non-alloy steel; bars and rods, hot-rolled, in irregularly wound coils ($2.7M), with a 3.1% share of total imports. It was followed by hot-rolled bars in bearing steels, with a 0.3% share.
Import Prices by Country
In September 2023, the hot-rolled steel bar and rod price stood at $609 per ton (CIF, Hong Kong), remaining relatively unchanged against the previous month. In general, the import price continues to indicate a mild descent. The most prominent rate of growth was recorded in April 2023 when the average import price increased by 2.8% month-to-month. The import price peaked at $692 per ton in November 2022; however, from December 2022 to September 2023, import prices remained at a lower figure.
Average prices varied noticeably amongst the major supplying countries. In September 2023, the country with the highest price was Malaysia ($621 per ton), while the price for Vietnam ($562 per ton) was amongst the lowest.
From September 2022 to September 2023, the most notable rate of growth in terms of prices was attained by Saudi Arabia (+11.3%), while the prices for the other major suppliers experienced mixed trend patterns.
This report provides an in-depth analysis of the market for hot-rolled steel bar and rod in Hong Kong SAR, China. Within it, you will discover the latest data on market trends and opportunities by country, consumption, production and price developments, as well as the global trade (imports and exports). The forecast exhibits the market prospects through 2030.
Product coverage:
- Prodcom 24106110 - Ribbed or other deformed wire rod (of non-alloy steel)
- Prodcom 24106120 - Wire rod of free-cutting steel
- Prodcom 24106130 - Wire rod used for concrete reinforcing (mesh/cold ribbed bars)
- Prodcom 24106140 - Wire rod for tyre cord
- Prodcom 24106190 - Other wire rod (of non-alloy steel)
- Prodcom 24106210 - Hot-rolled concrete reinforcing bars
- Prodcom 24106230 - Hot-rolled bars in free-cutting steels
- Prodcom 24106250 - Forged bars of steel and hot-rolled bars (excluding hollow drill bars and rods) of non-alloy steel (of other than of free-cutting steel)
- Prodcom 24106300 - Hot-rolled wire rod in coil, of stainless steel
- Prodcom 24106410 - Hot-rolled round bars, of stainless steel
- Prodcom 24106430 - Bars and rods of stainless steel, only hot-rolled, only hotdrawn or only extruded (excluding of circular cross-section)
- Prodcom 24106510 - Bars and rods of high-speed steel, hot-rolled, in irregularly wound coils
- Prodcom 24106530 - Bars and rods of silico-manganese steel, hot-rolled, in irregularly wound coils
- Prodcom 24106550 - Hot-rolled wire rod, of bearing steel
- Prodcom 24106570 - Bars and rods of alloy steel other than stainless, hot-rolled, in irregularly wound coils (excluding products of bearing steel, h igh-speed steel or silico-manganese steel)
- Prodcom 24106630 - Hot-rolled bars in bearing steels
- Prodcom 24106640 - Hot-rolled bars in tool steels
- Prodcom 24106650 - Hot-rolled bars (excluding hollow drill bars and rods) of alloy steel (other than of stainless, tool, silico-manganese, bearing and high speed steel)
Country coverage:
- Hong Kong SAR
Data coverage:
- Market volume and value
- Per Capita consumption
- Forecast of the market dynamics in the medium term
- Trade (exports and imports) in Hong Kong SAR, China
- Export and import prices
- Market trends, drivers and restraints
- Key market players and their profiles
Reasons to buy this report:
- Take advantage of the latest data
- Find deeper insights into current market developments
- Discover vital success factors affecting the market
This report is designed for manufacturers, distributors, importers, and wholesalers, as well as for investors, consultants and advisors.
In this report, you can find information that helps you to make informed decisions on the following issues:
- How to diversify your business and benefit from new market opportunities
- How to load your idle production capacity
- How to boost your sales on overseas markets
- How to increase your profit margins
- How to make your supply chain more sustainable
- How to reduce your production and supply chain costs
- How to outsource production to other countries
- How to prepare your business for global expansion
While doing this research, we combine the accumulated expertise of our analysts and the capabilities of artificial intelligence. The AI-based platform, developed by our data scientists, constitutes the key working tool for business analysts, empowering them to discover deep insights and ideas from the marketing data.
-
1. INTRODUCTION
Making Data-Driven Decisions to Grow Your Business
- REPORT DESCRIPTION
- RESEARCH METHODOLOGY AND AI PLATFORM
- DATA-DRIVEN DECISIONS FOR YOUR BUSINESS
- GLOSSARY AND SPECIFIC TERMS
-
2. EXECUTIVE SUMMARY
A Quick Overview of Market Performance
- KEY FINDINGS
- MARKET TRENDS This Chapter is Available Only for the Professional Edition PRO
-
3. MARKET OVERVIEW
Understanding the Current State of The Market and Its Prospects
- MARKET SIZE
- MARKET STRUCTURE
- TRADE BALANCE
- PER CAPITA CONSUMPTION
- MARKET FORECAST TO 2030
-
4. MOST PROMISING PRODUCT
Finding New Products to Diversify Your Business
This Chapter is Available Only for the Professional Edition PRO- TOP PRODUCTS TO DIVERSIFY YOUR BUSINESS
- BEST-SELLING PRODUCTS
- MOST CONSUMED PRODUCT
- MOST TRADED PRODUCT
- MOST PROFITABLE PRODUCT FOR EXPORT
-
5. MOST PROMISING SUPPLYING COUNTRIES
Choosing the Best Countries to Establish Your Sustainable Supply Chain
This Chapter is Available Only for the Professional Edition PRO- TOP COUNTRIES TO SOURCE YOUR PRODUCT
- TOP PRODUCING COUNTRIES
- TOP EXPORTING COUNTRIES
- LOW-COST EXPORTING COUNTRIES
-
6. MOST PROMISING OVERSEAS MARKETS
Choosing the Best Countries to Boost Your Exports
This Chapter is Available Only for the Professional Edition PRO- TOP OVERSEAS MARKETS FOR EXPORTING YOUR PRODUCT
- TOP CONSUMING MARKETS
- UNSATURATED MARKETS
- TOP IMPORTING MARKETS
- MOST PROFITABLE MARKETS
7. PRODUCTION
The Latest Trends and Insights into The Industry
- PRODUCTION VOLUME AND VALUE
8. IMPORTS
The Largest Import Supplying Countries
- IMPORTS FROM 2012–2023
- IMPORTS BY COUNTRY
- IMPORT PRICES BY COUNTRY
9. EXPORTS
The Largest Destinations for Exports
- EXPORTS FROM 2012–2023
- EXPORTS BY COUNTRY
- EXPORT PRICES BY COUNTRY
-
10. PROFILES OF MAJOR PRODUCERS
The Largest Producers on The Market and Their Profiles
This Chapter is Available Only for the Professional Edition PRO -
LIST OF TABLES
- Key Findings In 2023
- Market Volume, In Physical Terms, 2012–2023
- Market Value, 2012–2023
- Per Capita Consumption In 2012-2023
- Imports, In Physical Terms, By Country, 2012–2023
- Imports, In Value Terms, By Country, 2012–2023
- Import Prices, By Country Of Origin, 2012–2023
- Exports, In Physical Terms, By Country, 2012–2023
- Exports, In Value Terms, By Country, 2012–2023
- Export Prices, By Country Of Destination, 2012–2023
-
LIST OF FIGURES
- Market Volume, In Physical Terms, 2012–2023
- Market Value, 2012–2023
- Market Structure – Domestic Supply vs. Imports, In Physical Terms, 2012-2023
- Market Structure – Domestic Supply vs. Imports, In Value Terms, 2012-2023
- Trade Balance, In Physical Terms, 2012-2023
- Trade Balance, In Value Terms, 2012-2023
- Per Capita Consumption, 2012-2023
- Market Volume Forecast to 2030
- Market Value Forecast to 2030
- Products: Market Size And Growth, By Type
- Products: Average Per Capita Consumption, By Type
- Products: Exports And Growth, By Type
- Products: Export Prices And Growth, By Type
- Production Volume And Growth
- Exports And Growth
- Export Prices And Growth
- Market Size And Growth
- Per Capita Consumption
- Imports And Growth
- Import Prices
- Production, In Physical Terms, 2012–2023
- Production, In Value Terms, 2012–2023
- Imports, In Physical Terms, 2012–2023
- Imports, In Value Terms, 2012–2023
- Imports, In Physical Terms, By Country, 2023
- Imports, In Physical Terms, By Country, 2012–2023
- Imports, In Value Terms, By Country, 2012–2023
- Import Prices, By Country Of Origin, 2012–2023
- Exports, In Physical Terms, 2012–2023
- Exports, In Value Terms, 2012–2023
- Exports, In Physical Terms, By Country, 2023
- Exports, In Physical Terms, By Country, 2012–2023
- Exports, In Value Terms, By Country, 2012–2023
- Export Prices, By Country Of Destination, 2012–2023


