
France - Chocolate And Other Food Preparations Containing Cocoa - Market Analysis, Forecast, Size, Trends And Insights
Get instant access to more than 2 million reports, dashboards, and datasets on the IndexBox Platform.
View PricingFrances Import of Chocolate Reaches $772M in 2023
France Chocolate Imports
In 2023, after two years of growth, there was decline in purchases abroad of chocolate and other food preparations containing cocoa, when their volume decreased by -0.3% to 204K tons. The total import volume increased at an average annual rate of +3.3% from 2013 to 2023; however, the trend pattern indicated some noticeable fluctuations being recorded throughout the analyzed period. The growth pace was the most rapid in 2021 with an increase of 19% against the previous year. Over the period under review, imports hit record highs at 204K tons in 2022, and then fell modestly in the following year.
In value terms, chocolate imports surged to $772M (IndexBox estimates) in 2023. Overall, total imports indicated a buoyant expansion from 2013 to 2023: its value increased at an average annual rate of +5.3% over the last decade. The trend pattern, however, indicated some noticeable fluctuations being recorded throughout the analyzed period. Based on 2023 figures, imports increased by +42.1% against 2016 indices. As a result, imports reached the peak and are likely to continue growth in the immediate term.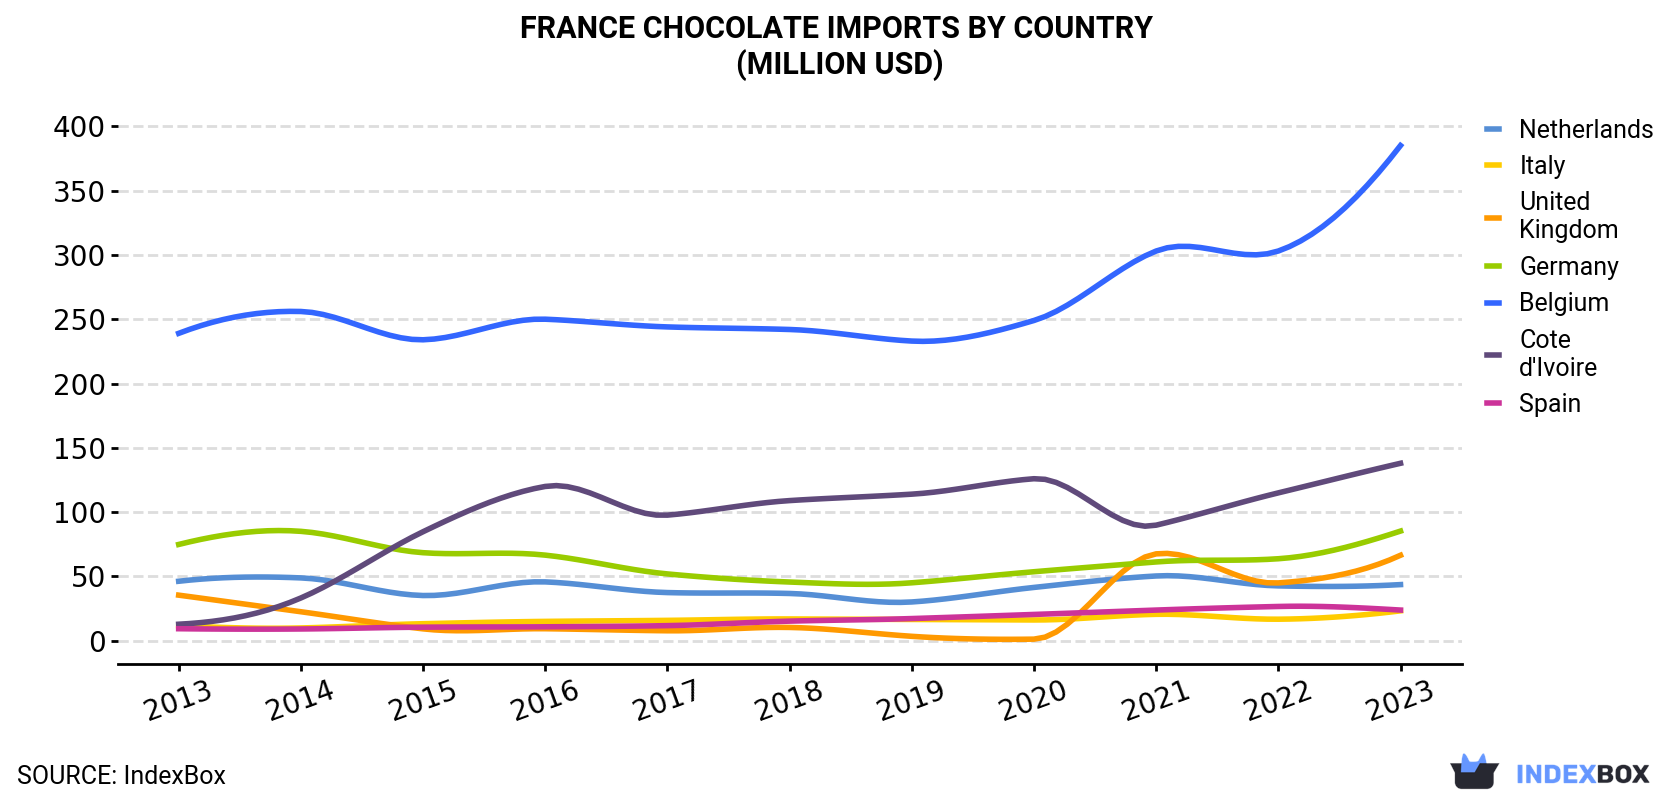
| COUNTRY | Import Value of Chocolate in France (million USD) | ||||||||||
|---|---|---|---|---|---|---|---|---|---|---|---|
| 2013 | 2014 | 2015 | 2016 | 2017 | 2018 | 2019 | 2020 | 2021 | 2022 | 2023 | |
| Belgium | 239 | 256 | 234 | 250 | 244 | 242 | 233 | 249 | 303 | 303 | 385 |
| Cote d'Ivoire | 12.9 | 33.3 | 84.8 | 120 | 97.7 | 109 | 114 | 126 | 89.9 | 115 | 138 |
| Germany | 74.9 | 85.1 | 68.5 | 66.6 | 52.0 | 45.7 | 45.1 | 53.7 | 61.3 | 63.8 | 85.3 |
| United Kingdom | 35.5 | 22.6 | 9.3 | 9.4 | 7.8 | 10.4 | 3.5 | 1.3 | 67.6 | 45.0 | 66.5 |
| Netherlands | 46.3 | 48.9 | 35.2 | 45.8 | 37.5 | 36.8 | 30.2 | 41.5 | 50.4 | 42.7 | 43.7 |
| Spain | 9.4 | 9.2 | 10.6 | 10.9 | 11.8 | 15.3 | 17.3 | 20.5 | 23.9 | 26.7 | 23.9 |
| Italy | 11.7 | 10.0 | 13.3 | 15.1 | 15.9 | 17.0 | 16.6 | 16.2 | 20.6 | 16.8 | 23.3 |
| Others | 31.2 | 23.0 | 25.8 | 25.9 | 22.6 | 27.5 | 31.5 | 8.7 | 6.6 | 6.5 | 6.1 |
| Total | 461 | 488 | 481 | 544 | 489 | 503 | 491 | 517 | 624 | 619 | 772 |
Imports by Country
In 2023, Belgium (101K tons) constituted the largest supplier of chocolate to France, accounting for a 49% share of total imports. Moreover, chocolate imports from Belgium exceeded the figures recorded by the second-largest supplier, Cote d'Ivoire (36K tons), threefold. The third position in this ranking was taken by Germany (22K tons), with an 11% share.
From 2013 to 2023, the average annual rate of growth in terms of volume from Belgium stood at +2.7%. The remaining supplying countries recorded the following average annual rates of imports growth: Cote d'Ivoire (+25.3% per year) and Germany (-1.5% per year).
In value terms, Belgium ($385M) constituted the largest supplier of chocolate and other food preparations containing cocoa to France, comprising 50% of total imports. The second position in the ranking was held by Cote d'Ivoire ($138M), with an 18% share of total imports. It was followed by Germany, with an 11% share.
From 2013 to 2023, the average annual growth rate of value from Belgium amounted to +4.9%. The remaining supplying countries recorded the following average annual rates of imports growth: Cote d'Ivoire (+26.8% per year) and Germany (+1.3% per year).
Import Prices by Country
In 2023, the chocolate price stood at $3,790 per ton (CIF, France), surging by 25% against the previous year. Over the last decade, it increased at an average annual rate of +1.9%. As a result, import price reached the peak level and is likely to continue growth in the immediate term.
Average prices varied somewhat amongst the major supplying countries. In 2023, amid the top importers, the highest price was recorded for prices from Italy ($4,302 per ton) and Germany ($3,960 per ton), while the price for the Netherlands ($3,354 per ton) and Spain ($3,566 per ton) were amongst the lowest.
From 2013 to 2023, the most notable rate of growth in terms of prices was attained by Germany (+2.8%), while the prices for the other major suppliers experienced more modest paces of growth.
This report provides an in-depth analysis of the chocolate market in France. Within it, you will discover the latest data on market trends and opportunities by country, consumption, production and price developments, as well as the global trade (imports and exports). The forecast exhibits the market prospects through 2030.
Product coverage:
- Prodcom 10822130 - Chocolate and other food preparations containing cocoa, in blocks, slabs or bars > 2 kg or in liquid, paste, powder, g ranular or other bulk form, in containers or immediate packings of a content > 2 kg, containing . .18 % by weight of
Country coverage:
- France
Data coverage:
- Market volume and value
- Per Capita consumption
- Forecast of the market dynamics in the medium term
- Trade (exports and imports) in France
- Export and import prices
- Market trends, drivers and restraints
- Key market players and their profiles
Reasons to buy this report:
- Take advantage of the latest data
- Find deeper insights into current market developments
- Discover vital success factors affecting the market
This report is designed for manufacturers, distributors, importers, and wholesalers, as well as for investors, consultants and advisors.
In this report, you can find information that helps you to make informed decisions on the following issues:
- How to diversify your business and benefit from new market opportunities
- How to load your idle production capacity
- How to boost your sales on overseas markets
- How to increase your profit margins
- How to make your supply chain more sustainable
- How to reduce your production and supply chain costs
- How to outsource production to other countries
- How to prepare your business for global expansion
While doing this research, we combine the accumulated expertise of our analysts and the capabilities of artificial intelligence. The AI-based platform, developed by our data scientists, constitutes the key working tool for business analysts, empowering them to discover deep insights and ideas from the marketing data.
-
1. INTRODUCTION
Making Data-Driven Decisions to Grow Your Business
- REPORT DESCRIPTION
- RESEARCH METHODOLOGY AND AI PLATFORM
- DATA-DRIVEN DECISIONS FOR YOUR BUSINESS
- GLOSSARY AND SPECIFIC TERMS
-
2. EXECUTIVE SUMMARY
A Quick Overview of Market Performance
- KEY FINDINGS
- MARKET TRENDS This Chapter is Available Only for the Professional Edition PRO
-
3. MARKET OVERVIEW
Understanding the Current State of The Market and Its Prospects
- MARKET SIZE
- MARKET STRUCTURE
- TRADE BALANCE
- PER CAPITA CONSUMPTION
- MARKET FORECAST TO 2030
-
4. MOST PROMISING PRODUCT
Finding New Products to Diversify Your Business
This Chapter is Available Only for the Professional Edition PRO- TOP PRODUCTS TO DIVERSIFY YOUR BUSINESS
- BEST-SELLING PRODUCTS
- MOST CONSUMED PRODUCT
- MOST TRADED PRODUCT
- MOST PROFITABLE PRODUCT FOR EXPORT
-
5. MOST PROMISING SUPPLYING COUNTRIES
Choosing the Best Countries to Establish Your Sustainable Supply Chain
This Chapter is Available Only for the Professional Edition PRO- TOP COUNTRIES TO SOURCE YOUR PRODUCT
- TOP PRODUCING COUNTRIES
- TOP EXPORTING COUNTRIES
- LOW-COST EXPORTING COUNTRIES
-
6. MOST PROMISING OVERSEAS MARKETS
Choosing the Best Countries to Boost Your Exports
This Chapter is Available Only for the Professional Edition PRO- TOP OVERSEAS MARKETS FOR EXPORTING YOUR PRODUCT
- TOP CONSUMING MARKETS
- UNSATURATED MARKETS
- TOP IMPORTING MARKETS
- MOST PROFITABLE MARKETS
7. PRODUCTION
The Latest Trends and Insights into The Industry
- PRODUCTION VOLUME AND VALUE
8. IMPORTS
The Largest Import Supplying Countries
- IMPORTS FROM 2012–2023
- IMPORTS BY COUNTRY
- IMPORT PRICES BY COUNTRY
9. EXPORTS
The Largest Destinations for Exports
- EXPORTS FROM 2012–2023
- EXPORTS BY COUNTRY
- EXPORT PRICES BY COUNTRY
-
10. PROFILES OF MAJOR PRODUCERS
The Largest Producers on The Market and Their Profiles
This Chapter is Available Only for the Professional Edition PRO -
LIST OF TABLES
- Key Findings In 2023
- Market Volume, In Physical Terms, 2012–2023
- Market Value, 2012–2023
- Per Capita Consumption In 2012-2023
- Imports, In Physical Terms, By Country, 2012–2023
- Imports, In Value Terms, By Country, 2012–2023
- Import Prices, By Country Of Origin, 2012–2023
- Exports, In Physical Terms, By Country, 2012–2023
- Exports, In Value Terms, By Country, 2012–2023
- Export Prices, By Country Of Destination, 2012–2023
-
LIST OF FIGURES
- Market Volume, In Physical Terms, 2012–2023
- Market Value, 2012–2023
- Market Structure – Domestic Supply vs. Imports, In Physical Terms, 2012-2023
- Market Structure – Domestic Supply vs. Imports, In Value Terms, 2012-2023
- Trade Balance, In Physical Terms, 2012-2023
- Trade Balance, In Value Terms, 2012-2023
- Per Capita Consumption, 2012-2023
- Market Volume Forecast to 2030
- Market Value Forecast to 2030
- Products: Market Size And Growth, By Type
- Products: Average Per Capita Consumption, By Type
- Products: Exports And Growth, By Type
- Products: Export Prices And Growth, By Type
- Production Volume And Growth
- Exports And Growth
- Export Prices And Growth
- Market Size And Growth
- Per Capita Consumption
- Imports And Growth
- Import Prices
- Production, In Physical Terms, 2012–2023
- Production, In Value Terms, 2012–2023
- Imports, In Physical Terms, 2012–2023
- Imports, In Value Terms, 2012–2023
- Imports, In Physical Terms, By Country, 2023
- Imports, In Physical Terms, By Country, 2012–2023
- Imports, In Value Terms, By Country, 2012–2023
- Import Prices, By Country Of Origin, 2012–2023
- Exports, In Physical Terms, 2012–2023
- Exports, In Value Terms, 2012–2023
- Exports, In Physical Terms, By Country, 2023
- Exports, In Physical Terms, By Country, 2012–2023
- Exports, In Value Terms, By Country, 2012–2023
- Export Prices, By Country Of Destination, 2012–2023


