
World - Chocolate And Other Food Preparations Containing Cocoa - Market Analysis, Forecast, Size, Trends And Insights
Get instant access to more than 2 million reports, dashboards, and datasets on the IndexBox Platform.
View PricingGlobal Cocoa Market: Strong Growth Expected with +3.6% CAGR in Market Volume Reaching 6.5M Tons
IndexBox has just published a new report: World - Chocolate And Other Food Preparations Containing Cocoa - Market Analysis, Forecast, Size, Trends And Insights.
Driven by increasing demand for chocolate and other cocoa-containing food products worldwide, the market is projected to see growth in both volume and value from 2023 to 2030. Key highlights include the top consuming countries like the United States and France, production trends, and fluctuations in import and export volumes.
Market Forecast
Market Forecast
Driven by increasing demand for chocolate and other food preparations containing cocoa worldwide, the market is expected to continue an upward consumption trend over the next seven years. Market performance is forecast to retain its current trend pattern, expanding with an anticipated CAGR of +3.6% for the period from 2023 to 2030, which is projected to bring the market volume to 6.5M tons by the end of 2030.
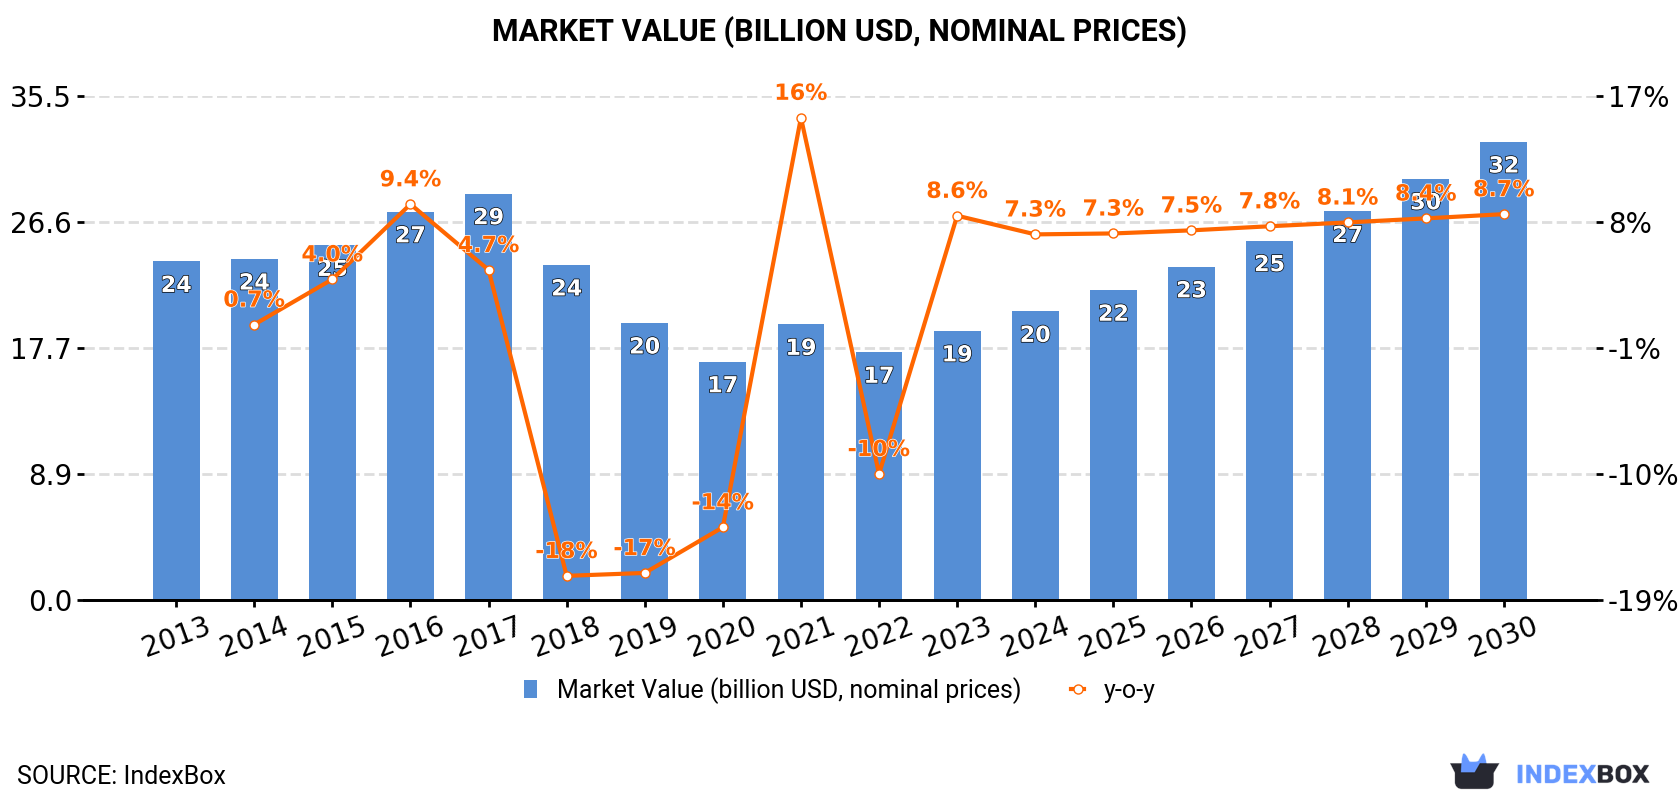
In value terms, the market is forecast to increase with an anticipated CAGR of +7.9% for the period from 2023 to 2030, which is projected to bring the market value to $32.3B (in nominal prices) by the end of 2030.
World Consumption of Chocolate
Consumption
Global chocolate consumption amounted to 5M tons in 2023, therefore, remained relatively stable against 2022. The total consumption volume increased at an average annual rate of +4.4% from 2013 to 2023; however, the trend pattern indicated some noticeable fluctuations being recorded in certain years. As a result, consumption attained the peak volume of 5.2M tons. From 2022 to 2023, the growth of the global consumption remained at a somewhat lower figure.
The global chocolate market revenue rose notably to $19B in 2023, picking up by 8.6% against the previous year. This figure reflects the total revenues of producers and importers (excluding logistics costs, retail marketing costs, and retailers' margins, which will be included in the final consumer price). Over the period under review, consumption, however, showed a noticeable reduction. Over the period under review, the global market attained the peak level at $28.6B in 2017; however, from 2018 to 2023, consumption remained at a lower figure.
Consumption By Country
The United States (786K tons) constituted the country with the largest volume of chocolate consumption, comprising approx. 16% of total volume. Moreover, chocolate consumption in the United States exceeded the figures recorded by the second-largest consumer, France (308K tons), threefold. Nigeria (281K tons) ranked third in terms of total consumption with a 5.6% share.
In the United States, chocolate consumption increased at an average annual rate of +3.5% over the period from 2013-2023. In the other countries, the average annual rates were as follows: France (+0.7% per year) and Nigeria (+14.7% per year).
In value terms, the United States ($2.6B) led the market, alone. The second position in the ranking was taken by France ($1.1B). It was followed by Nigeria.
From 2013 to 2023, the average annual growth rate of value in the United States totaled +5.5%. In the other countries, the average annual rates were as follows: France (+2.4% per year) and Nigeria (+13.9% per year).
The countries with the highest levels of chocolate per capita consumption in 2023 were Poland (5.6 kg per person), France (4.5 kg per person) and Canada (3.3 kg per person).
From 2013 to 2023, the most notable rate of growth in terms of consumption, amongst the key consuming countries, was attained by Nigeria (with a CAGR of +11.8%), while consumption for the other global leaders experienced more modest paces of growth.
World Production of Chocolate
Production
In 2023, global production of chocolate and other food preparations containing cocoa amounted to 5M tons, surging by 1.9% against the previous year's figure. The total output volume increased at an average annual rate of +4.6% over the period from 2013 to 2023; however, the trend pattern indicated some noticeable fluctuations being recorded in certain years. The growth pace was the most rapid in 2021 when the production volume increased by 13%. As a result, production reached the peak volume of 5.1M tons. From 2022 to 2023, global production growth failed to regain momentum.
In value terms, chocolate production reached $16.1B in 2023 estimated in export price. In general, production, however, showed a perceptible setback. The most prominent rate of growth was recorded in 2021 when the production volume increased by 17% against the previous year. Over the period under review, global production hit record highs at $21.9B in 2013; however, from 2014 to 2023, production remained at a lower figure.
Production By Country
The countries with the highest volumes of production in 2023 were the United States (609K tons), Belgium (376K tons) and Nigeria (288K tons), together accounting for 25% of global production.
From 2013 to 2023, the most notable rate of growth in terms of production, amongst the key producing countries, was attained by Nigeria (with a CAGR of +15.0%), while production for the other global leaders experienced more modest paces of growth.
World Imports of Chocolate
Imports
In 2023, after seven years of growth, there was significant decline in purchases abroad of chocolate and other food preparations containing cocoa, when their volume decreased by -6.1% to 1.7M tons. The total import volume increased at an average annual rate of +2.8% over the period from 2013 to 2023; however, the trend pattern indicated some noticeable fluctuations being recorded throughout the analyzed period. The pace of growth was the most pronounced in 2021 when imports increased by 12% against the previous year. Over the period under review, global imports attained the maximum at 1.8M tons in 2022, and then dropped in the following year.
In value terms, chocolate imports stood at $6.6B in 2023. The total import value increased at an average annual rate of +4.7% over the period from 2013 to 2023; however, the trend pattern indicated some noticeable fluctuations being recorded throughout the analyzed period. The most prominent rate of growth was recorded in 2021 with an increase of 15%. Over the period under review, global imports attained the maximum in 2023 and are expected to retain growth in the near future.
Imports By Country
In 2023, the United States (280K tons), France (204K tons) and Germany (167K tons) represented the largest importer of chocolate and other food preparations containing cocoa in the world, creating 38% of total import. It was distantly followed by Japan (98K tons), Belgium (95K tons) and Poland (87K tons), together constituting a 16% share of total imports. The following importers - the Netherlands (75K tons), Canada (70K tons), the UK (65K tons), Italy (41K tons), Spain (41K tons), the Czech Republic (28K tons) and Saudi Arabia (27K tons) - together made up 20% of total imports.
From 2013 to 2023, the most notable rate of growth in terms of purchases, amongst the leading importing countries, was attained by Poland (with a CAGR of +6.5%), while imports for the other global leaders experienced more modest paces of growth.
In value terms, the largest chocolate importing markets worldwide were the United States ($955M), France ($772M) and Germany ($680M), with a combined 37% share of global imports. Belgium, Poland, Canada, Japan, the UK, the Netherlands, Italy, Spain, Saudi Arabia and the Czech Republic lagged somewhat behind, together accounting for a further 36%.
In terms of the main importing countries, Poland, with a CAGR of +7.7%, recorded the highest growth rate of the value of imports, over the period under review, while purchases for the other global leaders experienced more modest paces of growth.
Import Prices By Country
In 2023, the average chocolate import price amounted to $3,869 per ton, picking up by 21% against the previous year. Over the last decade, it increased at an average annual rate of +1.8%. As a result, import price reached the peak level and is likely to continue growth in the immediate term.
There were significant differences in the average prices amongst the major importing countries. In 2023, amid the top importers, the country with the highest price was Saudi Arabia ($4,700 per ton), while Japan ($2,812 per ton) was amongst the lowest.
From 2013 to 2023, the most notable rate of growth in terms of prices was attained by the Czech Republic (+3.5%), while the other global leaders experienced more modest paces of growth.
World Exports of Chocolate
Exports
In 2023, global chocolate exports dropped to 1.7M tons, falling by -4.2% on 2022. The total export volume increased at an average annual rate of +3.4% over the period from 2013 to 2023; however, the trend pattern indicated some noticeable fluctuations being recorded throughout the analyzed period. The most prominent rate of growth was recorded in 2021 with an increase of 13% against the previous year. As a result, the exports attained the peak of 1.7M tons; afterwards, it flattened through to 2023.
In value terms, chocolate exports expanded rapidly to $6.5B in 2023. Overall, total exports indicated strong growth from 2013 to 2023: its value increased at an average annual rate of +5.4% over the last decade. The trend pattern, however, indicated some noticeable fluctuations being recorded throughout the analyzed period. Based on 2023 figures, exports increased by +69.1% against 2013 indices. The most prominent rate of growth was recorded in 2021 with an increase of 18% against the previous year. The global exports peaked in 2023 and are likely to continue growth in the immediate term.
Exports By Country
In 2023, Belgium (386K tons), distantly followed by Canada (219K tons), Germany (158K tons), the United States (103K tons), France (89K tons), Italy (87K tons) and the Netherlands (77K tons) represented the largest exporters of chocolate and other food preparations containing cocoa, together generating 68% of total exports. Poland (70K tons), Cote d'Ivoire (49K tons), Singapore (47K tons), Spain (44K tons), Malaysia (32K tons) and the UK (32K tons) held a little share of total exports.
From 2013 to 2023, the biggest increases were recorded for Cote d'Ivoire (with a CAGR of +35.4%), while shipments for the other global leaders experienced more modest paces of growth.
In value terms, Belgium ($1.8B) remains the largest chocolate supplier worldwide, comprising 27% of global exports. The second position in the ranking was held by Canada ($654M), with a 10% share of global exports. It was followed by Germany, with a 9.5% share.
From 2013 to 2023, the average annual rate of growth in terms of value in Belgium stood at +5.5%. In the other countries, the average annual rates were as follows: Canada (+4.8% per year) and Germany (+6.2% per year).
Export Prices By Country
The average chocolate export price stood at $3,935 per ton in 2023, increasing by 18% against the previous year. Over the last decade, it increased at an average annual rate of +1.9%. As a result, the export price attained the peak level and is likely to continue growth in the immediate term.
Prices varied noticeably by country of origin: amid the top suppliers, the country with the highest price was France ($4,842 per ton), while Malaysia ($2,190 per ton) was amongst the lowest.
From 2013 to 2023, the most notable rate of growth in terms of prices was attained by the United States (+3.5%), while the other global leaders experienced more modest paces of growth.
This report provides an in-depth analysis of the global chocolate market. Within it, you will discover the latest data on market trends and opportunities by country, consumption, production and price developments, as well as the global trade (imports and exports). The forecast exhibits the market prospects through 2030.
Product coverage:
- Prodcom 10822130 - Chocolate and other food preparations containing cocoa, in blocks, slabs or bars > 2 kg or in liquid, paste, powder, g ranular or other bulk form, in containers or immediate packings of a content > 2 kg, containing . .18 % by weight of
Country coverage:
Worldwide - the report contains statistical data for 200 countries and includes detailed profiles of the 50 largest consuming countries:
- USA
- China
- Japan
- Germany
- United Kingdom
- France
- Brazil
- Italy
- Russian Federation
- India
- Canada
- Australia
- Republic of Korea
- Spain
- Mexico
- Indonesia
- Netherlands
- Turkey
- Saudi Arabia
- Switzerland
- Sweden
- Nigeria
- Poland
- Belgium
- Argentina
- Norway
- Austria
- Thailand
- United Arab Emirates
- Colombia
- Denmark
- South Africa
- Malaysia
- Israel
- Singapore
- Egypt
- Philippines
- Finland
- Chile
- Ireland
- Pakistan
- Greece
- Portugal
- Kazakhstan
- Algeria
- Czech Republic
- Qatar
- Peru
- Romania
- Vietnam
+ the largest producing countries
Data coverage:
- Global market volume and value
- Per Capita consumption
- Forecast of the market dynamics in the medium term
- Global production, split by region and country
- Global trade (exports and imports)
- Export and import prices
- Market trends, drivers and restraints
- Key market players and their profiles
Reasons to buy this report:
- Take advantage of the latest data
- Find deeper insights into current market developments
- Discover vital success factors affecting the market
This report is designed for manufacturers, distributors, importers, and wholesalers, as well as for investors, consultants and advisors.
In this report, you can find information that helps you to make informed decisions on the following issues:
- How to diversify your business and benefit from new market opportunities
- How to load your idle production capacity
- How to boost your sales on overseas markets
- How to increase your profit margins
- How to make your supply chain more sustainable
- How to reduce your production and supply chain costs
- How to outsource production to other countries
- How to prepare your business for global expansion
While doing this research, we combine the accumulated expertise of our analysts and the capabilities of artificial intelligence. The AI-based platform, developed by our data scientists, constitutes the key working tool for business analysts, empowering them to discover deep insights and ideas from the marketing data.
-
1. INTRODUCTION
Making Data-Driven Decisions to Grow Your Business
- REPORT DESCRIPTION
- RESEARCH METHODOLOGY AND AI PLATFORM
- DATA-DRIVEN DECISIONS FOR YOUR BUSINESS
- GLOSSARY AND SPECIFIC TERMS
-
2. EXECUTIVE SUMMARY
A Quick Overview of Market Performance
- KEY FINDINGS
- MARKET TRENDS This Chapter is Available Only for the Professional Edition PRO
-
3. MARKET OVERVIEW
Understanding the Current State of The Market and Its Prospects
- MARKET SIZE
- CONSUMPTION BY COUNTRY
- MARKET FORECAST TO 2030
-
4. MOST PROMISING PRODUCT
Finding New Products to Diversify Your Business
This Chapter is Available Only for the Professional Edition PRO- TOP PRODUCTS TO DIVERSIFY YOUR BUSINESS
- BEST-SELLING PRODUCTS
- MOST CONSUMED PRODUCT
- MOST TRADED PRODUCT
- MOST PROFITABLE PRODUCT FOR EXPORT
-
5. MOST PROMISING SUPPLYING COUNTRIES
Choosing the Best Countries to Establish Your Sustainable Supply Chain
This Chapter is Available Only for the Professional Edition PRO- TOP COUNTRIES TO SOURCE YOUR PRODUCT
- TOP PRODUCING COUNTRIES
- TOP EXPORTING COUNTRIES
- LOW-COST EXPORTING COUNTRIES
-
6. MOST PROMISING OVERSEAS MARKETS
Choosing the Best Countries to Boost Your Exports
This Chapter is Available Only for the Professional Edition PRO- TOP OVERSEAS MARKETS FOR EXPORTING YOUR PRODUCT
- TOP CONSUMING MARKETS
- UNSATURATED MARKETS
- TOP IMPORTING MARKETS
- MOST PROFITABLE MARKETS
7. GLOBAL PRODUCTION
The Latest Trends and Insights into The Industry
- PRODUCTION VOLUME AND VALUE
- PRODUCTION BY COUNTRY
8. GLOBAL IMPORTS
The Largest Importers on The Market and How They Succeed
- IMPORTS FROM 2012–2023
- IMPORTS BY COUNTRY
- IMPORT PRICES BY COUNTRY
9. GLOBAL EXPORTS
The Largest Exporters on The Market and How They Succeed
- EXPORTS FROM 2012–2023
- EXPORTS BY COUNTRY
- EXPORT PRICES BY COUNTRY
-
10. PROFILES OF MAJOR PRODUCERS
The Largest Producers on The Market and Their Profiles
This Chapter is Available Only for the Professional Edition PRO -
11. COUNTRY PROFILES
The Largest Markets And Their Profiles
This Chapter is Available Only for the Professional Edition PRO- United States
- China
- Japan
- Germany
- United Kingdom
- France
- Brazil
- Italy
- Russian Federation
- India
- Canada
- Australia
- Republic of Korea
- Spain
- Mexico
- Indonesia
- Netherlands
- Turkey
- Saudi Arabia
- Switzerland
- Sweden
- Nigeria
- Poland
- Belgium
- Argentina
- Norway
- Austria
- Thailand
- United Arab Emirates
- Colombia
- Denmark
- South Africa
- Malaysia
- Israel
- Singapore
- Egypt
- Philippines
- Finland
- Chile
- Ireland
- Pakistan
- Greece
- Portugal
- Kazakhstan
- Algeria
- Czech Republic
- Qatar
- Peru
- Romania
- Vietnam
-
LIST OF TABLES
- Key Findings In 2023
- Market Volume, In Physical Terms, 2012–2023
- Market Value, 2012–2023
- Per Capita Consumption, By Country, 2018–2023
- Production, In Physical Terms, By Country, 2012–2023
- Imports, In Physical Terms, By Country, 2012–2023
- Imports, In Value Terms, By Country, 2012–2023
- Import Prices, By Country Of Destination, 2012–2023
- Exports, In Physical Terms, By Country, 2012–2023
- Exports, In Value Terms, By Country, 2012–2023
- Export Prices, By Country Of Origin, 2012–2023
-
LIST OF FIGURES
- Market Volume, In Physical Terms, 2012–2023
- Market Value, 2012–2023
- Consumption, By Country, 2023
- Market Volume Forecast to 2030
- Market Value Forecast to 2030
- Products: Market Size And Growth, By Type
- Products: Average Per Capita Consumption, By Type
- Products: Exports And Growth, By Type
- Products: Export Prices And Growth, By Type
- Production Volume And Growth
- Exports And Growth
- Export Prices And Growth
- Market Size And Growth
- Per Capita Consumption
- Imports And Growth
- Import Prices
- Production, In Physical Terms, 2012–2023
- Production, In Value Terms, 2012–2023
- Production, By Country, 2023
- Production, In Physical Terms, By Country, 2012–2023
- Imports, In Physical Terms, 2012–2023
- Imports, In Value Terms, 2012–2023
- Imports, In Physical Terms, By Country, 2023
- Imports, In Physical Terms, By Country, 2012–2023
- Imports, In Value Terms, By Country, 2012–2023
- Import Prices, By Country, 2012–2023
- Exports, In Physical Terms, 2012–2023
- Exports, In Value Terms, 2012–2023
- Exports, In Physical Terms, By Country, 2023
- Exports, In Physical Terms, By Country, 2012–2023
- Exports, In Value Terms, By Country, 2012–2023
- Export Prices, 2012–2023


