
France - Bed Linen - Market Analysis, Forecast, Size, Trends And Insights
Get instant access to more than 2 million reports, dashboards, and datasets on the IndexBox Platform.
View PricingImport of Frances' Bed Linen Declines Slightly to $51M in August 2023
France Bed Linen Imports
In August 2023, bed linen imports into France declined slightly to 5.6K tons, reducing by -3.3% compared with July 2023 figures. Overall, imports saw a noticeable slump. The pace of growth was the most pronounced in April 2023 with an increase of 32% against the previous month.
In value terms, bed linen imports contracted to $51M (IndexBox estimates) in August 2023. In general, imports saw a pronounced decrease. The pace of growth was the most pronounced in October 2022 with an increase of 24% month-to-month. As a result, imports attained the peak of $76M. From November 2022 to August 2023, the growth of imports remained at a lower figure.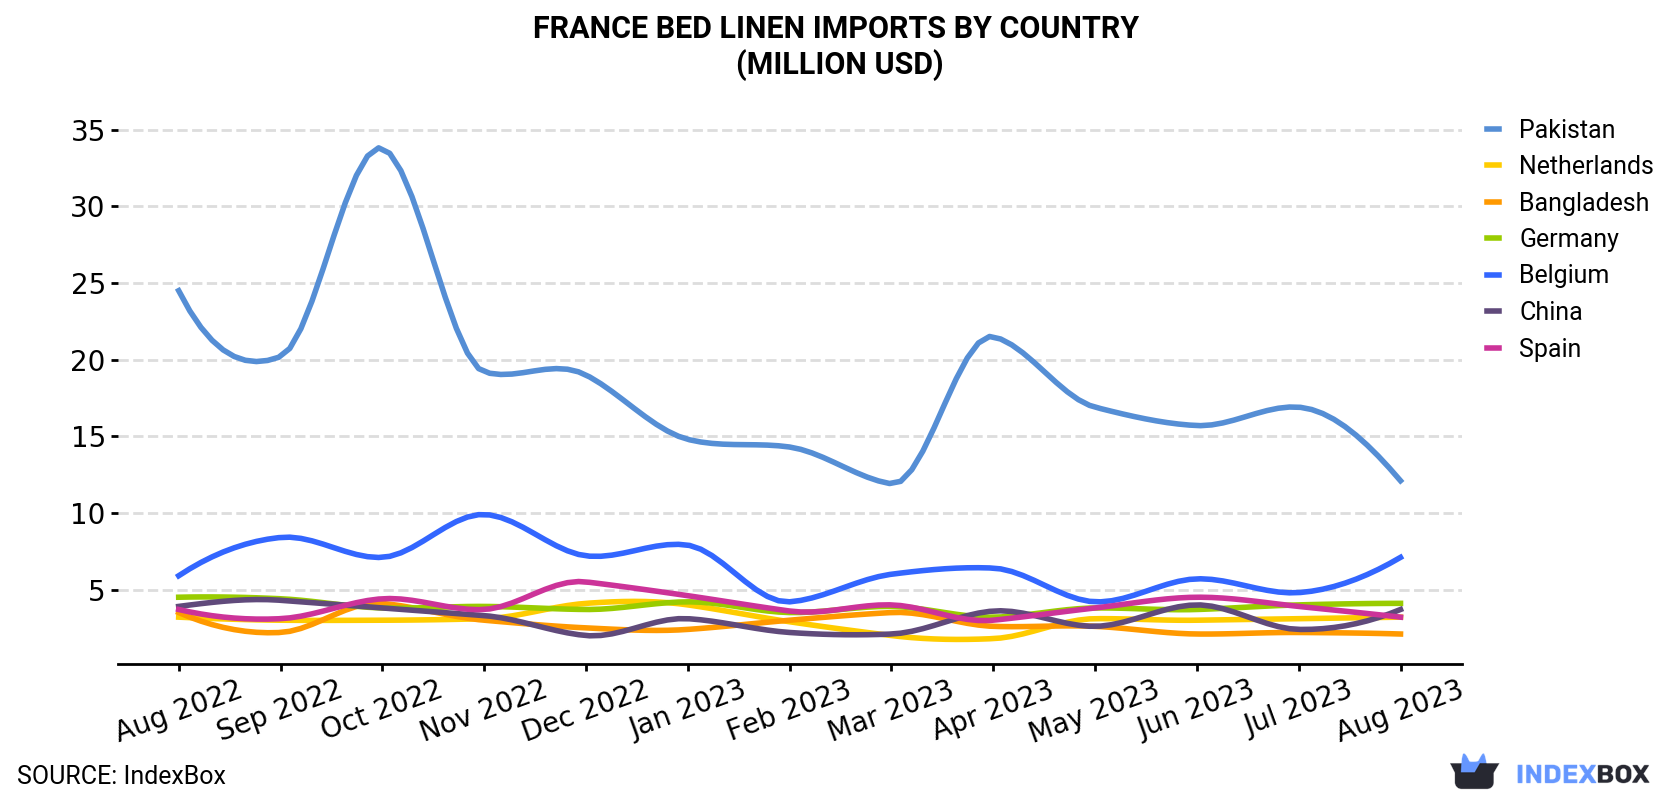
| COUNTRY | Import Value of Bed Linen in France (million USD) | ||||||||||||
|---|---|---|---|---|---|---|---|---|---|---|---|---|---|
| Aug 2022 | Sep 2022 | Oct 2022 | Nov 2022 | Dec 2022 | Jan 2023 | Feb 2023 | Mar 2023 | Apr 2023 | May 2023 | Jun 2023 | Jul 2023 | Aug 2023 | |
| Pakistan | 24.5 | 20.2 | 33.8 | 19.2 | 19.0 | 14.8 | 14.3 | 11.9 | 21.5 | 16.9 | 15.7 | 16.9 | 12.1 |
| Belgium | 5.9 | 8.4 | 7.1 | 9.9 | 7.2 | 7.9 | 4.2 | 6.0 | 6.4 | 4.2 | 5.7 | 4.8 | 7.1 |
| Germany | 4.5 | 4.4 | 3.8 | 3.9 | 3.7 | 4.2 | 3.5 | 3.9 | 3.2 | 3.8 | 3.7 | 4.0 | 4.1 |
| China | 3.9 | 4.3 | 3.8 | 3.3 | 2.0 | 3.1 | 2.2 | 2.1 | 3.6 | 2.6 | 4.0 | 2.4 | 3.7 |
| Netherlands | 3.2 | 3.0 | 3.0 | 3.1 | 4.1 | 4.0 | 2.9 | 2.0 | 1.8 | 3.1 | 3.0 | 3.1 | 3.2 |
| Spain | 3.7 | 3.1 | 4.4 | 3.7 | 5.5 | 4.6 | 3.6 | 4.0 | 3.0 | 3.8 | 4.5 | 3.9 | 3.2 |
| Bangladesh | 3.5 | 2.2 | 4.1 | 3.0 | 2.5 | 2.4 | 3.0 | 3.5 | 2.6 | 2.6 | 2.1 | 2.2 | 2.1 |
| Others | 16.1 | 15.4 | 15.8 | 15.1 | 16.7 | 19.2 | 14.7 | 17.7 | 17.0 | 16.8 | 19.3 | 16.7 | 15.0 |
| Total | 65.2 | 60.8 | 75.7 | 61.4 | 60.8 | 60.2 | 48.3 | 51.1 | 59.0 | 53.7 | 58.1 | 54.0 | 50.5 |
Imports by Country
Pakistan (1.8K tons), Belgium (907 tons) and China (544 tons) were the main suppliers of bed linen imports to France, together accounting for 58% of total imports.
From August 2022 to August 2023, the most notable rate of growth in terms of purchases, amongst the main suppliers, was attained by China (with a CAGR of +1.2%), while imports for the other leaders experienced more modest paces of growth.
In value terms, Pakistan ($12M), Belgium ($7.1M) and Germany ($4.1M) appeared to be the largest bed linen suppliers to France, together accounting for 46% of total imports.
Belgium, with a CAGR of +1.5%, saw the highest rates of growth with regard to the value of imports, in terms of the main suppliers over the period under review, while purchases for the other leaders experienced mixed trend patterns.
Imports by Type
Bed linen of cotton (3.2K tons), bed linen of other woven textiles and non-woven man-made fibres (1.6K tons) and bed linen of knitted or crocheted textiles (796 tons) were the main products of bed linen imports to France.
From August 2022 to August 2023, the most notable rate of growth in terms of purchases, amongst the major product types, was attained by bed linen of knitted or crocheted textiles (with a CAGR of +1.5%), while imports for the other products experienced a decline.
In value terms, bed linen of cotton ($31M) constituted the largest type of bed linen supplied to France, comprising 62% of total imports. The second position in the ranking was taken by bed linen of other woven textiles and non-woven man-made fibres ($12M), with a 23% share of total imports.
Import Prices by Country
In August 2023, the bed linen price stood at $9,083 per ton (CIF, France), which is down by -3.4% against the previous month. Over the period under review, the import price, however, recorded a relatively flat trend pattern. The pace of growth was the most pronounced in May 2023 an increase of 9.4% against the previous month. The import price peaked at $9,893 per ton in January 2023; however, from February 2023 to August 2023, import prices remained at a lower figure.
There were significant differences in the average prices amongst the major supplying countries. In August 2023, the country with the highest price was Portugal ($19,801 per ton), while the price for China ($6,791 per ton) was amongst the lowest.
From August 2022 to August 2023, the most notable rate of growth in terms of prices was attained by Spain (+2.2%), while the prices for the other major suppliers experienced more modest paces of growth.
This report provides an in-depth analysis of the bed linen market in France. Within it, you will discover the latest data on market trends and opportunities by country, consumption, production and price developments, as well as the global trade (imports and exports). The forecast exhibits the market prospects through 2030.
Product coverage:
- Prodcom 13921230 - Bed linen of knitted or crocheted textiles
- Prodcom 13921253 - Bed linen of cotton (excluding knitted or crocheted)
- Prodcom 13921255 - Bed linen of flax or ramie (excluding knitted or crocheted)
- Prodcom 13921259 - Bed linen of woven textiles (excluding of cotton, of flax or ramie)
- Prodcom 13921270 - Bed linen of non-woven man-made fibres (excluding knitted or crocheted)
Country coverage:
- France
Data coverage:
- Market volume and value
- Per Capita consumption
- Forecast of the market dynamics in the medium term
- Trade (exports and imports) in France
- Export and import prices
- Market trends, drivers and restraints
- Key market players and their profiles
Reasons to buy this report:
- Take advantage of the latest data
- Find deeper insights into current market developments
- Discover vital success factors affecting the market
This report is designed for manufacturers, distributors, importers, and wholesalers, as well as for investors, consultants and advisors.
In this report, you can find information that helps you to make informed decisions on the following issues:
- How to diversify your business and benefit from new market opportunities
- How to load your idle production capacity
- How to boost your sales on overseas markets
- How to increase your profit margins
- How to make your supply chain more sustainable
- How to reduce your production and supply chain costs
- How to outsource production to other countries
- How to prepare your business for global expansion
While doing this research, we combine the accumulated expertise of our analysts and the capabilities of artificial intelligence. The AI-based platform, developed by our data scientists, constitutes the key working tool for business analysts, empowering them to discover deep insights and ideas from the marketing data.
-
1. INTRODUCTION
Making Data-Driven Decisions to Grow Your Business
- REPORT DESCRIPTION
- RESEARCH METHODOLOGY AND AI PLATFORM
- DATA-DRIVEN DECISIONS FOR YOUR BUSINESS
- GLOSSARY AND SPECIFIC TERMS
-
2. EXECUTIVE SUMMARY
A Quick Overview of Market Performance
- KEY FINDINGS
- MARKET TRENDS This Chapter is Available Only for the Professional Edition PRO
-
3. MARKET OVERVIEW
Understanding the Current State of The Market and Its Prospects
- MARKET SIZE
- MARKET STRUCTURE
- TRADE BALANCE
- PER CAPITA CONSUMPTION
- MARKET FORECAST TO 2030
-
4. MOST PROMISING PRODUCT
Finding New Products to Diversify Your Business
This Chapter is Available Only for the Professional Edition PRO- TOP PRODUCTS TO DIVERSIFY YOUR BUSINESS
- BEST-SELLING PRODUCTS
- MOST CONSUMED PRODUCT
- MOST TRADED PRODUCT
- MOST PROFITABLE PRODUCT FOR EXPORT
-
5. MOST PROMISING SUPPLYING COUNTRIES
Choosing the Best Countries to Establish Your Sustainable Supply Chain
This Chapter is Available Only for the Professional Edition PRO- TOP COUNTRIES TO SOURCE YOUR PRODUCT
- TOP PRODUCING COUNTRIES
- TOP EXPORTING COUNTRIES
- LOW-COST EXPORTING COUNTRIES
-
6. MOST PROMISING OVERSEAS MARKETS
Choosing the Best Countries to Boost Your Exports
This Chapter is Available Only for the Professional Edition PRO- TOP OVERSEAS MARKETS FOR EXPORTING YOUR PRODUCT
- TOP CONSUMING MARKETS
- UNSATURATED MARKETS
- TOP IMPORTING MARKETS
- MOST PROFITABLE MARKETS
7. PRODUCTION
The Latest Trends and Insights into The Industry
- PRODUCTION VOLUME AND VALUE
8. IMPORTS
The Largest Import Supplying Countries
- IMPORTS FROM 2012–2023
- IMPORTS BY COUNTRY
- IMPORT PRICES BY COUNTRY
9. EXPORTS
The Largest Destinations for Exports
- EXPORTS FROM 2012–2023
- EXPORTS BY COUNTRY
- EXPORT PRICES BY COUNTRY
-
10. PROFILES OF MAJOR PRODUCERS
The Largest Producers on The Market and Their Profiles
This Chapter is Available Only for the Professional Edition PRO -
LIST OF TABLES
- Key Findings In 2023
- Market Volume, In Physical Terms, 2012–2023
- Market Value, 2012–2023
- Per Capita Consumption In 2012-2023
- Imports, In Physical Terms, By Country, 2012–2023
- Imports, In Value Terms, By Country, 2012–2023
- Import Prices, By Country Of Origin, 2012–2023
- Exports, In Physical Terms, By Country, 2012–2023
- Exports, In Value Terms, By Country, 2012–2023
- Export Prices, By Country Of Destination, 2012–2023
-
LIST OF FIGURES
- Market Volume, In Physical Terms, 2012–2023
- Market Value, 2012–2023
- Market Structure – Domestic Supply vs. Imports, In Physical Terms, 2012-2023
- Market Structure – Domestic Supply vs. Imports, In Value Terms, 2012-2023
- Trade Balance, In Physical Terms, 2012-2023
- Trade Balance, In Value Terms, 2012-2023
- Per Capita Consumption, 2012-2023
- Market Volume Forecast to 2030
- Market Value Forecast to 2030
- Products: Market Size And Growth, By Type
- Products: Average Per Capita Consumption, By Type
- Products: Exports And Growth, By Type
- Products: Export Prices And Growth, By Type
- Production Volume And Growth
- Exports And Growth
- Export Prices And Growth
- Market Size And Growth
- Per Capita Consumption
- Imports And Growth
- Import Prices
- Production, In Physical Terms, 2012–2023
- Production, In Value Terms, 2012–2023
- Imports, In Physical Terms, 2012–2023
- Imports, In Value Terms, 2012–2023
- Imports, In Physical Terms, By Country, 2023
- Imports, In Physical Terms, By Country, 2012–2023
- Imports, In Value Terms, By Country, 2012–2023
- Import Prices, By Country Of Origin, 2012–2023
- Exports, In Physical Terms, 2012–2023
- Exports, In Value Terms, 2012–2023
- Exports, In Physical Terms, By Country, 2023
- Exports, In Physical Terms, By Country, 2012–2023
- Exports, In Value Terms, By Country, 2012–2023
- Export Prices, By Country Of Destination, 2012–2023


