
United Kingdom - Bed Linen - Market Analysis, Forecast, Size, Trends And Insights
Get instant access to more than 2 million reports, dashboards, and datasets on the IndexBox Platform.
View PricingUK's June 2023 Bed Linen Import Slips to $50M, Declining by 2%
United Kingdom Bed Linen Imports
Bed linen imports into the UK contracted to 6.2K tons in June 2023, which is down by -5% compared with the month before. The total import volume increased at an average monthly rate of +1.5% from June 2022 to June 2023; however, the trend pattern indicated some noticeable fluctuations being recorded in certain months. The most prominent rate of growth was recorded in July 2022 with an increase of 58% against the previous month.
In value terms, bed linen imports reduced to $50M (IndexBox estimates) in June 2023. In general, imports, however, showed a relatively flat trend pattern. The pace of growth appeared the most rapid in July 2022 with an increase of 37% against the previous month.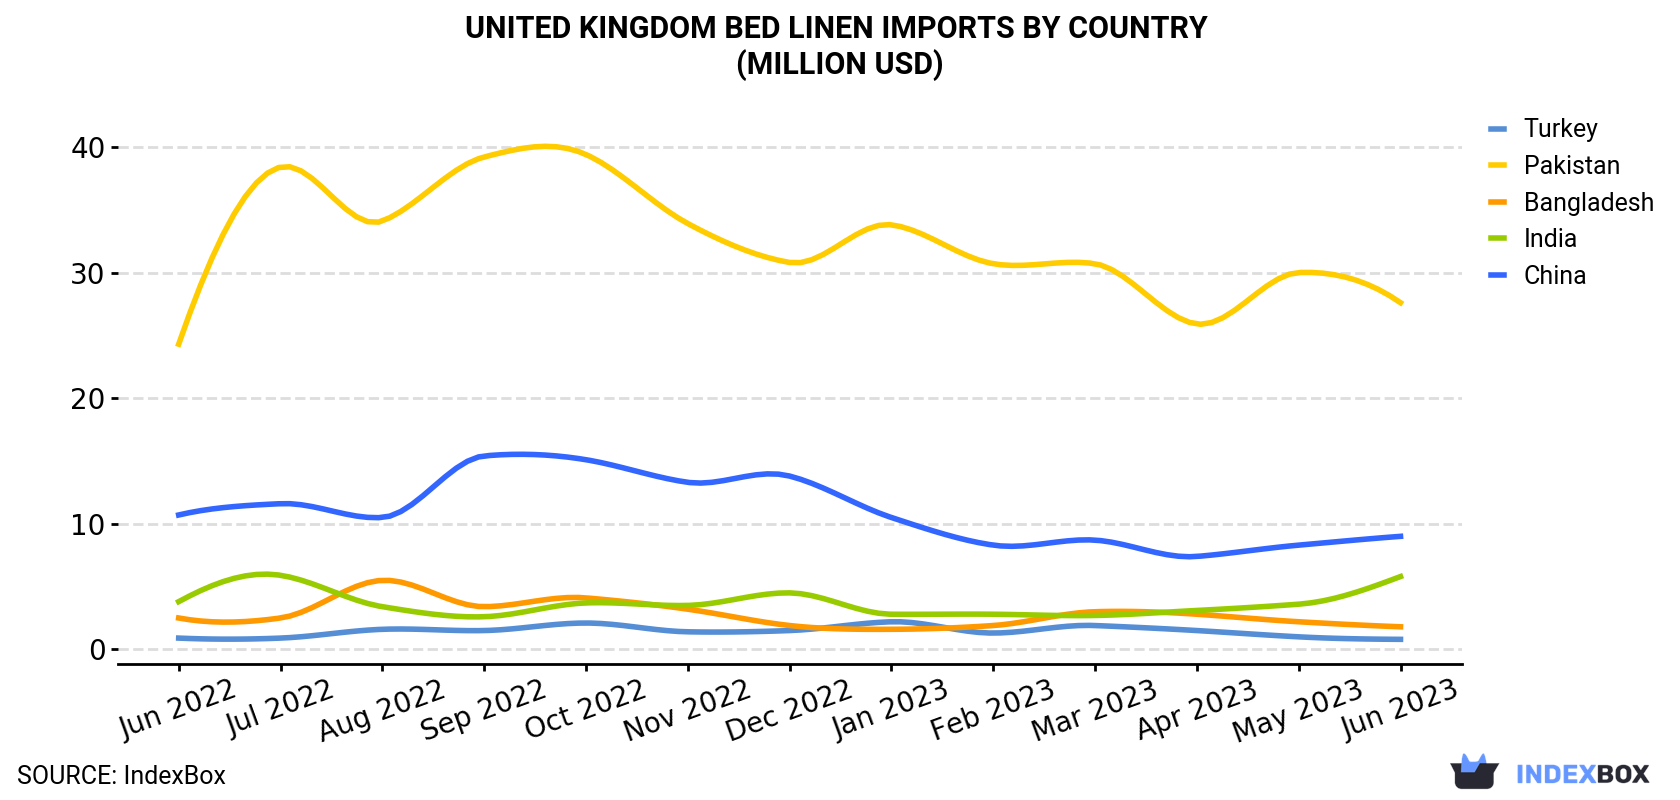
| COUNTRY | Import Value of Bed Linen in United Kingdom (million USD) | ||||||||||||
|---|---|---|---|---|---|---|---|---|---|---|---|---|---|
| Jun 2022 | Jul 2022 | Aug 2022 | Sep 2022 | Oct 2022 | Nov 2022 | Dec 2022 | Jan 2023 | Feb 2023 | Mar 2023 | Apr 2023 | May 2023 | Jun 2023 | |
| Pakistan | 24.3 | 38.4 | 34.1 | 39.2 | 39.4 | 33.9 | 30.8 | 33.8 | 30.7 | 30.7 | 25.9 | 30.0 | 27.6 |
| China | 10.7 | 11.6 | 10.5 | 15.4 | 15.1 | 13.3 | 13.8 | 10.5 | 8.3 | 8.7 | 7.4 | 8.3 | 9.0 |
| India | 3.8 | 5.9 | 3.4 | 2.6 | 3.7 | 3.5 | 4.5 | 2.8 | 2.8 | 2.7 | 3.1 | 3.6 | 5.8 |
| Bangladesh | 2.5 | 2.5 | 5.5 | 3.4 | 4.1 | 3.2 | 1.9 | 1.6 | 1.9 | 3.0 | 2.8 | 2.2 | 1.8 |
| Turkey | 0.9 | 0.9 | 1.6 | 1.5 | 2.1 | 1.4 | 1.5 | 2.2 | 1.3 | 1.9 | 1.5 | 1.0 | 0.8 |
| Others | 4.5 | 4.6 | 4.2 | 2.9 | 4.1 | 4.4 | 5.9 | 4.9 | 3.9 | 4.6 | 4.4 | 5.3 | 4.6 |
| Total | 46.8 | 63.9 | 59.4 | 65.0 | 68.6 | 59.7 | 58.3 | 55.8 | 48.9 | 51.5 | 45.0 | 50.5 | 49.6 |
Imports by Country
In June 2023, Pakistan (4.1K tons) constituted the largest bed linen supplier to the UK, accounting for a 66% share of total imports. Moreover, bed linen imports from Pakistan exceeded the figures recorded by the second-largest supplier, China (1.1K tons), fourfold. India (455 tons) ranked third in terms of total imports with a 7.4% share.
From June 2022 to June 2023, the average monthly growth rate of volume from Pakistan totaled +1.8%. The remaining supplying countries recorded the following average monthly rates of imports growth: China (+1.8% per month) and India (+2.7% per month).
In value terms, Pakistan ($28M) constituted the largest supplier of bed linen to the UK, comprising 56% of total imports. The second position in the ranking was taken by China ($9M), with an 18% share of total imports. It was followed by India, with a 12% share.
From June 2022 to June 2023, the average monthly growth rate of value from Pakistan totaled +1.0%. The remaining supplying countries recorded the following average monthly rates of imports growth: China (-1.4% per month) and India (+3.5% per month).
Imports by Type
Bed linen of other woven textiles and non-woven man-made fibres (3.1K tons), bed linen of cotton (2.9K tons) and bed linen of knitted or crocheted textiles (193 tons) were the main products of bed linen imports to the UK.
From June 2022 to June 2023, the biggest increases were in bed linen of other woven textiles and non-woven man-made fibres (with a CAGR of +2.7%), while purchases for the other products experienced mixed trend patterns.
In value terms, the most traded types of bed linen in the UK were bed linen of cotton ($26M), bed linen of other woven textiles and non-woven man-made fibres ($22M) and bed linen of knitted or crocheted textiles ($1.7M), together comprising 99.9% of total imports.
Import Prices by Country
In June 2023, the bed linen price stood at $8,037 per ton (CIF, United Kingdom), growing by 3.4% against the previous month. Overall, the import price, however, continues to indicate a slight decrease. The most prominent rate of growth was recorded in February 2023 when the average import price increased by 9.2% against the previous month. The import price peaked at $9,112 per ton in June 2022; however, from July 2022 to June 2023, import prices stood at a somewhat lower figure.
There were significant differences in the average prices amongst the major supplying countries. In June 2023, the country with the highest price was Portugal ($24,532 per ton), while the price for Pakistan ($6,742 per ton) was amongst the lowest.
From June 2022 to June 2023, the most notable rate of growth in terms of prices was attained by India (+0.8%), while the prices for the other major suppliers experienced more modest paces of growth.
This report provides an in-depth analysis of the bed linen market in the UK. Within it, you will discover the latest data on market trends and opportunities by country, consumption, production and price developments, as well as the global trade (imports and exports). The forecast exhibits the market prospects through 2030.
Product coverage:
- Prodcom 13921230 - Bed linen of knitted or crocheted textiles
- Prodcom 13921253 - Bed linen of cotton (excluding knitted or crocheted)
- Prodcom 13921255 - Bed linen of flax or ramie (excluding knitted or crocheted)
- Prodcom 13921259 - Bed linen of woven textiles (excluding of cotton, of flax or ramie)
- Prodcom 13921270 - Bed linen of non-woven man-made fibres (excluding knitted or crocheted)
Country coverage:
- United Kingdom
Data coverage:
- Market volume and value
- Per Capita consumption
- Forecast of the market dynamics in the medium term
- Trade (exports and imports) in the UK
- Export and import prices
- Market trends, drivers and restraints
- Key market players and their profiles
Reasons to buy this report:
- Take advantage of the latest data
- Find deeper insights into current market developments
- Discover vital success factors affecting the market
This report is designed for manufacturers, distributors, importers, and wholesalers, as well as for investors, consultants and advisors.
In this report, you can find information that helps you to make informed decisions on the following issues:
- How to diversify your business and benefit from new market opportunities
- How to load your idle production capacity
- How to boost your sales on overseas markets
- How to increase your profit margins
- How to make your supply chain more sustainable
- How to reduce your production and supply chain costs
- How to outsource production to other countries
- How to prepare your business for global expansion
While doing this research, we combine the accumulated expertise of our analysts and the capabilities of artificial intelligence. The AI-based platform, developed by our data scientists, constitutes the key working tool for business analysts, empowering them to discover deep insights and ideas from the marketing data.
-
1. INTRODUCTION
Making Data-Driven Decisions to Grow Your Business
- REPORT DESCRIPTION
- RESEARCH METHODOLOGY AND AI PLATFORM
- DATA-DRIVEN DECISIONS FOR YOUR BUSINESS
- GLOSSARY AND SPECIFIC TERMS
-
2. EXECUTIVE SUMMARY
A Quick Overview of Market Performance
- KEY FINDINGS
- MARKET TRENDS This Chapter is Available Only for the Professional Edition PRO
-
3. MARKET OVERVIEW
Understanding the Current State of The Market and Its Prospects
- MARKET SIZE
- MARKET STRUCTURE
- TRADE BALANCE
- PER CAPITA CONSUMPTION
- MARKET FORECAST TO 2030
-
4. MOST PROMISING PRODUCT
Finding New Products to Diversify Your Business
This Chapter is Available Only for the Professional Edition PRO- TOP PRODUCTS TO DIVERSIFY YOUR BUSINESS
- BEST-SELLING PRODUCTS
- MOST CONSUMED PRODUCT
- MOST TRADED PRODUCT
- MOST PROFITABLE PRODUCT FOR EXPORT
-
5. MOST PROMISING SUPPLYING COUNTRIES
Choosing the Best Countries to Establish Your Sustainable Supply Chain
This Chapter is Available Only for the Professional Edition PRO- TOP COUNTRIES TO SOURCE YOUR PRODUCT
- TOP PRODUCING COUNTRIES
- TOP EXPORTING COUNTRIES
- LOW-COST EXPORTING COUNTRIES
-
6. MOST PROMISING OVERSEAS MARKETS
Choosing the Best Countries to Boost Your Exports
This Chapter is Available Only for the Professional Edition PRO- TOP OVERSEAS MARKETS FOR EXPORTING YOUR PRODUCT
- TOP CONSUMING MARKETS
- UNSATURATED MARKETS
- TOP IMPORTING MARKETS
- MOST PROFITABLE MARKETS
7. PRODUCTION
The Latest Trends and Insights into The Industry
- PRODUCTION VOLUME AND VALUE
8. IMPORTS
The Largest Import Supplying Countries
- IMPORTS FROM 2012–2023
- IMPORTS BY COUNTRY
- IMPORT PRICES BY COUNTRY
9. EXPORTS
The Largest Destinations for Exports
- EXPORTS FROM 2012–2023
- EXPORTS BY COUNTRY
- EXPORT PRICES BY COUNTRY
-
10. PROFILES OF MAJOR PRODUCERS
The Largest Producers on The Market and Their Profiles
This Chapter is Available Only for the Professional Edition PRO -
LIST OF TABLES
- Key Findings In 2023
- Market Volume, In Physical Terms, 2012–2023
- Market Value, 2012–2023
- Per Capita Consumption In 2012-2023
- Imports, In Physical Terms, By Country, 2012–2023
- Imports, In Value Terms, By Country, 2012–2023
- Import Prices, By Country Of Origin, 2012–2023
- Exports, In Physical Terms, By Country, 2012–2023
- Exports, In Value Terms, By Country, 2012–2023
- Export Prices, By Country Of Destination, 2012–2023
-
LIST OF FIGURES
- Market Volume, In Physical Terms, 2012–2023
- Market Value, 2012–2023
- Market Structure – Domestic Supply vs. Imports, In Physical Terms, 2012-2023
- Market Structure – Domestic Supply vs. Imports, In Value Terms, 2012-2023
- Trade Balance, In Physical Terms, 2012-2023
- Trade Balance, In Value Terms, 2012-2023
- Per Capita Consumption, 2012-2023
- Market Volume Forecast to 2030
- Market Value Forecast to 2030
- Products: Market Size And Growth, By Type
- Products: Average Per Capita Consumption, By Type
- Products: Exports And Growth, By Type
- Products: Export Prices And Growth, By Type
- Production Volume And Growth
- Exports And Growth
- Export Prices And Growth
- Market Size And Growth
- Per Capita Consumption
- Imports And Growth
- Import Prices
- Production, In Physical Terms, 2012–2023
- Production, In Value Terms, 2012–2023
- Imports, In Physical Terms, 2012–2023
- Imports, In Value Terms, 2012–2023
- Imports, In Physical Terms, By Country, 2023
- Imports, In Physical Terms, By Country, 2012–2023
- Imports, In Value Terms, By Country, 2012–2023
- Import Prices, By Country Of Origin, 2012–2023
- Exports, In Physical Terms, 2012–2023
- Exports, In Value Terms, 2012–2023
- Exports, In Physical Terms, By Country, 2023
- Exports, In Physical Terms, By Country, 2012–2023
- Exports, In Value Terms, By Country, 2012–2023
- Export Prices, By Country Of Destination, 2012–2023


