
China - Dolls And Toys - Market Analysis, Forecast, Size, Trends and Insights
Get instant access to more than 2 million reports, dashboards, and datasets on the IndexBox Platform.
View PricingChina's December 2023 Export of Toys Reaches $3.4B
China Toy Exports
After three months of decline, overseas shipments of dolls and toys increased by 2.4% to 274K tons in December 2023. Overall, exports recorded a relatively flat trend pattern. The most prominent rate of growth was recorded in March 2023 when exports increased by 94% month-to-month.
In value terms, toy exports rose significantly to $3.4B (IndexBox estimates) in December 2023. Over the period under review, exports, however, recorded a relatively flat trend pattern. The pace of growth was the most pronounced in March 2023 with an increase of 106% against the previous month.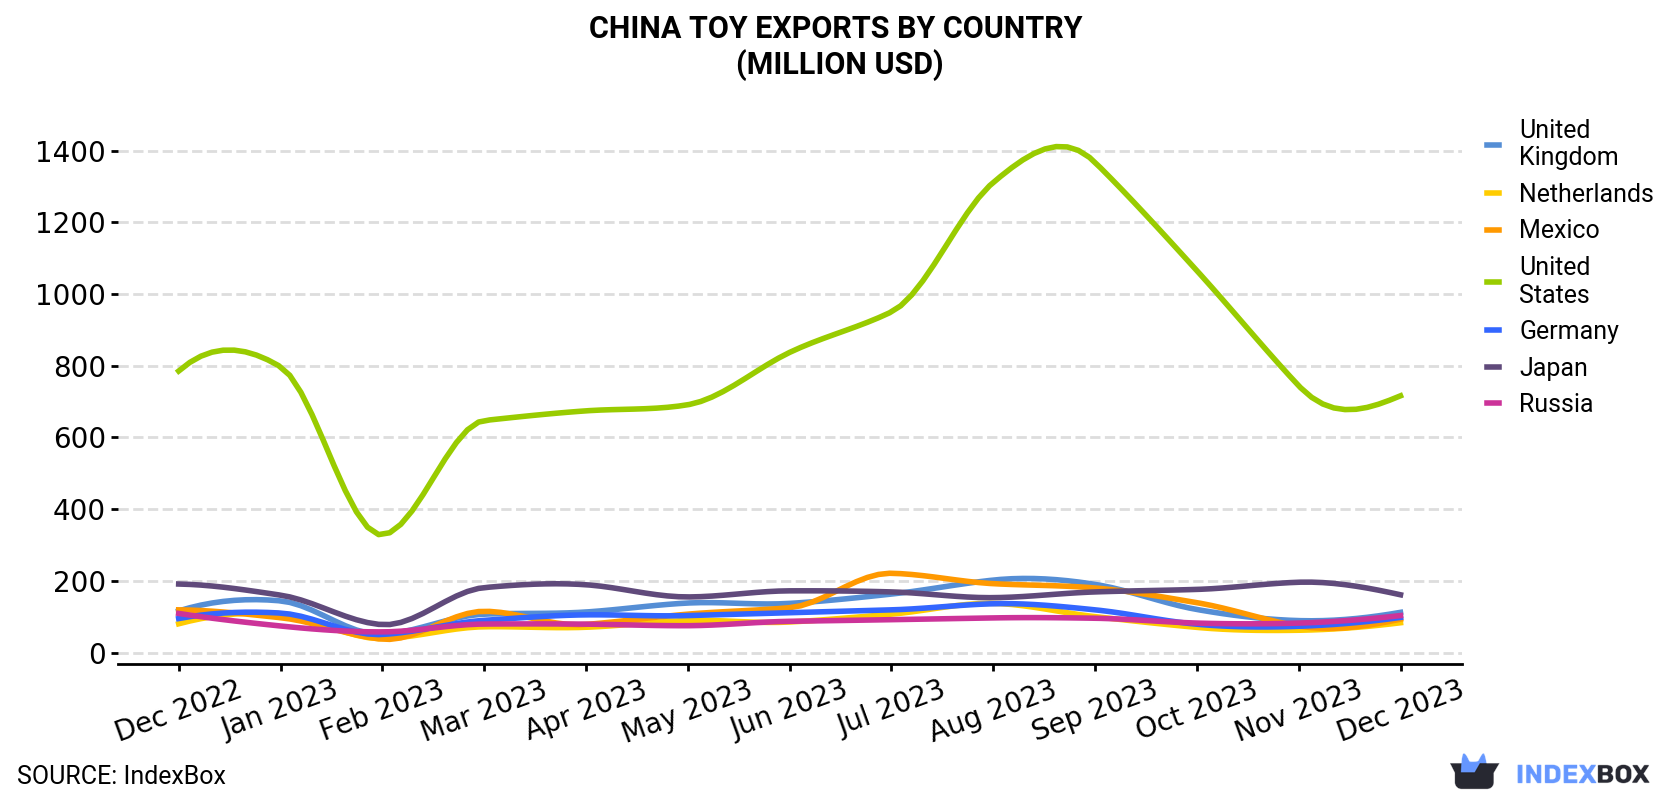
| COUNTRY | Export Value of Toy in China (million USD) | ||||||||||||
|---|---|---|---|---|---|---|---|---|---|---|---|---|---|
| Dec 2022 | Jan 2023 | Feb 2023 | Mar 2023 | Apr 2023 | May 2023 | Jun 2023 | Jul 2023 | Aug 2023 | Sep 2023 | Oct 2023 | Nov 2023 | Dec 2023 | |
| United States | 785 | 797 | 328 | 647 | 674 | 691 | 837 | 950 | 1,311 | 1,367 | 1,065 | 744 | 716 |
| Japan | 191 | 160 | 77.7 | 181 | 189 | 155 | 172 | 169 | 153 | 169 | 176 | 196 | 161 |
| United Kingdom | 116 | 144 | 50.8 | 107 | 113 | 138 | 137 | 163 | 202 | 190 | 120 | 89.0 | 112 |
| Russia | 109 | 74.0 | 57.5 | 79.4 | 79.1 | 74.8 | 87.0 | 91.6 | 96.5 | 95.6 | 82.1 | 82.1 | 103 |
| Germany | 94.7 | 110 | 50.3 | 89.7 | 105 | 103 | 111 | 119 | 136 | 119 | 78.9 | 73.1 | 97.9 |
| Mexico | 119 | 97.1 | 37.1 | 115 | 78.2 | 107 | 125 | 221 | 192 | 180 | 139 | 73.7 | 93.1 |
| Netherlands | 80.1 | 108 | 38.8 | 71.8 | 70.4 | 89.2 | 85.1 | 107 | 137 | 100 | 70.1 | 62.1 | 83.0 |
| Others | 2,260 | 1,763 | 1,007 | 2,101 | 1,961 | 1,769 | 1,831 | 1,969 | 2,216 | 2,108 | 1,784 | 1,679 | 2,056 |
| Total | 3,755 | 3,253 | 1,647 | 3,391 | 3,269 | 3,126 | 3,384 | 3,790 | 4,445 | 4,328 | 3,515 | 2,999 | 3,422 |
Exports by Country
The United States (80K tons) was the main destination for toy exports from China, accounting for a 29% share of total exports. Moreover, toy exports to the United States exceeded the volume sent to the second major destination, Russia (12K tons), sevenfold. The third position in this ranking was taken by the UK (11K tons), with a 4% share.
From December 2022 to December 2023, the average monthly growth rate of volume to the United States was relatively modest. Exports to the other major destinations recorded the following average monthly rates of exports growth: Russia (+1.9% per month) and the UK (+1.5% per month).
In value terms, the United States ($716M) remains the key foreign market for toy exports from China, comprising 21% of total exports. The second position in the ranking was taken by Japan ($161M), with a 4.7% share of total exports. It was followed by the UK, with a 3.3% share.
From December 2022 to December 2023, the average monthly rate of growth in terms of value to the United States was relatively modest. Exports to the other major destinations recorded the following average monthly rates of exports growth: Japan (-1.4% per month) and the UK (-0.3% per month).
Export Prices by Country
In December 2023, the toy price stood at $12,489 per ton (FOB, China), increasing by 11% against the previous month. Over the period under review, the export price, however, showed a mild shrinkage. The export price peaked at $15,089 per ton in December 2022; however, from January 2023 to December 2023, the export prices stood at a somewhat lower figure.
There were significant differences in the average prices for the major external markets. In December 2023, the country with the highest price was Kazakhstan ($23,037 per ton), while the average price for exports to the United States ($8,934 per ton) was amongst the lowest.
From December 2022 to December 2023, the most notable rate of growth in terms of prices was recorded for supplies to Kazakhstan (+5.6%), while the prices for the other major destinations experienced mixed trend patterns.
This report provides an in-depth analysis of the toy market in China. Within it, you will discover the latest data on market trends and opportunities by country, consumption, production and price developments, as well as the global trade (imports and exports). The forecast exhibits the market prospects through 2030.
Product coverage:
- Prodcom 32401100 - Dolls representing only human beings
- Prodcom 32401200 - Toys representing animals or non-human creatures
- Prodcom 32401300 - Parts and accessories for dolls representing only human beings
- Prodcom 32402000 - Toy trains and their accessories, other reduced-size models or construction sets and constructional toys
- Prodcom 32403100 - Wheeled toys designed to be ridden by children (excluding bicycles), dolls
- Prodcom 32403200 - Puzzles
- Prodcom 32403920 - Toy musical instruments and apparatus, toys put up in sets or outfits (excluding electric trains, scale model assembly kits, c onstruction sets and constructional toys, and puzzles), toys and models incorporating a motor, toy weapons
- Prodcom 32403940 - Other toys of plastics
- Prodcom 32403960 - Toy die-cast miniature models of metal
- Prodcom 32403990 - Other toys n.e.c.
Country coverage:
Data coverage:
- Market volume and value
- Per Capita consumption
- Forecast of the market dynamics in the medium term
- Trade (exports and imports) in China
- Export and import prices
- Market trends, drivers and restraints
- Key market players and their profiles
Reasons to buy this report:
- Take advantage of the latest data
- Find deeper insights into current market developments
- Discover vital success factors affecting the market
This report is designed for manufacturers, distributors, importers, and wholesalers, as well as for investors, consultants and advisors.
In this report, you can find information that helps you to make informed decisions on the following issues:
- How to diversify your business and benefit from new market opportunities
- How to load your idle production capacity
- How to boost your sales on overseas markets
- How to increase your profit margins
- How to make your supply chain more sustainable
- How to reduce your production and supply chain costs
- How to outsource production to other countries
- How to prepare your business for global expansion
While doing this research, we combine the accumulated expertise of our analysts and the capabilities of artificial intelligence. The AI-based platform, developed by our data scientists, constitutes the key working tool for business analysts, empowering them to discover deep insights and ideas from the marketing data.
-
1. INTRODUCTION
Making Data-Driven Decisions to Grow Your Business
- REPORT DESCRIPTION
- RESEARCH METHODOLOGY AND AI PLATFORM
- DATA-DRIVEN DECISIONS FOR YOUR BUSINESS
- GLOSSARY AND SPECIFIC TERMS
-
2. EXECUTIVE SUMMARY
A Quick Overview of Market Performance
- KEY FINDINGS
- MARKET TRENDS This Chapter is Available Only for the Professional Edition PRO
-
3. MARKET OVERVIEW
Understanding the Current State of The Market and Its Prospects
- MARKET SIZE
- MARKET STRUCTURE
- TRADE BALANCE
- PER CAPITA CONSUMPTION
- MARKET FORECAST TO 2030
-
4. MOST PROMISING PRODUCT
Finding New Products to Diversify Your Business
This Chapter is Available Only for the Professional Edition PRO- TOP PRODUCTS TO DIVERSIFY YOUR BUSINESS
- BEST-SELLING PRODUCTS
- MOST CONSUMED PRODUCT
- MOST TRADED PRODUCT
- MOST PROFITABLE PRODUCT FOR EXPORT
-
5. MOST PROMISING SUPPLYING COUNTRIES
Choosing the Best Countries to Establish Your Sustainable Supply Chain
This Chapter is Available Only for the Professional Edition PRO- TOP COUNTRIES TO SOURCE YOUR PRODUCT
- TOP PRODUCING COUNTRIES
- TOP EXPORTING COUNTRIES
- LOW-COST EXPORTING COUNTRIES
-
6. MOST PROMISING OVERSEAS MARKETS
Choosing the Best Countries to Boost Your Exports
This Chapter is Available Only for the Professional Edition PRO- TOP OVERSEAS MARKETS FOR EXPORTING YOUR PRODUCT
- TOP CONSUMING MARKETS
- UNSATURATED MARKETS
- TOP IMPORTING MARKETS
- MOST PROFITABLE MARKETS
7. PRODUCTION
The Latest Trends and Insights into The Industry
- PRODUCTION VOLUME AND VALUE
8. IMPORTS
The Largest Import Supplying Countries
- IMPORTS FROM 2012–2023
- IMPORTS BY COUNTRY
- IMPORT PRICES BY COUNTRY
9. EXPORTS
The Largest Destinations for Exports
- EXPORTS FROM 2012–2023
- EXPORTS BY COUNTRY
- EXPORT PRICES BY COUNTRY
-
10. PROFILES OF MAJOR PRODUCERS
The Largest Producers on The Market and Their Profiles
This Chapter is Available Only for the Professional Edition PRO -
LIST OF TABLES
- Key Findings In 2023
- Market Volume, In Physical Terms, 2012–2023
- Market Value, 2012–2023
- Per Capita Consumption In 2012-2023
- Imports, In Physical Terms, By Country, 2012–2023
- Imports, In Value Terms, By Country, 2012–2023
- Import Prices, By Country Of Origin, 2012–2023
- Exports, In Physical Terms, By Country, 2012–2023
- Exports, In Value Terms, By Country, 2012–2023
- Export Prices, By Country Of Destination, 2012–2023
-
LIST OF FIGURES
- Market Volume, In Physical Terms, 2012–2023
- Market Value, 2012–2023
- Market Structure – Domestic Supply vs. Imports, In Physical Terms, 2012-2023
- Market Structure – Domestic Supply vs. Imports, In Value Terms, 2012-2023
- Trade Balance, In Physical Terms, 2012-2023
- Trade Balance, In Value Terms, 2012-2023
- Per Capita Consumption, 2012-2023
- Market Volume Forecast to 2030
- Market Value Forecast to 2030
- Products: Market Size And Growth, By Type
- Products: Average Per Capita Consumption, By Type
- Products: Exports And Growth, By Type
- Products: Export Prices And Growth, By Type
- Production Volume And Growth
- Exports And Growth
- Export Prices And Growth
- Market Size And Growth
- Per Capita Consumption
- Imports And Growth
- Import Prices
- Production, In Physical Terms, 2012–2023
- Production, In Value Terms, 2012–2023
- Imports, In Physical Terms, 2012–2023
- Imports, In Value Terms, 2012–2023
- Imports, In Physical Terms, By Country, 2023
- Imports, In Physical Terms, By Country, 2012–2023
- Imports, In Value Terms, By Country, 2012–2023
- Import Prices, By Country Of Origin, 2012–2023
- Exports, In Physical Terms, 2012–2023
- Exports, In Value Terms, 2012–2023
- Exports, In Physical Terms, By Country, 2023
- Exports, In Physical Terms, By Country, 2012–2023
- Exports, In Value Terms, By Country, 2012–2023
- Export Prices, By Country Of Destination, 2012–2023


