After five years of growth, the Vietnamese passenger car market decreased by X% to $X in 2025. In general, consumption showed a prominent increase. Over the period under review, the market hit record highs at $X in 2023, and then declined modestly in the following year.
Passenger Car Production in Vietnam
In value terms, passenger car production fell to $X in 2025 estimated in export price. Overall, production saw a prominent increase. The most prominent rate of growth was recorded in 2015 when the production volume increased by X%. Over the period under review, production attained the maximum level at $X in 2023, and then fell in the following year.
Passenger Car Exports
Exports from Vietnam
After two years of decline, overseas shipments of passenger cars increased by X% to X units in 2025. In general, exports enjoyed a significant expansion. The pace of growth was the most pronounced in 2019 when exports increased by X% against the previous year. Over the period under review, the exports hit record highs at X units in 2021; however, from 2022 to 2025, the exports failed to regain momentum.
In value terms, passenger car exports contracted to $X in 2025. Over the period under review, exports recorded a significant expansion. The growth pace was the most rapid in 2019 with an increase of X% against the previous year. Over the period under review, the exports reached the peak figure at $X in 2023, and then contracted in the following year.
Exports by Country
The United States (X units) was the main destination for passenger car exports from Vietnam, with a X% share of total exports. Moreover, passenger car exports to the United States exceeded the volume sent to the second major destination, Canada (X units), fourfold. The third position in this ranking was taken by the UK (X units), with a X% share.
From 2012 to 2025, the average annual rate of growth in terms of volume to the United States totaled X%. Exports to the other major destinations recorded the following average annual rates of exports growth: Canada (X% per year) and the UK (X% per year).
In value terms, the United States ($X) remains the key foreign market for passenger cars exports from Vietnam, comprising X% of total exports. The second position in the ranking was taken by Canada ($X), with a X% share of total exports. It was followed by the UK, with a X% share.
From 2012 to 2025, the average annual growth rate of value to the United States totaled X%. Exports to the other major destinations recorded the following average annual rates of exports growth: Canada (X% per year) and the UK (X% per year).
Export Prices by Country
In 2025, the average passenger car export price amounted to $X thousand per unit, falling by X% against the previous year. In general, the export price continues to indicate a relatively flat trend pattern. The most prominent rate of growth was recorded in 2015 an increase of X%. As a result, the export price attained the peak level of $X thousand per unit. From 2016 to 2025, the average export prices remained at a somewhat lower figure.
There were significant differences in the average prices for the major export markets. In 2025, amid the top suppliers, the country with the highest price was Canada ($X thousand per unit), while the average price for exports to the UK ($X thousand per unit) was amongst the lowest.
From 2012 to 2025, the most notable rate of growth in terms of prices was recorded for supplies to Canada (X%), while the prices for the other major destinations experienced more modest paces of growth.
Passenger Car Imports
Imports into Vietnam
Passenger car imports into Vietnam skyrocketed to X units in 2025, rising by X% compared with 2023. In general, imports recorded a strong expansion. The pace of growth appeared the most rapid in 2014 when imports increased by X% against the previous year. Over the period under review, imports hit record highs at X units in 2022; however, from 2023 to 2025, imports remained at a lower figure.
In value terms, passenger car imports soared to $X in 2025. Overall, imports posted a significant increase. The most prominent rate of growth was recorded in 2014 with an increase of X% against the previous year. Imports peaked at $X in 2022; however, from 2023 to 2025, imports failed to regain momentum.
Imports by Country
Thailand (X units), Indonesia (X units) and China (X units) were the main suppliers of passenger car imports to Vietnam, with a combined X% share of total imports.
From 2012 to 2025, the most notable rate of growth in terms of purchases, amongst the main suppliers, was attained by Indonesia (with a CAGR of X%), while imports for the other leaders experienced more modest paces of growth.
In value terms, the largest passenger car suppliers to Vietnam were Thailand ($X), Indonesia ($X) and Japan ($X), together comprising X% of total imports.
Among the main suppliers, Indonesia, with a CAGR of X%, recorded the highest growth rate of the value of imports, over the period under review, while purchases for the other leaders experienced more modest paces of growth.
Import Prices by Country
The average passenger car import price stood at $X thousand per unit in 2025, falling by X% against the previous year. Over the period under review, the import price, however, saw a strong increase. The growth pace was the most rapid in 2013 when the average import price increased by X%. Over the period under review, average import prices reached the peak figure at $X thousand per unit in 2023, and then declined in the following year.
There were significant differences in the average prices amongst the major supplying countries. In 2025, amid the top importers, the country with the highest price was Germany ($X thousand per unit), while the price for China ($X thousand per unit) was amongst the lowest.
From 2012 to 2025, the most notable rate of growth in terms of prices was attained by South Korea (X%), while the prices for the other major suppliers experienced more modest paces of growth.
Frequently Asked Questions (FAQ) :
The countries with the highest volumes of consumption in 2024 were China, India and the United States, together comprising 50% of global consumption.
The countries with the highest volumes of production in 2024 were China, India and Japan, together comprising 57% of global production.
In value terms, the largest passenger car suppliers to Vietnam were Thailand, Indonesia and Japan, with a combined 83% share of total imports.
In value terms, the United States remains the key foreign market for passenger cars exports from Vietnam, comprising 64% of total exports. The second position in the ranking was held by Canada, with a 27% share of total exports. It was followed by the UK, with a 1.9% share.
In 2024, the average passenger car export price amounted to $17 thousand per unit, falling by -17.4% against the previous year. In general, the export price recorded a relatively flat trend pattern. The pace of growth appeared the most rapid in 2015 when the average export price increased by 63% against the previous year. As a result, the export price reached the peak level of $26 thousand per unit. From 2016 to 2024, the average export prices failed to regain momentum.
The average passenger car import price stood at $20 thousand per unit in 2024, declining by -5.8% against the previous year. Over the period under review, the import price, however, continues to indicate strong growth. The most prominent rate of growth was recorded in 2013 an increase of 61%. Over the period under review, average import prices hit record highs at $21 thousand per unit in 2023, and then fell in the following year.
This report provides a comprehensive view of the passenger car industry in Vietnam, tracking demand, supply, and trade flows across the national value chain. It explains how demand across key channels and end-use segments shapes consumption patterns, while also mapping the role of input availability, production efficiency, and regulatory standards on supply.
Beyond headline metrics, the study benchmarks prices, margins, and trade routes so you can see where value is created and how it moves between domestic suppliers and international partners. The analysis is designed to support strategic planning, market entry, portfolio prioritization, and risk management in the passenger car landscape in Vietnam.
Domestic demand is shaped by both household and industrial usage, with trade flows linking local supply to imports and exports.
Pricing dynamics reflect unit values, freight costs, exchange rates, and regulatory shifts that affect sourcing decisions.
Supply depends on input availability and production efficiency, creating a distinct national cost curve.
Market concentration varies by segment, creating different competitive landscapes and entry barriers.
The 2035 outlook highlights where capacity investment and demand growth are most aligned within the country.
Report scope
The report combines market sizing with trade intelligence and price analytics for Vietnam. It covers both historical performance and the forward outlook to 2035, allowing you to compare cycles, structural shifts, and policy impacts.
Market size and growth in value and volume terms
Consumption structure by end-use segments
Production capacity, output, and cost dynamics
Trade flows, exporters, importers, and balances
Price benchmarks, unit values, and margin signals
Competitive context and market entry conditions
Product coverage
Prodcom 29102100 - Vehicles with spark-ignition engine of a cylinder capacity. 1 .500 cm., new
Prodcom 29102230 - Motor vehicles with a petrol engine > 1 .500 cm. (including motor caravans of a capacity > 3 .000 cm.) (excluding vehicles for transporting . .10 persons, snowmobiles, golf cars and similar vehicles)
Prodcom 29102250 - Motor caravans with a spark-ignition internal combustion reciprocating piston engine of a cylinder capacity > 1 .500 cm. but . 3 .000 cm.
Prodcom 29102310 - Motor vehicles with a diesel or semi-diesel engine . 1 .500 cm. (excluding vehicles for transporting . .10 persons, s nowmobiles, golf cars and similar vehicles)
Prodcom 29102330 - Motor vehicles with a diesel or semi-diesel engine > 1 .500 cm. but . 2 .500 cm. (excluding vehicles for transporting . .10 persons, motor caravans, snowmobiles, golf cars and similar vehicles)
Prodcom 29102340 - Motor vehicles with a diesel or semi-diesel engine > 2 .500 cm. (excluding vehicles for transporting . .10 persons, motor caravans, snowmobiles, golf cars and similar vehicles)
Prodcom 29102353 - Motor caravans with a compression-ignition internal combustion piston engine (diesel or semi-diesel) of a cylinder capacity > 1 .500 cm. but . 2 .500 cm.
Prodcom 29102355 - Motor caravans with a compression-ignition internal combustion piston engine (diesel or semi-diesel) of a cylinder capacity > 2 .500 cm.
Prodcom 29102400 - Other motor vehicles for the transport of persons (excluding vehicles for transporting . .10 persons, snowmobiles, golf cars and similar vehicles)
Prodcom 29102410 - Motor vehicles, with both spark-ignition or compression-ignition internal combustion piston engine and electric motor as motors for propulsion, other than those capable of being charged by plugging to external source of electric power
Prodcom 29102430 - Motor vehicles, with both spark-ignition or compression-ignition internal combustion piston engine and electric motor as motors for propulsion, capable of being charged by plugging to external source of electric power
Prodcom 29102450 - Motor vehicles, with only electric motor for propulsion
Prodcom 29102490 - Other motor vehicles for the transport of persons (excluding vehicles with only electric motor for propulsion , vehicles for transporting u2265 10 persons, snowmobiles, golf cars and similar vehicles)
Country coverage
Vietnam
Country profile and benchmarks
This report provides a consistent view of market size, trade balance, prices, and per-capita indicators for Vietnam. The profile highlights demand structure and trade position, enabling benchmarking against regional and global peers.
Methodology
The analysis is built on a multi-source framework that combines official statistics, trade records, company disclosures, and expert validation. Data are standardized, reconciled, and cross-checked to ensure consistency across time series.
International trade data (exports, imports, and mirror statistics)
National production and consumption statistics
Company-level information from financial filings and public releases
Price series and unit value benchmarks
Analyst review, outlier checks, and time-series validation
All data are normalized to a common product definition and mapped to a consistent set of codes. This ensures that comparisons across time are aligned and actionable.
Forecasts to 2035
The forecast horizon extends to 2035 and is based on a structured model that links passenger car demand and supply to macroeconomic indicators, trade patterns, and sector-specific drivers. The model captures both cyclical and structural factors and reflects known policy and technology shifts in Vietnam.
Historical baseline: 2012-2025
Forecast horizon: 2026-2035
Scenario-based sensitivity to income growth, substitution, and regulation
Capacity and investment outlook for major producing companies
Each projection is built from national historical patterns and the broader regional context, allowing the report to show where growth is concentrated and where risks are elevated.
Price analysis and trade dynamics
Prices are analyzed in detail, including export and import unit values, regional spreads, and changes in trade costs. The report highlights how seasonality, freight rates, exchange rates, and supply disruptions influence pricing and margins.
Price benchmarks by country and sub-region
Export and import unit value trends
Seasonality and calendar effects in trade flows
Price outlook to 2035 under baseline assumptions
Profiles of market participants
Key producers, exporters, and distributors are profiled with a focus on their operational scale, geographic footprint, product mix, and market positioning. This helps identify competitive pressure points, partnership opportunities, and routes to differentiation.
Business focus and production capabilities
Geographic reach and distribution networks
Cost structure and pricing strategy indicators
Compliance, certification, and sustainability context
How to use this report
Quantify domestic demand and identify the most attractive segments
Evaluate export opportunities and prioritize target destinations
Track price dynamics and protect margins
Benchmark performance against leading competitors
Build evidence-based forecasts for investment decisions
This report is designed for manufacturers, distributors, importers, wholesalers, investors, and advisors who need a clear, data-driven picture of passenger car dynamics in Vietnam.
FAQ
What is included in the passenger car market in Vietnam?
The market size aggregates consumption and trade data, presented in both value and volume terms.
How are the forecasts to 2035 built?
The projections combine historical trends with macroeconomic indicators, trade dynamics, and sector-specific drivers.
Does the report cover prices and margins?
Yes, it includes export and import unit values, regional spreads, and a pricing outlook to 2035.
Which benchmarks are included?
The report benchmarks market size, trade balance, prices, and per-capita indicators for Vietnam.
Can this report support market entry decisions?
Yes, it highlights demand hotspots, trade routes, pricing trends, and competitive context.
1. INTRODUCTION
Making Data-Driven Decisions to Grow Your Business
Market Volume, In Physical Terms: Historical Data (2012–2025) and Forecast (2026–2035)
Market Value: Historical Data (2012–2025) and Forecast (2026–2035)
Per Capita Consumption: Historical Data (2012–2025) and Forecast (2026–2035)
Imports, In Physical Terms, By Country, 2012–2025
Imports, In Value Terms, By Country, 2012–2025
Import Prices, By Country, 2012–2025
Exports, In Physical Terms, By Country, 2012–2025
Exports, In Value Terms, By Country, 2012–2025
Export Prices, By Country, 2012–2025
LIST OF FIGURES
Market Volume, In Physical Terms: Historical Data (2012–2025) and Forecast (2026–2035)
Market Value: Historical Data (2012–2025) and Forecast (2026–2035)
Market Structure – Domestic Supply vs. Imports, in Physical Terms: Historical Data (2012–2025) and Forecast (2026–2035)
Market Structure – Domestic Supply vs. Imports, in Value Terms: Historical Data (2012–2025) and Forecast (2026–2035)
Trade Balance, In Physical Terms: Historical Data (2012–2025) and Forecast (2026–2035)
Trade Balance, In Value Terms: Historical Data (2012–2025) and Forecast (2026–2035)
Per Capita Consumption: Historical Data (2012–2025) and Forecast (2026–2035)
Market Volume Forecast to 2035
Market Value Forecast to 2035
Market Size and Growth, By Product
Average Per Capita Consumption, By Product
Exports and Growth, By Product
Export Prices and Growth, By Product
Production Volume and Growth
Exports and Growth
Export Prices and Growth
Market Size and Growth
Per Capita Consumption
Imports and Growth
Import Prices
Production, In Physical Terms: Historical Data (2012–2025) and Forecast (2026–2035)
Production, In Value Terms: Historical Data (2012–2025) and Forecast (2026–2035)
Imports, In Physical Terms: Historical Data (2012–2025) and Forecast (2026–2035)
Imports, In Value Terms: Historical Data (2012–2025) and Forecast (2026–2035)
Imports, In Physical Terms, By Country, 2025
Imports, In Physical Terms, By Country, 2012–2025
Imports, In Value Terms, By Country, 2012–2025
Import Prices, By Country, 2012–2025
Exports, In Physical Terms: Historical Data (2012–2025) and Forecast (2026–2035)
Exports, In Value Terms: Historical Data (2012–2025) and Forecast (2026–2035)
Exports, In Physical Terms, By Country, 2025
Exports, In Physical Terms, By Country, 2012–2025
Exports, In Value Terms, By Country, 2012–2025
Export Prices, By Country, 2012–2025
Feb 9, 2026
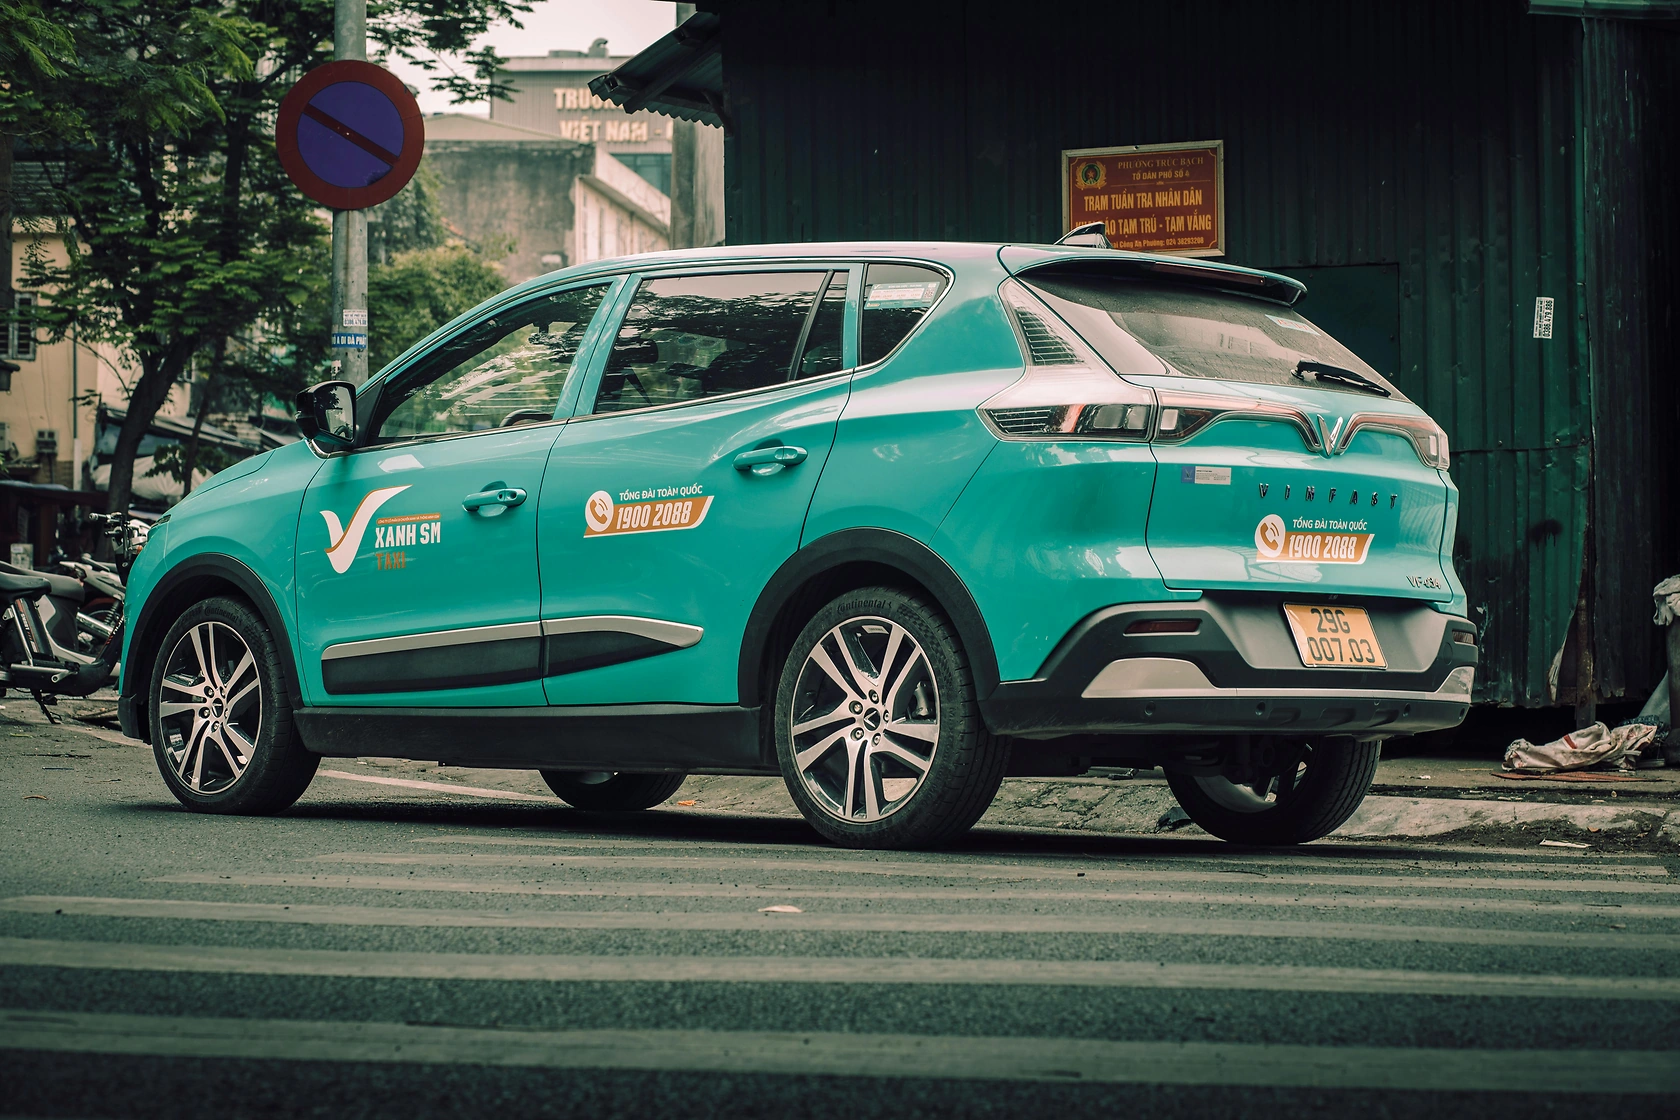
VinFast Projects 300,000 EV Deliveries in 2026, Emphasizes Asian Growth
Vietnamese automaker VinFast projects 300,000 EV deliveries in 2026, driven by Asian market expansion and new model launches, with earnings due in March.
VinFast Reports Wider Quarterly Loss Amid Expansion Efforts
VinFast's Q3 2025 financial results show a widening net loss to $910.85 million despite a 47% revenue growth, as the company spends heavily on international expansion amidst intense competition.
VinFast Q2 Loss Widens to $812M Amid Global Expansion Push
VinFast reports a larger Q2 2025 net loss of $812 million despite a rise in vehicle deliveries and revenue, as it aggressively invests in its global expansion strategy.