Italy Passenger Cars Market 2026 Analysis and Forecast to 2035
Executive Summary
The Italian passenger car market represents a mature yet dynamically evolving sector within the European automotive landscape. Characterized by a strong import dependency, a globally renowned domestic production segment focused on premium and luxury vehicles, and a consumer base undergoing a significant transition, the market is at a pivotal juncture. This report provides a comprehensive 2026 analysis of the market's structure, key performance indicators, and competitive dynamics, extending its view through a strategic forecast to 2035. The analysis is grounded in a robust methodology, synthesizing the latest available trade, production, and macroeconomic data to deliver actionable insights for stakeholders across the value chain.
Core to the current market state is the substantial reliance on imported vehicles to satisfy domestic demand. In 2024, Germany solidified its position as the preeminent supplier, accounting for 31% of Italy's import value with shipments worth $11.6 billion. Spain followed as a significant source, holding a 13% share with $5.1 billion in exports to Italy. This import landscape underscores the competitive intensity within the Italian showroom, where multinational volume manufacturers vie for market share against the backdrop of a distinctive domestic manufacturing base.
Italy's automotive industry, while not matching the scale of global giants like China (28M units), India (21M units), or Japan (7.8M units), maintains a critical strategic and economic role through its focus on high-value segments. The export performance of Italian-made passenger cars, with an average price of $40 thousand per unit in 2024, highlights this premium positioning. Key export destinations include Germany ($2.4B), France ($1.8B), and the United States ($1.8B), which together constituted 43% of total export value. The interplay between this specialized production, evolving consumer preferences, regulatory pressures, and global supply chain realities forms the core narrative of the market's trajectory toward 2035.
Market Overview
The Italian passenger car market is defined by its status as a major consumption hub within the European Union, though its scale is distinct from the world's largest automotive markets. In a global context, the highest volumes of consumption in 2024 were concentrated in China (22M units), India (20M units), and the United States (9.1M units), which together accounted for approximately half of global demand. Italy's market operates on a smaller volume scale but remains one of Europe's most significant, influenced by unique regional economic conditions, urbanization patterns, and a deep-seated automotive culture.
Market dynamics are profoundly shaped by Italy's position within international trade networks. The country operates with a significant trade deficit in passenger cars by volume, importing a far greater number of vehicles than it exports. This structural characteristic indicates that domestic production is insufficient to meet local demand, necessitating large-scale inflows from other manufacturing centers. However, the value-based trade picture is nuanced due to the high average price of Italian exports, which mitigates the trade gap in monetary terms and reflects the specialized nature of the homegrown industry.
The market's evolution over the past decade has been marked by recovery from historical crises, followed by periods of growth constrained by economic volatility, supply chain disruptions, and a rapid regulatory shift towards electrification. Consumer behavior has shown increasing sensitivity to total cost of ownership, environmental incentives, and technological features. The regulatory environment, heavily influenced by EU-wide directives on emissions and safety, acts as a powerful exogenous force, accelerating the transition away from traditional internal combustion engines and reshaping the available product portfolio for Italian consumers.
Demographic and infrastructural factors also play a crucial role in defining the market. Italy's aging population, high rate of urban density, and well-developed public transport in certain regions influence vehicle usage patterns and ownership models. Concurrently, the development of charging infrastructure for electric vehicles (EVs) remains a critical challenge and opportunity, with its rollout pace being a key determinant of EV adoption rates. The convergence of these economic, regulatory, and social factors creates a complex operating environment for all market participants.
Demand Drivers and End-Use
Demand for passenger cars in Italy is driven by a multifaceted set of economic, regulatory, and social factors. At the macroeconomic level, consumer confidence, disposable income levels, and access to credit are primary determinants of purchasing propensity. Periods of economic growth typically correlate with increased vehicle sales, while recessions or uncertainties lead to deferred purchases and an aging vehicle fleet. The replacement cycle for cars, which averages over a decade in Italy, is a fundamental underlying driver, as pent-up demand can be released when economic conditions improve.
Government policy is arguably the most potent direct driver in the current market phase. A complex system of incentives and penalties, often revised annually, heavily steers consumer choice. Purchase incentives for low- and zero-emission vehicles, such as electric and plug-in hybrid cars, directly stimulate demand in these segments. Conversely, increasing circulation taxes for high-emission vehicles and restrictions on diesel and older petrol cars entering urban low-emission zones (ZTLs) act as strong disincentives, pushing consumers towards newer, cleaner models.
The evolving end-use landscape reflects broader societal shifts. Key consumer segments and their motivations include:
- Private Individual Buyers: Motivated by personal mobility needs, cost considerations, and increasingly, environmental consciousness. This segment is highly sensitive to purchase incentives, fuel prices, and perceived technology reliability.
- Corporate and Fleet Buyers: A critical segment that drives volume and early adoption of new technologies. Decisions are based on total cost of ownership, tax advantages for company cars, corporate sustainability targets, and brand image requirements.
- Car Rental and Leasing Companies: These players manage large, rotating fleets and influence both new car purchases and the nearly-new used car market. Their procurement strategies are shaped by residual value forecasts, maintenance costs, and customer demand for specific fuel types.
- Shared Mobility Services: While still a nascent segment in terms of total vehicle stock, ride-hailing and car-sharing services represent a growing source of demand for specific vehicle types, often favoring compact, efficient, and connected models.
Technological adoption and consumer perception of new powertrains constitute a major demand variable. Range anxiety, charging convenience, and upfront cost parity remain significant barriers to mass EV adoption, despite growing environmental awareness. Meanwhile, hybrid vehicles have served as a successful transitional technology, capturing significant market share by offering a compromise between familiarity and improved efficiency. The pace at which these barriers are lowered will be the single most important factor shaping demand composition through the forecast period to 2035.
Supply and Production
Italy's passenger car production ecosystem is bifurcated, consisting of large-scale manufacturing plants owned by international groups and the iconic, specialized facilities of Italian luxury and performance marques. In global terms, the largest producers in 2024 were China (28M units), India (21M units), and Japan (7.8M units), which collectively held a 57% share of world output. Italy's production volume is a fraction of these leaders, but its strategic importance lies in the exceptional value and brand prestige it generates, concentrated in the premium and hypercar segments.
The domestic production of volume-oriented cars is primarily managed by Stellantis, the multinational conglomerate formed from the merger of Fiat Chrysler Automobiles and PSA Group. Key models produced in Italian plants, such as the Fiat Panda and the Jeep Compass, cater to the European B-SUV and A-segment markets. The competitiveness of these plants is under constant pressure from lower-cost manufacturing locations within Europe and globally, making their future dependent on model allocation decisions, productivity improvements, and success in the transition to electric vehicle production.
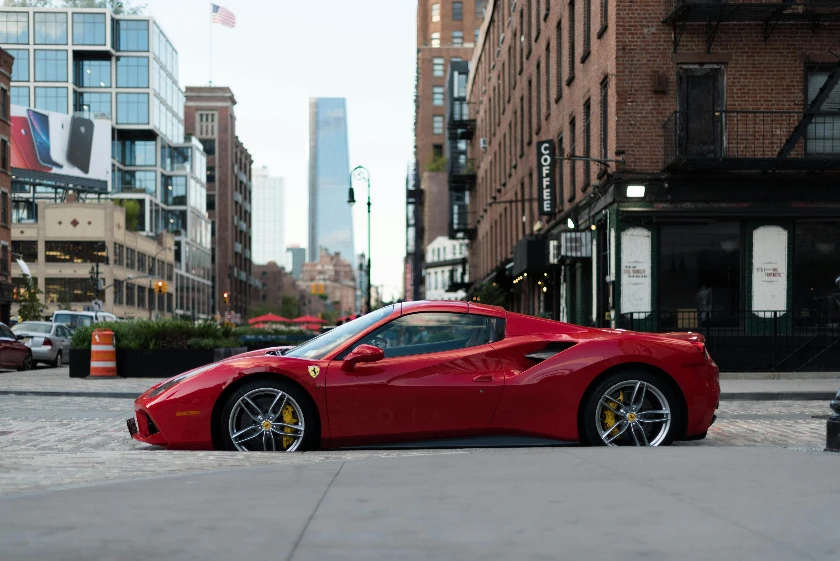
The heart of Italy's automotive identity and high-value export engine is its cluster of luxury and specialty manufacturers. Brands like Ferrari, Lamborghini, Maserati, and Alfa Romeo (in its higher-end executions) operate production facilities that are as much centers of craftsmanship and innovation as they are assembly lines. These manufacturers are not volume-driven; they compete on exclusivity, performance, design, and technological sophistication. Their business models are characterized by high margins, strong brand loyalty, and a global clientele, insulating them somewhat from the cyclical downturns of the mass market.
The supply chain supporting this production landscape is a critical vulnerability and a focus for transformation. The shift to electrification necessitates a complete reconfiguration of component sourcing, moving emphasis from internal combustion engine parts to batteries, electric motors, and power electronics. Italy's dependency on imports for battery cells and raw materials presents a strategic challenge. Developing a localized or European battery supply chain, upskilling the workforce for new manufacturing processes, and retooling existing facilities represent monumental tasks that will define the resilience and future of Italian automotive production through 2035.
Trade and Logistics
Italy's passenger car market is deeply integrated into European and global trade flows, with imports far exceeding exports in unit terms. This trade structure is a defining feature, ensuring a highly competitive and varied vehicle offering for Italian consumers but also highlighting a dependency on foreign manufacturing capacity. The logistics network, comprising roll-on/roll-off (Ro-Ro) shipping, specialized trucking, and rail links, is a vital but often overlooked component of market efficiency, affecting lead times, inventory costs, and ultimately, vehicle availability and price.
The import landscape is dominated by intra-European trade, reflecting the integrated nature of the EU single market. In value terms, Germany stands as the unequivocal leader, having supplied $11.6 billion worth of passenger cars to Italy in 2024, constituting 31% of total import value. This dominance is driven by the strength of the German premium brands (Audi, BMW, Mercedes-Benz, Volkswagen) which hold substantial market share in Italy. Spain holds the second position, with $5.1 billion in exports (13% share), leveraging its large-scale production plants for volume models from the Volkswagen Group, Stellantis, and others. Poland follows as a notable supplier with a 6% share, indicative of the growing importance of Central European manufacturing hubs.
On the export side, Italy sends its domestically produced vehicles to discerning markets worldwide. In 2024, the leading destinations by value were Germany ($2.4B), France ($1.8B), and the United States ($1.8B). Together, these three markets accounted for 43% of Italy's total passenger car export value. This triangulation underscores the global appeal of Italian automotive excellence: Germany and France as key luxury markets within Europe, and the United States as the paramount overseas market for high-performance and luxury vehicles. A further 22% of exports were distributed across a diverse group of European nations, including the UK, Belgium, Spain, Austria, Poland, and several Balkan states, illustrating a broad regional footprint.
The price differential between imports and exports reveals the qualitative asymmetry of Italy's automotive trade. The average import price in 2024 was $27 thousand per unit, having surged by 19% against the previous year. This increase reflects a mix of inflationary pressures, a richer model mix, and the higher cost of new technologies like electrification. In stark contrast, the average export price was significantly higher at $40 thousand per unit. This substantial premium of nearly 50% is a direct consequence of the luxury and performance focus of Italian car exports. It demonstrates that while Italy imports a high volume of mid-range vehicles, it exports a lower volume of very high-value products, creating a unique trade profile that balances economic value with industrial specialization.
Price Dynamics
Price formation in the Italian passenger car market is influenced by a complex interplay of manufacturer pricing strategies, currency fluctuations, commodity costs, competitive intensity, and government taxation. The final price paid by a consumer includes the net list price, value-added tax (VAT), registration taxes, and potentially, ownership taxes. Manufacturer pricing must account for production costs, desired margins, competitor positioning, and the value of optional extras, which have become a significant profit center, especially in the premium segments.
The long-term trend for both import and export prices has been upward, as indicated by historical data. The average passenger car import price stood at $27 thousand per unit in 2024, concluding a period of temperate expansion where its price increased at an average annual rate of +4.3% over the preceding twelve years. Similarly, the average export price reached $40 thousand per unit in 2024, following a more pronounced resilient expansion at an average annual rate of +6.2% over the same period. These trends underscore the general inflation of vehicle content, technology, and regulatory compliance costs over the past decade.
However, these trajectories are not smooth and are subject to noticeable fluctuations. For instance, the export price saw a significant 26% year-on-year increase in 2021, likely driven by post-pandemic pent-up demand for luxury goods, supply constraints that limited discounts, and a favorable model mix. It peaked at $41 thousand per unit in 2023 before a modest decline to $40 thousand in 2024. The import price, on the other hand, recorded a sharp 19% surge in 2024 alone, attaining its peak level. This spike can be attributed to a confluence of factors, including persistent inflationary pressures on raw materials and logistics, a continued shift in consumer preference towards more expensive SUV and electric models, and the gradual normalization of post-pandemic discounts and incentives.
Looking forward, price dynamics will be fundamentally reshaped by the transition to electric mobility. The high cost of battery packs currently places BEVs at a significant price premium over equivalent internal combustion engine vehicles, a gap only partially bridged by government incentives. As battery technology improves and economies of scale are realized, a gradual reduction in this premium is expected, which will be a critical trigger for mass-market adoption. Concurrently, the potential for new pricing models, such as subscription services or bundled mobility packages, may decouple price from outright ownership and introduce new variables into the market's price structure through 2035.
Competitive Landscape
The competitive arena in Italy is intensely contested, featuring a diverse array of players ranging from global volume manufacturers to exclusive niche brands and a robust network of independent importers and dealers. Market share is fragmented, with no single brand holding a dominant position, though several groups consistently vie for leadership. The competitive setting is further complicated by the parallel used car market, which acts as a direct competitor to new vehicle sales, especially in times of economic constraint or during model transition periods.
The market can be segmented into several key competitive tiers:
- Volume Manufacturers (Stellantis, Volkswagen Group, Renault-Nissan, Hyundai-Kia, Toyota): These groups compete aggressively on price, financing offers, warranty packages, and dealer network coverage. Stellantis, with its deep historical roots via Fiat, holds a strong but challenged position. The Volkswagen Group, through its core VW brand as well as Seat/Cupra and Skoda, is a formidable competitor. Asian manufacturers like Toyota and Hyundai-Kia have gained significant ground through strong hybrid offerings and value propositions.
- German Premium Brands (Audi, BMW, Mercedes-Benz): This triad commands the premium segment, competing on technology, performance, brand prestige, and leasing/financing services for corporate and private clients. Their competition is as much with each other as it is with the volume manufacturers' top-tier models.
- Italian Luxury/Specialty Brands (Ferrari, Lamborghini, Maserati, Alfa Romeo): These manufacturers operate in a rarefied space. Ferrari and Lamborghini compete in the ultra-luxury/supercar segment globally. Maserati and Alfa Romeo target a broader premium performance segment, competing directly with German rivals and other sport-luxury marques.
- Other Premium & Niche Brands (Volvo, Jaguar Land Rover, Tesla, DS, etc.): This group includes established players like Volvo, which has strongly pivoted to electrification, and disruptive entrants like Tesla, which competes primarily through direct sales, software innovation, and a pure-electric ecosystem.
Distribution and retail are critical battlegrounds. The traditional dealer franchise model is being pressured by the need for massive investment in EV charging infrastructure, showroom upgrades, and technician training. Simultaneously, direct-to-consumer sales models, as pioneered by Tesla and adopted by other new entrants, challenge the status quo. The ability of incumbent dealers to adapt their business models, offer seamless omnichannel experiences, and provide superior customer service in a digitally-enabled environment will be a key differentiator. Furthermore, the competitive landscape is increasingly defined by software and connected services, turning the car into a platform for ongoing revenue, which favors manufacturers with strong in-house tech capabilities.
Methodology and Data Notes
This report on the Italy Passenger Cars Market employs a rigorous, multi-layered methodology designed to ensure analytical depth, accuracy, and strategic relevance. The foundation of the analysis is built upon official statistical data, which provides an objective and consistent quantitative framework. Primary sources include detailed international trade databases, which track the value and volume of passenger car imports and exports using harmonized system (HS) codes, as well as national industrial production statistics and vehicle registration authorities' data. These datasets are cleaned, cross-referenced, and normalized to create a coherent time series.
Market sizing and structural analysis integrate this hard data with modeled estimates for domestic production absorption and demand triangulation. Where direct official figures for domestic consumption are not published, a standard industry approach is applied: Domestic Market Size = Domestic Production + Total Imports - Total Exports. This calculation provides a reliable approximation of the physical volume of cars entering the Italian market in a given period. All growth rates, market shares, and rankings presented are derived from these underlying absolute figures or are clearly stated as analytical estimates based on observed trends and industry factors.
The forecast component of the report, extending to 2035, is developed through a scenario-based modeling approach. It does not rely on singular point predictions but considers a range of potential outcomes based on the interplay of key variables. The model incorporates:
- Macroeconomic Drivers: Projections for Italian and Eurozone GDP growth, consumer confidence indices, interest rates, and employment trends.
- Regulatory & Policy Framework: Analysis of existing and anticipated EU and Italian regulations on emissions (Euro 7), safety, and the phase-out timelines for internal combustion engines, including the impact of incentive schemes.
- Technology Adoption Curves: S-curve modeling for the penetration of battery electric vehicles (BEVs), plug-in hybrids (PHEVs), and other powertrains, informed by infrastructure rollout plans, battery cost projections, and consumer acceptance studies.
- Competitive Intelligence: Assessment of announced manufacturer product pipelines, production capacity investments, and market strategies.
All data is presented with clear referencing to its source and year. Figures for trade, production, and prices are anchored to the latest full year of available data at the time of the 2026 report edition. The forecast horizon to 2035 is structured to illustrate probable pathways, critical inflection points, and strategic risks and opportunities, providing a tool for long-term planning rather than a precise numerical prediction. This methodology ensures the report remains an evidence-based, actionable resource for decision-makers.
Outlook and Implications
The trajectory of the Italian passenger car market from 2026 to 2035 will be characterized by transformative change rather than incremental evolution. The dominant theme will be the accelerated but uneven transition to electric mobility, mandated by EU regulations and propelled by advancing technology and shifting consumer sentiment. This transition will not be a simple swap of powertrains; it will fundamentally reshape the industry's value chain, competitive dynamics, consumer economics, and even the relationship between the driver and the vehicle. Italy, with its unique industrial composition and market dependencies, faces distinct challenges and opportunities in this new landscape.
For domestic manufacturing, the outlook presents a dual challenge. The volume production segment, centered on Stellantis, must secure its future through successful electrification of its model lineup and the retention of competitive production within Italy. This hinges on significant investment, supportive industrial policy, and the development of a local battery ecosystem to avoid over-reliance on Asian suppliers. For the luxury and performance sector, the electrification imperative is also paramount. The challenge here is to translate the emotional appeal, performance characteristics, and brand essence of marques like Ferrari and Lamborghini into an electric paradigm, while managing the substantial R&D costs involved. Success could further enhance Italy's reputation for automotive innovation and high-value engineering.
The implications for market structure and competition are profound. The competitive set will expand to include new players from the tech sector and China, who are agile and unencumbered by legacy investments in internal combustion technology. Incumbent volume manufacturers will see their margins squeezed by the high costs of the transition, potentially leading to further consolidation. The premium German brands are well-positioned due to their financial resources and technological depth, but they too face the challenge of defending their territory against Tesla and others. The retail and aftermarket sectors will undergo radical change, with reduced service revenue from EVs necessitating new business models centered on software, connectivity, and energy services.
Strategic implications for stakeholders are wide-ranging. For policymakers, the priority must be to manage the transition in a socially equitable manner, ensuring the automotive workforce is reskilled and that charging infrastructure deployment keeps pace with adoption to avoid creating regional disparities. For investors, opportunities lie in the new supply chain for electrification (e.g., components, charging infrastructure, battery recycling) and in companies that enable the digital and connected car ecosystem. For corporate fleet managers, strategic vehicle procurement will become a key lever for achieving sustainability targets and managing total cost of ownership in a volatile energy price environment. Ultimately, the market that emerges by 2035 will be more diverse in terms of propulsion technologies, more integrated with the digital world, and more focused on services and sustainability, demanding adaptability and foresight from all participants in the Italian automotive arena.
Frequently Asked Questions (FAQ) :
The countries with the highest volumes of consumption in 2024 were China, India and the United States, with a combined 50% share of global consumption.
The countries with the highest volumes of production in 2024 were China, India and Japan, with a combined 57% share of global production.
In value terms, Germany constituted the largest supplier of passenger cars to Italy, comprising 31% of total imports. The second position in the ranking was taken by Spain, with a 13% share of total imports. It was followed by Poland, with a 6% share.
In value terms, Germany, France and the United States appeared to be the largest markets for passenger car exported from Italy worldwide, together comprising 43% of total exports. The UK, Belgium, Spain, Austria, Poland, Bulgaria, Slovenia, Romania, Hungary and Serbia lagged somewhat behind, together accounting for a further 22%.
The average passenger car export price stood at $40 thousand per unit in 2024, declining by -2.8% against the previous year. In general, export price indicated a resilient expansion from 2012 to 2024: its price increased at an average annual rate of +6.2% over the last twelve years. The trend pattern, however, indicated some noticeable fluctuations being recorded throughout the analyzed period. Based on 2024 figures, passenger car export price increased by +87.0% against 2016 indices. The pace of growth was the most pronounced in 2021 when the average export price increased by 26% against the previous year. Over the period under review, the average export prices reached the maximum at $41 thousand per unit in 2023, and then fell modestly in the following year.
The average passenger car import price stood at $27 thousand per unit in 2024, surging by 19% against the previous year. Overall, import price indicated a temperate expansion from 2012 to 2024: its price increased at an average annual rate of +4.3% over the last twelve years. The trend pattern, however, indicated some noticeable fluctuations being recorded throughout the analyzed period. Based on 2024 figures, passenger car import price increased by +80.0% against 2015 indices. As a result, import price attained the peak level and is likely to continue growth in the immediate term.
This report provides a comprehensive view of the passenger car industry in Italy, tracking demand, supply, and trade flows across the national value chain. It explains how demand across key channels and end-use segments shapes consumption patterns, while also mapping the role of input availability, production efficiency, and regulatory standards on supply.
Beyond headline metrics, the study benchmarks prices, margins, and trade routes so you can see where value is created and how it moves between domestic suppliers and international partners. The analysis is designed to support strategic planning, market entry, portfolio prioritization, and risk management in the passenger car landscape in Italy.
Quick navigation
Key findings
- Domestic demand is shaped by both household and industrial usage, with trade flows linking local supply to imports and exports.
- Pricing dynamics reflect unit values, freight costs, exchange rates, and regulatory shifts that affect sourcing decisions.
- Supply depends on input availability and production efficiency, creating a distinct national cost curve.
- Market concentration varies by segment, creating different competitive landscapes and entry barriers.
- The 2035 outlook highlights where capacity investment and demand growth are most aligned within the country.
Report scope
The report combines market sizing with trade intelligence and price analytics for Italy. It covers both historical performance and the forward outlook to 2035, allowing you to compare cycles, structural shifts, and policy impacts.
- Market size and growth in value and volume terms
- Consumption structure by end-use segments
- Production capacity, output, and cost dynamics
- Trade flows, exporters, importers, and balances
- Price benchmarks, unit values, and margin signals
- Competitive context and market entry conditions
Product coverage
- Prodcom 29102100 - Vehicles with spark-ignition engine of a cylinder capacity. 1 .500 cm., new
- Prodcom 29102230 - Motor vehicles with a petrol engine > 1 .500 cm. (including motor caravans of a capacity > 3 .000 cm.) (excluding vehicles for transporting . .10 persons, snowmobiles, golf cars and similar vehicles)
- Prodcom 29102250 - Motor caravans with a spark-ignition internal combustion reciprocating piston engine of a cylinder capacity > 1 .500 cm. but . 3 .000 cm.
- Prodcom 29102310 - Motor vehicles with a diesel or semi-diesel engine . 1 .500 cm. (excluding vehicles for transporting . .10 persons, s nowmobiles, golf cars and similar vehicles)
- Prodcom 29102330 - Motor vehicles with a diesel or semi-diesel engine > 1 .500 cm. but . 2 .500 cm. (excluding vehicles for transporting . .10 persons, motor caravans, snowmobiles, golf cars and similar vehicles)
- Prodcom 29102340 - Motor vehicles with a diesel or semi-diesel engine > 2 .500 cm. (excluding vehicles for transporting . .10 persons, motor caravans, snowmobiles, golf cars and similar vehicles)
- Prodcom 29102353 - Motor caravans with a compression-ignition internal combustion piston engine (diesel or semi-diesel) of a cylinder capacity > 1 .500 cm. but . 2 .500 cm.
- Prodcom 29102355 - Motor caravans with a compression-ignition internal combustion piston engine (diesel or semi-diesel) of a cylinder capacity > 2 .500 cm.
- Prodcom 29102400 - Other motor vehicles for the transport of persons (excluding vehicles for transporting . .10 persons, snowmobiles, golf cars and similar vehicles)
- Prodcom 29102410 - Motor vehicles, with both spark-ignition or compression-ignition internal combustion piston engine and electric motor as motors for propulsion, other than those capable of being charged by plugging to external source of electric power
- Prodcom 29102430 - Motor vehicles, with both spark-ignition or compression-ignition internal combustion piston engine and electric motor as motors for propulsion, capable of being charged by plugging to external source of electric power
- Prodcom 29102450 - Motor vehicles, with only electric motor for propulsion
- Prodcom 29102490 - Other motor vehicles for the transport of persons (excluding vehicles with only electric motor for propulsion , vehicles for transporting u2265 10 persons, snowmobiles, golf cars and similar vehicles)
Country coverage
Country profile and benchmarks
This report provides a consistent view of market size, trade balance, prices, and per-capita indicators for Italy. The profile highlights demand structure and trade position, enabling benchmarking against regional and global peers.
Methodology
The analysis is built on a multi-source framework that combines official statistics, trade records, company disclosures, and expert validation. Data are standardized, reconciled, and cross-checked to ensure consistency across time series.
- International trade data (exports, imports, and mirror statistics)
- National production and consumption statistics
- Company-level information from financial filings and public releases
- Price series and unit value benchmarks
- Analyst review, outlier checks, and time-series validation
All data are normalized to a common product definition and mapped to a consistent set of codes. This ensures that comparisons across time are aligned and actionable.
Forecasts to 2035
The forecast horizon extends to 2035 and is based on a structured model that links passenger car demand and supply to macroeconomic indicators, trade patterns, and sector-specific drivers. The model captures both cyclical and structural factors and reflects known policy and technology shifts in Italy.
- Historical baseline: 2012-2025
- Forecast horizon: 2026-2035
- Scenario-based sensitivity to income growth, substitution, and regulation
- Capacity and investment outlook for major producing companies
Each projection is built from national historical patterns and the broader regional context, allowing the report to show where growth is concentrated and where risks are elevated.
Price analysis and trade dynamics
Prices are analyzed in detail, including export and import unit values, regional spreads, and changes in trade costs. The report highlights how seasonality, freight rates, exchange rates, and supply disruptions influence pricing and margins.
- Price benchmarks by country and sub-region
- Export and import unit value trends
- Seasonality and calendar effects in trade flows
- Price outlook to 2035 under baseline assumptions
Profiles of market participants
Key producers, exporters, and distributors are profiled with a focus on their operational scale, geographic footprint, product mix, and market positioning. This helps identify competitive pressure points, partnership opportunities, and routes to differentiation.
- Business focus and production capabilities
- Geographic reach and distribution networks
- Cost structure and pricing strategy indicators
- Compliance, certification, and sustainability context
How to use this report
- Quantify domestic demand and identify the most attractive segments
- Evaluate export opportunities and prioritize target destinations
- Track price dynamics and protect margins
- Benchmark performance against leading competitors
- Build evidence-based forecasts for investment decisions
This report is designed for manufacturers, distributors, importers, wholesalers, investors, and advisors who need a clear, data-driven picture of passenger car dynamics in Italy.
FAQ
What is included in the passenger car market in Italy?
The market size aggregates consumption and trade data, presented in both value and volume terms.
How are the forecasts to 2035 built?
The projections combine historical trends with macroeconomic indicators, trade dynamics, and sector-specific drivers.
Does the report cover prices and margins?
Yes, it includes export and import unit values, regional spreads, and a pricing outlook to 2035.
Which benchmarks are included?
The report benchmarks market size, trade balance, prices, and per-capita indicators for Italy.
Can this report support market entry decisions?
Yes, it highlights demand hotspots, trade routes, pricing trends, and competitive context.