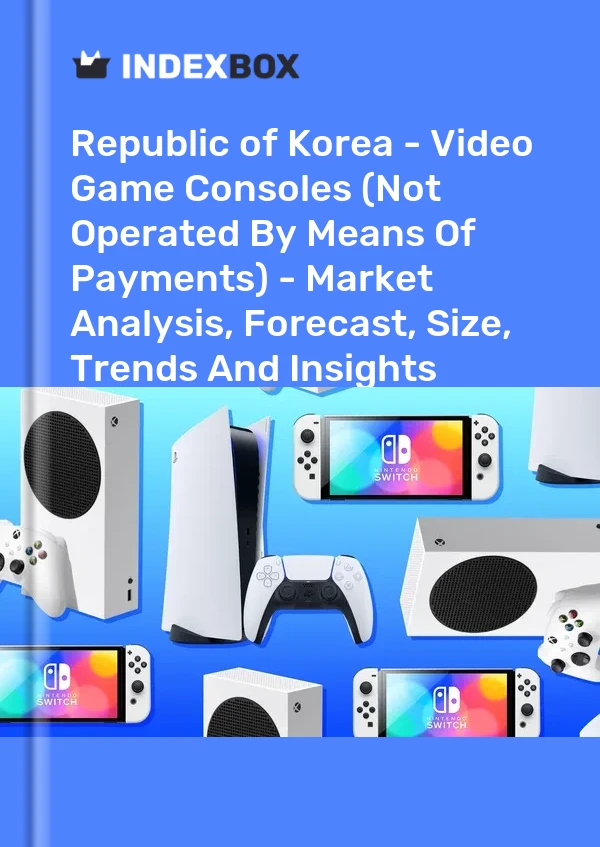
Republic of Korea - Video Game Consoles (Not Operated By Means Of Payments) - Market Analysis, Forecast, Size, Trends And Insights
Get instant access to more than 2 million reports, dashboards, and datasets on the IndexBox Platform.
View PricingVideo Game Console Price in South Korea - 2022
Contents:
- Video Game Console Price in South Korea (CIF) - 2022
- Video Game Console Price in South Korea (FOB) - 2022
- Video Game Console Imports in South Korea
- Video Game Console Exports in South Korea
Video Game Console Price in South Korea (CIF) - 2022
In December 2022, the average video game console import price amounted to $513 per unit, picking up by 19% against the previous month. In general, the import price, however, showed a slight contraction. The most prominent rate of growth was recorded in June 2022 when the average import price increased by 34% month-to-month. The import price peaked at $597 per unit in December 2021; however, from January 2022 to December 2022, import prices remained at a lower figure.
As there is only one major supplying country, the average price level is determined by prices for China.
From December 2021 to December 2022, the rate of growth in terms of prices for China amounted to -1.3% per month.
Video Game Console Price in South Korea (FOB) - 2022
In 2022, the average video game console export price amounted to $130 per unit, reducing by -4.9% against the previous year. Overall, the export price showed a deep contraction. The pace of growth appeared the most rapid in 2018 when the average export price increased by 31%. The export price peaked at $294 per unit in 2012; however, from 2013 to 2022, the export prices stood at a somewhat lower figure.
Prices varied noticeably by country of destination: amid the top suppliers, the country with the highest price was Singapore ($425 per unit), while the average price for exports to the United States ($65 per unit) was amongst the lowest.
From 2012 to 2022, the most notable rate of growth in terms of prices was recorded for supplies to Singapore (+2.4%), while the prices for the other major destinations experienced a decline.
Video Game Console Imports in South Korea
Video game console imports into South Korea rose slightly to 579K units in 2022, growing by 3.2% on 2021. Over the period under review, total imports indicated significant growth from 2019 to 2022: its volume increased at an average annual rate of +22.2% over the last three years. The trend pattern, however, indicated some noticeable fluctuations being recorded throughout the analyzed period. Based on 2022 figures, imports decreased by -3.5% against 2020 indices. The most prominent rate of growth was recorded in 2020 with an increase of 89%. As a result, imports reached the peak of 600K units. From 2021 to 2022, the growth of imports failed to regain momentum.
In value terms, video game console imports dropped to $281M in 2022. In general, total imports indicated a significant increase from 2019 to 2022: its value increased at an average annual rate of +23.6% over the last three-year period. The trend pattern, however, indicated some noticeable fluctuations being recorded throughout the analyzed period. Based on 2022 figures, imports increased by +89.0% against 2019 indices. The growth pace was the most rapid in 2020 with an increase of 73%. Imports peaked at $305M in 2021, and then reduced in the following year.
| Import of Video Game Console in South Korea (Million USD) | |||||
|---|---|---|---|---|---|
| COUNTRY | 2019 | 2020 | 2021 | 2022 | CAGR, 2019-2022 |
| China | 146 | 250 | 298 | 275 | 23.5% |
| Others | 3.1 | 7.1 | 7.0 | 6.4 | 27.3% |
| Total | 149 | 257 | 305 | 281 | 23.5% |
Top Suppliers of Video Game Console to South Korea in 2022:
- China (563.8K units)
Video Game Console Exports in South Korea
In 2022, after three years of growth, there was significant decline in overseas shipments of video game consoles (not operated by means of payments), when their volume decreased by -17.4% to 25K units. In general, exports, however, showed a significant increase. The pace of growth appeared the most rapid in 2020 with an increase of 83% against the previous year. Over the period under review, the exports hit record highs at 30K units in 2021, and then shrank notably in the following year.
In value terms, video game console exports fell dramatically to $3.2M in 2022. Overall, total exports indicated a resilient expansion from 2019 to 2022: its value increased at an average annual rate of +6.9% over the last three years. The trend pattern, however, indicated some noticeable fluctuations being recorded throughout the analyzed period. Based on 2022 figures, exports increased by +37.4% against 2020 indices. The growth pace was the most rapid in 2021 when exports increased by 75%. As a result, the exports reached the peak of $4.1M, and then declined remarkably in the following year.
| Export of Video Game Console in South Korea (Thousand USD) | |||||
|---|---|---|---|---|---|
| COUNTRY | 2019 | 2020 | 2021 | 2022 | CAGR, 2019-2022 |
| United States | 226 | 812 | 1,465 | 1,218 | 75.3% |
| Singapore | 973 | 799 | 1,462 | 1,215 | 7.7% |
| China | 27.4 | 36.5 | 295 | 245 | 107.6% |
| Hong Kong SAR | 281 | 181 | 95.7 | 152 | -18.5% |
| Japan | 94.8 | 58.8 | 175 | 145 | 15.2% |
| Mongolia | 68.9 | 30.8 | 1.1 | 27.4 | -26.5% |
| Others | 964 | 428 | 608 | 222 | -38.7% |
| Total | 2,636 | 2,346 | 4,101 | 3,224 | 6.9% |
Top Export Markets for Video Game Console from South Korea in 2022:
- United States (18.7K units)
- Singapore (2.9K units)
- China (0.7K units)
- Japan (0.6K units)
- Hong Kong SAR (0.5K units)
- Mongolia (0.4K units)
This report provides an in-depth analysis of the video game console market in Republic of Korea. Within it, you will discover the latest data on market trends and opportunities by country, consumption, production and price developments, as well as the global trade (imports and exports). The forecast exhibits the market prospects through 2030.
Product coverage:
- Prodcom 26406050 - Video game consoles (not operated by means of payments)
Country coverage:
- South Korea
Data coverage:
- Market volume and value
- Per Capita consumption
- Forecast of the market dynamics in the medium term
- Trade (exports and imports) in Republic of Korea
- Export and import prices
- Market trends, drivers and restraints
- Key market players and their profiles
Reasons to buy this report:
- Take advantage of the latest data
- Find deeper insights into current market developments
- Discover vital success factors affecting the market
This report is designed for manufacturers, distributors, importers, and wholesalers, as well as for investors, consultants and advisors.
In this report, you can find information that helps you to make informed decisions on the following issues:
- How to diversify your business and benefit from new market opportunities
- How to load your idle production capacity
- How to boost your sales on overseas markets
- How to increase your profit margins
- How to make your supply chain more sustainable
- How to reduce your production and supply chain costs
- How to outsource production to other countries
- How to prepare your business for global expansion
While doing this research, we combine the accumulated expertise of our analysts and the capabilities of artificial intelligence. The AI-based platform, developed by our data scientists, constitutes the key working tool for business analysts, empowering them to discover deep insights and ideas from the marketing data.
-
1. INTRODUCTION
Making Data-Driven Decisions to Grow Your Business
- REPORT DESCRIPTION
- RESEARCH METHODOLOGY AND AI PLATFORM
- DATA-DRIVEN DECISIONS FOR YOUR BUSINESS
- GLOSSARY AND SPECIFIC TERMS
-
2. EXECUTIVE SUMMARY
A Quick Overview of Market Performance
- KEY FINDINGS
- MARKET TRENDS This Chapter is Available Only for the Professional Edition PRO
-
3. MARKET OVERVIEW
Understanding the Current State of The Market and Its Prospects
- MARKET SIZE
- MARKET STRUCTURE
- TRADE BALANCE
- PER CAPITA CONSUMPTION
- MARKET FORECAST TO 2030
-
4. MOST PROMISING PRODUCT
Finding New Products to Diversify Your Business
This Chapter is Available Only for the Professional Edition PRO- TOP PRODUCTS TO DIVERSIFY YOUR BUSINESS
- BEST-SELLING PRODUCTS
- MOST CONSUMED PRODUCT
- MOST TRADED PRODUCT
- MOST PROFITABLE PRODUCT FOR EXPORT
-
5. MOST PROMISING SUPPLYING COUNTRIES
Choosing the Best Countries to Establish Your Sustainable Supply Chain
This Chapter is Available Only for the Professional Edition PRO- TOP COUNTRIES TO SOURCE YOUR PRODUCT
- TOP PRODUCING COUNTRIES
- TOP EXPORTING COUNTRIES
- LOW-COST EXPORTING COUNTRIES
-
6. MOST PROMISING OVERSEAS MARKETS
Choosing the Best Countries to Boost Your Exports
This Chapter is Available Only for the Professional Edition PRO- TOP OVERSEAS MARKETS FOR EXPORTING YOUR PRODUCT
- TOP CONSUMING MARKETS
- UNSATURATED MARKETS
- TOP IMPORTING MARKETS
- MOST PROFITABLE MARKETS
7. PRODUCTION
The Latest Trends and Insights into The Industry
- PRODUCTION VOLUME AND VALUE
8. IMPORTS
The Largest Import Supplying Countries
- IMPORTS FROM 2012–2023
- IMPORTS BY COUNTRY
- IMPORT PRICES BY COUNTRY
9. EXPORTS
The Largest Destinations for Exports
- EXPORTS FROM 2012–2023
- EXPORTS BY COUNTRY
- EXPORT PRICES BY COUNTRY
-
10. PROFILES OF MAJOR PRODUCERS
The Largest Producers on The Market and Their Profiles
This Chapter is Available Only for the Professional Edition PRO -
LIST OF TABLES
- Key Findings In 2023
- Market Volume, In Physical Terms, 2012–2023
- Market Value, 2012–2023
- Per Capita Consumption In 2012-2023
- Imports, In Physical Terms, By Country, 2012–2023
- Imports, In Value Terms, By Country, 2012–2023
- Import Prices, By Country Of Origin, 2012–2023
- Exports, In Physical Terms, By Country, 2012–2023
- Exports, In Value Terms, By Country, 2012–2023
- Export Prices, By Country Of Destination, 2012–2023
-
LIST OF FIGURES
- Market Volume, In Physical Terms, 2012–2023
- Market Value, 2012–2023
- Market Structure – Domestic Supply vs. Imports, In Physical Terms, 2012-2023
- Market Structure – Domestic Supply vs. Imports, In Value Terms, 2012-2023
- Trade Balance, In Physical Terms, 2012-2023
- Trade Balance, In Value Terms, 2012-2023
- Per Capita Consumption, 2012-2023
- Market Volume Forecast to 2030
- Market Value Forecast to 2030
- Products: Market Size And Growth, By Type
- Products: Average Per Capita Consumption, By Type
- Products: Exports And Growth, By Type
- Products: Export Prices And Growth, By Type
- Production Volume And Growth
- Exports And Growth
- Export Prices And Growth
- Market Size And Growth
- Per Capita Consumption
- Imports And Growth
- Import Prices
- Production, In Physical Terms, 2012–2023
- Production, In Value Terms, 2012–2023
- Imports, In Physical Terms, 2012–2023
- Imports, In Value Terms, 2012–2023
- Imports, In Physical Terms, By Country, 2023
- Imports, In Physical Terms, By Country, 2012–2023
- Imports, In Value Terms, By Country, 2012–2023
- Import Prices, By Country Of Origin, 2012–2023
- Exports, In Physical Terms, 2012–2023
- Exports, In Value Terms, 2012–2023
- Exports, In Physical Terms, By Country, 2023
- Exports, In Physical Terms, By Country, 2012–2023
- Exports, In Value Terms, By Country, 2012–2023
- Export Prices, By Country Of Destination, 2012–2023
This report provides an in-depth analysis of the video game console market in Republic of Korea.
This report provides an in-depth analysis of the video game console market in Republic of Korea.
This report provides an in-depth analysis of the billiard accessoires market in Republic of Korea.
This report provides an in-depth analysis of the electric car racing sets market in Republic of Korea.
This report provides an in-depth analysis of the coin game market in Republic of Korea.
This report provides an in-depth analysis of the playing cards market in Republic of Korea.
This report provides an in-depth analysis of the global video game console market.
This report provides an in-depth analysis of the global video game console market.
This report provides an in-depth analysis of the global billiard accessoires market.
Global Electric Racing Set Market Report 2018. This report provides an in-depth analysis of the global electric racing set market.
Explore the top import markets for video game consoles worldwide, including the United States, Netherlands, Germany, Japan, and more. Get key statistics and insights from IndexBox market intelligence platform.
In 2016, the global video game imports amounted to X tons, ascending by X% against the previous year figure. In general, video game imports continue to indicate a pronounced setback. The most pro...
In 2016, the global video game imports amounted to X tons, ascending by X% against the previous year figure. In general, video game imports continue to indicate a pronounced setback. The most pro...


