Myanmar - Travel Sets - Market Analysis, Forecast, Size, Trends And Insights
Get instant access to more than 2 million reports, dashboards, and datasets on the IndexBox Platform.
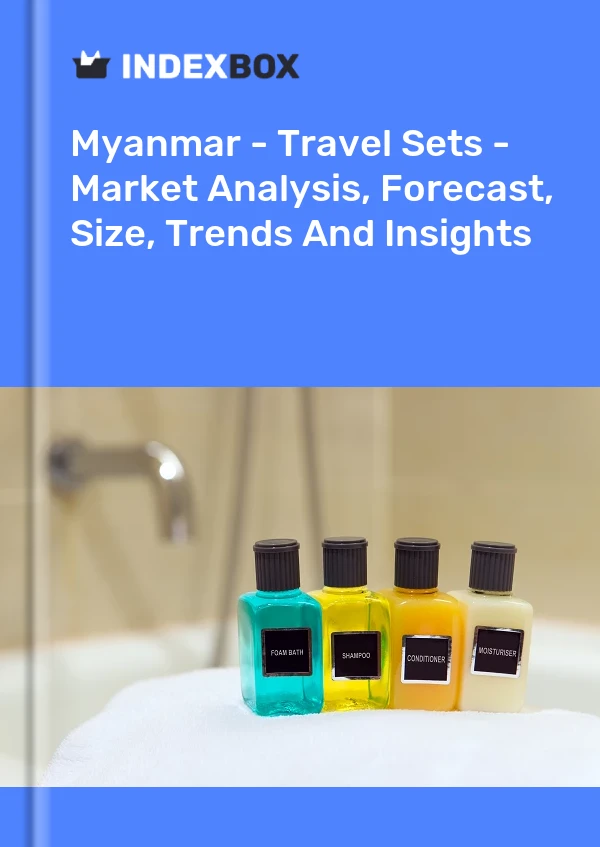
View PricingTravel Set Price in Myanmar - 2022
Contents:
- Travel Set Price in Myanmar (CIF) - 2022
- Travel Set Price in Myanmar (FOB) - 2022
- Travel Set Imports in Myanmar
- Travel Set Exports in Myanmar
Travel Set Price in Myanmar (CIF) - 2022
In 2022, the average travel set import price amounted to $0.5 per unit, picking up by 51% against the previous year. In general, the import price, however, showed a mild contraction. The import price peaked at $0.5 per unit in 2012; however, from 2013 to 2022, import prices remained at a lower figure.
Average prices varied noticeably amongst the major supplying countries. In 2022, amid the top importers, the country with the highest price was the United States ($0.5 per unit), while the price for China ($0.5 per unit) was amongst the lowest.
From 2012 to 2022, the most notable rate of growth in terms of prices was attained by Vietnam (+16.1%), while the prices for the other major suppliers experienced mixed trend patterns.
Travel Set Price in Myanmar (FOB) - 2022
The average travel set export price stood at $0.5 per unit in 2022, growing by 97% against the previous year. In general, the export price recorded a buoyant increase. The export price peaked at $0.7 per unit in 2017; however, from 2018 to 2022, the export prices remained at a lower figure.
As there is only one major export destination, the average price level is determined by prices for China.
From 2012 to 2022, the rate of growth in terms of prices for Thailand amounted to +6.2% per year.
Travel Set Imports in Myanmar
For the third consecutive year, Myanmar recorded decline in overseas purchases of travel sets, which decreased by -54.9% to 22K units in 2022. Overall, imports recorded a dramatic slump. The smallest decline of -43.6% was in 2020. Imports peaked at 195K units in 2019; however, from 2020 to 2022, imports remained at a lower figure.
In value terms, travel set imports shrank markedly to $10K in 2022. In general, imports saw a significant curtailment. Over the period under review, imports attained the peak figure at $95K in 2019; however, from 2020 to 2022, imports remained at a lower figure.
| Import of Travel Set in Myanmar (Thousand USD) | |||||
|---|---|---|---|---|---|
| COUNTRY | 2019 | 2020 | 2021 | 2022 | CAGR, 2019-2022 |
| China | 68.2 | 12.8 | 2.2 | 9.4 | -48.3% |
| United Kingdom | 0.7 | 0.6 | 0.2 | 0.7 | 0.0% |
| United States | 0.3 | 0.2 | 0.1 | 0.2 | -12.6% |
| Thailand | 4.7 | 4.0 | 1.4 | 0.1 | -72.3% |
| Vietnam | 1.5 | 0.8 | 0.5 | N/A | -42.3% |
| Ethiopia | 0.6 | 0.7 | 0.3 | N/A | -29.3% |
| Indonesia | 9.5 | 17.0 | 6.6 | N/A | -16.6% |
| Singapore | 1.9 | 3.1 | 0.4 | N/A | -54.1% |
| Taiwan (Chinese) | 3.9 | 4.1 | 1.9 | N/A | -30.2% |
| Others | 3.6 | 3.9 | 1.6 | N/A | -33.3% |
| Total | 94.8 | 47.3 | 15.2 | 10.4 | -52.1% |
Top Suppliers of Travel Set to Myanmar in 2022:
- China (19.7K units)
- United Kingdom (1.5K units)
- United States (0.5K units)
- Thailand (0.1K units)
Travel Set Exports in Myanmar
In 2022, overseas shipments of travel sets increased by 54,581% to 26K units for the first time since 2019, thus ending a two-year declining trend. In general, exports recorded significant growth. As a result, the exports attained the peak and are likely to continue growth in the immediate term.
In value terms, travel set exports skyrocketed to $14K in 2022. Over the period under review, exports saw a significant expansion. As a result, the exports attained the peak and are likely to continue growth in the immediate term.
| Export of Travel Set in Myanmar (Thousand USD) | |||||
|---|---|---|---|---|---|
| COUNTRY | 2019 | 2020 | 2021 | 2022 | CAGR, 2019-2022 |
| China | N/A | N/A | N/A | 14.0 | 0% |
| Thailand | 1.2 | 0.6 | N/A | N/A | -50.0% |
| Others | 0.1 | N/A | N/A | N/A | 0% |
| Total | 1.2 | 0.6 | N/A | 14.0 | 126.8% |
Top Export Markets for Travel Set from Myanmar in 2022:
- China (26.2K units)
This report provides an in-depth analysis of the travel set market in Myanmar. Within it, you will discover the latest data on market trends and opportunities by country, consumption, production and price developments, as well as the global trade (imports and exports). The forecast exhibits the market prospects through 2030.
Product coverage:
- Prodcom 15121270 - Travel sets for personal toilet, sewing, or shoe or clothes cleaning (excluding manicure sets)
Country coverage:
- Myanmar
Data coverage:
- Market volume and value
- Per Capita consumption
- Forecast of the market dynamics in the medium term
- Trade (exports and imports) in Myanmar
- Export and import prices
- Market trends, drivers and restraints
- Key market players and their profiles
Reasons to buy this report:
- Take advantage of the latest data
- Find deeper insights into current market developments
- Discover vital success factors affecting the market
This report is designed for manufacturers, distributors, importers, and wholesalers, as well as for investors, consultants and advisors.
In this report, you can find information that helps you to make informed decisions on the following issues:
- How to diversify your business and benefit from new market opportunities
- How to load your idle production capacity
- How to boost your sales on overseas markets
- How to increase your profit margins
- How to make your supply chain more sustainable
- How to reduce your production and supply chain costs
- How to outsource production to other countries
- How to prepare your business for global expansion
While doing this research, we combine the accumulated expertise of our analysts and the capabilities of artificial intelligence. The AI-based platform, developed by our data scientists, constitutes the key working tool for business analysts, empowering them to discover deep insights and ideas from the marketing data.
-
1. INTRODUCTION
Making Data-Driven Decisions to Grow Your Business
- REPORT DESCRIPTION
- RESEARCH METHODOLOGY AND AI PLATFORM
- DATA-DRIVEN DECISIONS FOR YOUR BUSINESS
- GLOSSARY AND SPECIFIC TERMS
-
2. EXECUTIVE SUMMARY
A Quick Overview of Market Performance
- KEY FINDINGS
- MARKET TRENDS This Chapter is Available Only for the Professional Edition PRO
-
3. MARKET OVERVIEW
Understanding the Current State of The Market and Its Prospects
- MARKET SIZE
- MARKET STRUCTURE
- TRADE BALANCE
- PER CAPITA CONSUMPTION
- MARKET FORECAST TO 2030
-
4. MOST PROMISING PRODUCT
Finding New Products to Diversify Your Business
This Chapter is Available Only for the Professional Edition PRO- TOP PRODUCTS TO DIVERSIFY YOUR BUSINESS
- BEST-SELLING PRODUCTS
- MOST CONSUMED PRODUCT
- MOST TRADED PRODUCT
- MOST PROFITABLE PRODUCT FOR EXPORT
-
5. MOST PROMISING SUPPLYING COUNTRIES
Choosing the Best Countries to Establish Your Sustainable Supply Chain
This Chapter is Available Only for the Professional Edition PRO- TOP COUNTRIES TO SOURCE YOUR PRODUCT
- TOP PRODUCING COUNTRIES
- TOP EXPORTING COUNTRIES
- LOW-COST EXPORTING COUNTRIES
-
6. MOST PROMISING OVERSEAS MARKETS
Choosing the Best Countries to Boost Your Exports
This Chapter is Available Only for the Professional Edition PRO- TOP OVERSEAS MARKETS FOR EXPORTING YOUR PRODUCT
- TOP CONSUMING MARKETS
- UNSATURATED MARKETS
- TOP IMPORTING MARKETS
- MOST PROFITABLE MARKETS
7. PRODUCTION
The Latest Trends and Insights into The Industry
- PRODUCTION VOLUME AND VALUE
8. IMPORTS
The Largest Import Supplying Countries
- IMPORTS FROM 2012–2023
- IMPORTS BY COUNTRY
- IMPORT PRICES BY COUNTRY
9. EXPORTS
The Largest Destinations for Exports
- EXPORTS FROM 2012–2023
- EXPORTS BY COUNTRY
- EXPORT PRICES BY COUNTRY
-
10. PROFILES OF MAJOR PRODUCERS
The Largest Producers on The Market and Their Profiles
This Chapter is Available Only for the Professional Edition PRO -
LIST OF TABLES
- Key Findings In 2023
- Market Volume, In Physical Terms, 2012–2023
- Market Value, 2012–2023
- Per Capita Consumption In 2012-2023
- Imports, In Physical Terms, By Country, 2012–2023
- Imports, In Value Terms, By Country, 2012–2023
- Import Prices, By Country Of Origin, 2012–2023
- Exports, In Physical Terms, By Country, 2012–2023
- Exports, In Value Terms, By Country, 2012–2023
- Export Prices, By Country Of Destination, 2012–2023
-
LIST OF FIGURES
- Market Volume, In Physical Terms, 2012–2023
- Market Value, 2012–2023
- Market Structure – Domestic Supply vs. Imports, In Physical Terms, 2012-2023
- Market Structure – Domestic Supply vs. Imports, In Value Terms, 2012-2023
- Trade Balance, In Physical Terms, 2012-2023
- Trade Balance, In Value Terms, 2012-2023
- Per Capita Consumption, 2012-2023
- Market Volume Forecast to 2030
- Market Value Forecast to 2030
- Products: Market Size And Growth, By Type
- Products: Average Per Capita Consumption, By Type
- Products: Exports And Growth, By Type
- Products: Export Prices And Growth, By Type
- Production Volume And Growth
- Exports And Growth
- Export Prices And Growth
- Market Size And Growth
- Per Capita Consumption
- Imports And Growth
- Import Prices
- Production, In Physical Terms, 2012–2023
- Production, In Value Terms, 2012–2023
- Imports, In Physical Terms, 2012–2023
- Imports, In Value Terms, 2012–2023
- Imports, In Physical Terms, By Country, 2023
- Imports, In Physical Terms, By Country, 2012–2023
- Imports, In Value Terms, By Country, 2012–2023
- Import Prices, By Country Of Origin, 2012–2023
- Exports, In Physical Terms, 2012–2023
- Exports, In Value Terms, 2012–2023
- Exports, In Physical Terms, By Country, 2023
- Exports, In Physical Terms, By Country, 2012–2023
- Exports, In Value Terms, By Country, 2012–2023
- Export Prices, By Country Of Destination, 2012–2023
This report provides an in-depth analysis of the travel set market in Myanmar.
This report provides an in-depth analysis of the luggage market in Myanmar.
This report provides an in-depth analysis of the global travel set market.
This report provides an in-depth analysis of the global luggage market.
This report provides an in-depth analysis of the travel set market in Myanmar.
This report provides an in-depth analysis of the global travel set market.
In value terms, travel sets imports stood at $X in 2016. The total import value increased at an average annual rate of +X% over the period from 2007 to 2016; the trend pattern indicated some noti...
In value terms, travel sets exports stood at $X in 2016. Overall, it indicated a significant growth from 2007 to 2016: the total exports value increased at an average annual rate of +X% over the ...
Explore the top import markets for luggage and their key statistics. Discover the leading countries and their import values for 2022. Learn how IndexBox market intelligence platform can provide valuable insights.
Global luggage imports stood at X tons in 2016, leveling off at the previous year figure. In general, luggage imports continue to indicate a relatively flat trend pattern. The pace of growth was ...
Global luggage imports stood at X tons in 2016, leveling off at the previous year figure. In general, luggage imports continue to indicate a relatively flat trend pattern. The pace of growth was ...
In value terms, travel sets imports stood at $X in 2016. The total import value increased at an average annual rate of +X% over the period from 2007 to 2016; the trend pattern indicated some noti...
In value terms, travel sets exports stood at $X in 2016. Overall, it indicated a significant growth from 2007 to 2016: the total exports value increased at an average annual rate of +X% over the ...


