World - Maize - Market Analysis, Forecast, Size, Trends and Insights
Get instant access to more than 2 million reports, dashboards, and datasets on the IndexBox Platform.
View PricingMaize Crop Yield Per Acre
Maize Crop Yield per Acre
Maize, also known as corn, is one of the most widely grown cereal crops in the world. It is a staple food for millions of people, and it is also used as animal feed and as a raw material in various industries. Maize crop yield per acre varies depending on various factors such as soil fertility, climate conditions, farming practices, and crop management techniques.
The average maize crop yield per acre can range from 100 to 300 bushels (around 6,000 to 18,000 pounds) per acre. However, it is important to note that these figures can vary significantly depending on the region and the specific conditions of each farm. Some high-yield farms with advanced farming techniques can achieve yields of over 300 bushels per acre, while others may struggle to reach 100 bushels per acre.
Several factors contribute to the variations in maize crop yield per acre:
1. Climate Conditions
Maize is a warm-season crop that requires a sufficient amount of heat and sunlight to grow and develop. Regions with a moderate climate, adequate rainfall, and a long growing season tend to have higher maize crop yields per acre. However, extreme weather events such as drought or excessive rainfall can negatively impact yields.
2. Soil Fertility
The fertility of the soil plays a crucial role in maize production. Soils rich in organic matter and essential nutrients like nitrogen, phosphorus, and potassium can support better crop growth and yield. Farmers often implement soil testing and fertilization practices to optimize soil fertility and improve crop productivity.
3. Water Availability
Maize requires an adequate and consistent water supply, especially during critical growth stages such as flowering and grain filling. Irrigation practices are commonly used in areas with limited rainfall to ensure sufficient water availability. Insufficient water can lead to stunted growth and reduced crop yields.
4. Crop Management Techniques
Farmers employ various crop management techniques to maximize maize crop yield per acre. These include proper seed selection, planting density, weed control, pest and disease management, and timely harvesting. Adoption of modern farming technologies and best practices can significantly enhance crop productivity.
5. Genetic Factors
The choice of maize varieties can have a significant impact on crop yield. Hybrid maize varieties developed through breeding programs are generally known to produce higher yields compared to traditional open-pollinated varieties. High-yielding hybrids have traits such as improved disease resistance, better stress tolerance, and enhanced grain production.
In conclusion, the maize crop yield per acre can vary from 100 to 300 bushels depending on several factors such as climate conditions, soil fertility, water availability, crop management techniques, and genetic factors. To achieve higher yields, farmers need to implement appropriate agricultural practices and leverage modern technologies. Improving soil fertility, ensuring sufficient water supply, and selecting high-yielding maize hybrids are some of the key strategies to optimize maize crop productivity.
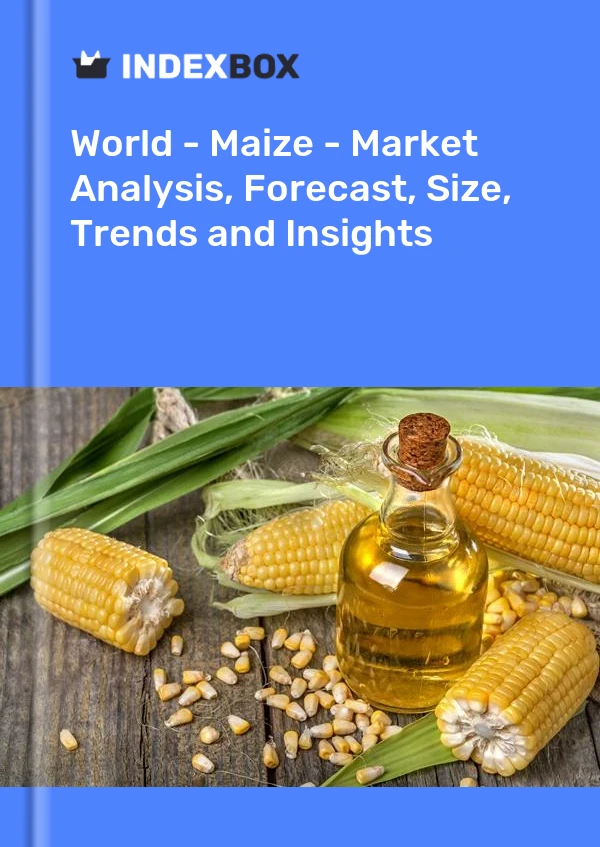
This report provides an in-depth analysis of the global maize market. Within it, you will discover the latest data on market trends and opportunities by country, consumption, production and price developments, as well as the global trade (imports and exports). The forecast exhibits the market prospects through 2030.
Product coverage:
- FCL 56 - Maize
Country coverage:
Worldwide - the report contains statistical data for 200 countries and includes detailed profiles of the 50 largest consuming countries:
- USA
- China
- Japan
- Germany
- United Kingdom
- France
- Brazil
- Italy
- Russian Federation
- India
- Canada
- Australia
- Republic of Korea
- Spain
- Mexico
- Indonesia
- Netherlands
- Turkey
- Saudi Arabia
- Switzerland
- Sweden
- Nigeria
- Poland
- Belgium
- Argentina
- Norway
- Austria
- Thailand
- United Arab Emirates
- Colombia
- Denmark
- South Africa
- Malaysia
- Israel
- Singapore
- Egypt
- Philippines
- Finland
- Chile
- Ireland
- Pakistan
- Greece
- Portugal
- Kazakhstan
- Algeria
- Czech Republic
- Qatar
- Peru
- Romania
- Vietnam
+ the largest producing countries
Data coverage:
- Global market volume and value
- Per Capita consumption
- Forecast of the market dynamics in the medium term
- Global production, split by region and country
- Global trade (exports and imports)
- Export and import prices
- Market trends, drivers and restraints
- Key market players and their profiles
Company coverage:
Reasons to buy this report:
- Take advantage of the latest data
- Find deeper insights into current market developments
- Discover vital success factors affecting the market
This report is designed for manufacturers, distributors, importers, and wholesalers, as well as for investors, consultants and advisors.
In this report, you can find information that helps you to make informed decisions on the following issues:
- How to diversify your business and benefit from new market opportunities
- How to load your idle production capacity
- How to boost your sales on overseas markets
- How to increase your profit margins
- How to make your supply chain more sustainable
- How to reduce your production and supply chain costs
- How to outsource production to other countries
- How to prepare your business for global expansion
While doing this research, we combine the accumulated expertise of our analysts and the capabilities of artificial intelligence. The AI-based platform, developed by our data scientists, constitutes the key working tool for business analysts, empowering them to discover deep insights and ideas from the marketing data.
-
1. INTRODUCTION
Making Data-Driven Decisions to Grow Your Business
- REPORT DESCRIPTION
- RESEARCH METHODOLOGY AND AI PLATFORM
- DATA-DRIVEN DECISIONS FOR YOUR BUSINESS
- GLOSSARY AND SPECIFIC TERMS
-
2. EXECUTIVE SUMMARY
A Quick Overview of Market Performance
- KEY FINDINGS
- MARKET TRENDS This Chapter is Available Only for the Professional Edition PRO
-
3. MARKET OVERVIEW
Understanding the Current State of The Market and Its Prospects
- MARKET SIZE
- CONSUMPTION BY COUNTRY
- MARKET FORECAST TO 2030
-
4. MOST PROMISING PRODUCT
Finding New Products to Diversify Your Business
This Chapter is Available Only for the Professional Edition PRO- TOP PRODUCTS TO DIVERSIFY YOUR BUSINESS
- BEST-SELLING PRODUCTS
- MOST CONSUMED PRODUCT
- MOST TRADED PRODUCT
- MOST PROFITABLE PRODUCT FOR EXPORT
-
5. MOST PROMISING SUPPLYING COUNTRIES
Choosing the Best Countries to Establish Your Sustainable Supply Chain
This Chapter is Available Only for the Professional Edition PRO- TOP COUNTRIES TO SOURCE YOUR PRODUCT
- TOP PRODUCING COUNTRIES
- COUNTRIES WITH TOP YIELDS
- TOP EXPORTING COUNTRIES
- LOW-COST EXPORTING COUNTRIES
-
6. MOST PROMISING OVERSEAS MARKETS
Choosing the Best Countries to Boost Your Exports
This Chapter is Available Only for the Professional Edition PRO- TOP OVERSEAS MARKETS FOR EXPORTING YOUR PRODUCT
- TOP CONSUMING MARKETS
- UNSATURATED MARKETS
- TOP IMPORTING MARKETS
- MOST PROFITABLE MARKETS
7. GLOBAL PRODUCTION
The Latest Trends and Insights into The Industry
- PRODUCTION VOLUME AND VALUE
- PRODUCTION BY COUNTRY
- HARVESTED AREA AND YIELD BY COUNTRY
8. GLOBAL IMPORTS
The Largest Importers on The Market and How They Succeed
- IMPORTS FROM 2012–2023
- IMPORTS BY COUNTRY
- IMPORT PRICES BY COUNTRY
9. GLOBAL EXPORTS
The Largest Exporters on The Market and How They Succeed
- EXPORTS FROM 2012–2023
- EXPORTS BY COUNTRY
- EXPORT PRICES BY COUNTRY
-
10. PROFILES OF MAJOR PRODUCERS
The Largest Producers on The Market and Their Profiles
This Chapter is Available Only for the Professional Edition PRO -
11. COUNTRY PROFILES
The Largest Markets And Their Profiles
This Chapter is Available Only for the Professional Edition PRO- United States
- China
- Japan
- Germany
- United Kingdom
- France
- Brazil
- Italy
- Russian Federation
- India
- Canada
- Australia
- Republic of Korea
- Spain
- Mexico
- Indonesia
- Netherlands
- Turkey
- Saudi Arabia
- Switzerland
- Sweden
- Nigeria
- Poland
- Belgium
- Argentina
- Norway
- Austria
- Thailand
- United Arab Emirates
- Colombia
- Denmark
- South Africa
- Malaysia
- Israel
- Singapore
- Egypt
- Philippines
- Finland
- Chile
- Ireland
- Pakistan
- Greece
- Portugal
- Kazakhstan
- Algeria
- Czech Republic
- Qatar
- Peru
- Romania
- Vietnam
-
LIST OF TABLES
- Key Findings In 2023
- Market Volume, In Physical Terms, 2012–2023
- Market Value, 2012–2023
- Per Capita Consumption, By Country, 2018–2023
- Production, In Physical Terms, By Country, 2012–2023
- Harvested Area, By Country, 2012-2023
- Yield, By Country, 2012-2023
- Imports, In Physical Terms, By Country, 2012–2023
- Imports, In Value Terms, By Country, 2012–2023
- Import Prices, By Country Of Destination, 2012–2023
- Exports, In Physical Terms, By Country, 2012–2023
- Exports, In Value Terms, By Country, 2012–2023
- Export Prices, By Country Of Origin, 2012–2023
-
LIST OF FIGURES
- Market Volume, In Physical Terms, 2012–2023
- Market Value, 2012–2023
- Consumption, By Country, 2023
- Market Volume Forecast to 2030
- Market Value Forecast to 2030
- Products: Market Size And Growth, By Type
- Products: Average Per Capita Consumption, By Type
- Products: Exports And Growth, By Type
- Products: Export Prices And Growth, By Type
- Production Volume And Growth
- Yield And Growth
- Exports And Growth
- Export Prices And Growth
- Market Size And Growth
- Per Capita Consumption
- Imports And Growth
- Import Prices
- Production, In Physical Terms, 2012–2023
- Production, In Value Terms, 2012–2023
- Area Harvested, 2012–2023
- Yield, 2012–2023
- Production, By Country, 2023
- Production, In Physical Terms, By Country, 2012–2023
- Harvested Area, By Country, 2023
- Harvested Area, By Country, 2012-2023
- Yield, By Country, 2012-2023
- Imports, In Physical Terms, 2012–2023
- Imports, In Value Terms, 2012–2023
- Imports, In Physical Terms, By Country, 2023
- Imports, In Physical Terms, By Country, 2012–2023
- Imports, In Value Terms, By Country, 2012–2023
- Import Prices, By Country, 2012–2023
- Exports, In Physical Terms, 2012–2023
- Exports, In Value Terms, 2012–2023
- Exports, In Physical Terms, By Country, 2023
- Exports, In Physical Terms, By Country, 2012–2023
- Exports, In Value Terms, By Country, 2012–2023
- Export Prices, 2012–2023
This report provides an in-depth analysis of the global maize market.
This report provides an in-depth analysis of the global grain market.
The global maize market contracted to $404.6B in 2021, declining by -6.1% against the previous year.
The global maize market is expected to reach a production volume of more than 1.2 billion metric tons by the end of 2025.
In 2022, corn prices are projected to drop by approximately 10% y/y due to an expected all-time record high global production, which is to reach 1.2B tons. This forecast is subject to a number of risks, such as volatile fertilizer and energy prices, high freight rates, biofuel policies and weather conditions.
Driven by rising demand from the food industry and favourable weather, global corn production increased significantly in 2020. The rise in prices made the raw corn-based production of bioethanol unprofitable amid the low cost of traditional fuels due to the pandemic, resulting in the closure of some distilleries. In the future, the growing demand for alternative fuels is expected to offset this shift and promote the corn market.
Global Maize Market: In 2017, the global maize market amounted to X tons, posting solid average +X% gains over the last decade. Since 2013, consumption growth has accelerated, against rising demand and a long
The U.S. was the key world maize producing country with an output of about X tons in 2016, which accounted for X% of total global output. The other major producers were China (X%), Brazil (X%) and Ukraine (X>
Global maize consumption amounted to X thousand tons in 2015, surging by +X% against the previous year level.
In 2015, the countries with the highest levels of maize production were the United States (X thousand tons), China (X thousand tons), Brazil (X thousand tons), together accounting for X% of total output.
Designed to bring an unforgettable experience for children and adults alike, the Amaizing-Acres corn maze is certainly a place to visit this fall, a unique opportunity to enjoy a family get away surrounded by nature.
Explore the top import markets for grain, including China, Japan, Mexico, and more. Learn about the key statistics and market trends in the global grain import industry.


