Turkey - Direct Dyes And Preparations Based Thereon - Market Analysis, Forecast, Size, Trends And Insights
Get instant access to more than 2 million reports, dashboards, and datasets on the IndexBox Platform.
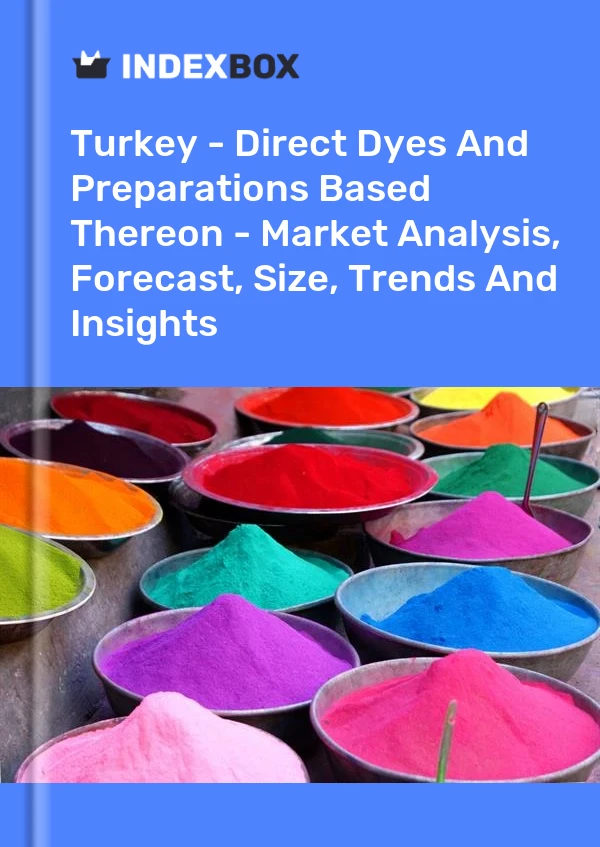
View PricingDirect Dye Price in Turkey - 2023
Contents:
- Direct Dye Price in Turkey (FOB) - 2023
- Direct Dye Price in Turkey (CIF) - 2023
- Direct Dye Exports in Turkey
- Direct Dye Imports in Turkey
Direct Dye Price in Turkey (FOB) - 2023
In July 2023, the average direct dye export price amounted to $2,630 per ton, with an increase of 6.8% against the previous month. Over the period under review, the export price continues to indicate slight growth. The pace of growth was the most pronounced in August 2022 when the average export price increased by 18% month-to-month. The export price peaked at $2,987 per ton in December 2022; however, from January 2023 to July 2023, the export prices remained at a lower figure.
There were significant differences in the average prices for the major overseas markets. In July 2023, the country with the highest price was India ($6,976 per ton), while the average price for exports to the Netherlands ($1,225 per ton) was amongst the lowest.
From July 2022 to July 2023, the most notable rate of growth in terms of prices was recorded for supplies to Morocco (+8.0%), while the prices for the other major destinations experienced more modest paces of growth.
Direct Dye Price in Turkey (CIF) - 2023
The average direct dye import price stood at $5,051 per ton in July 2023, growing by 59% against the previous month. In general, the import price, however, continues to indicate a relatively flat trend pattern. The most prominent rate of growth was recorded in November 2022 an increase of 64% m-o-m. Over the period under review, average import prices hit record highs at $5,784 per ton in January 2023; however, from February 2023 to July 2023, import prices remained at a lower figure.
Prices varied noticeably by the country of origin: the country with the highest price was China ($11,189 per ton), while the price for Spain ($1,276 per ton) was amongst the lowest.
From July 2022 to July 2023, the most notable rate of growth in terms of prices was attained by China (+4.7%), while the prices for the other major suppliers experienced mixed trend patterns.
Direct Dye Exports in Turkey
In 2022, shipments abroad of direct dyes and preparations based thereon decreased by -73.5% to 2.4K tons for the first time since 2018, thus ending a three-year rising trend. In general, exports saw a pronounced decrease. The growth pace was the most rapid in 2021 with an increase of 220%. As a result, the exports attained the peak of 9K tons, and then contracted sharply in the following year.
In value terms, direct dye exports fell significantly to $7.5M in 2022. Over the period under review, exports showed a noticeable reduction. The most prominent rate of growth was recorded in 2021 when exports increased by 168% against the previous year. As a result, the exports attained the peak of $20M, and then dropped markedly in the following year.
| Export of Direct Dye in Turkey (Million USD) | |||||
|---|---|---|---|---|---|
| COUNTRY | 2019 | 2020 | 2021 | 2022 | CAGR, 2019-2022 |
| Iran | 3.0 | 1.8 | 3.0 | 1.5 | -20.6% |
| Egypt | 1.4 | 0.9 | 4.1 | 1.5 | 2.3% |
| Uzbekistan | 1.1 | 1.5 | 4.0 | 1.5 | 10.9% |
| India | 0.7 | 0.6 | 1.1 | 0.5 | -10.6% |
| United Kingdom | 0.4 | 0.4 | 1.2 | 0.4 | 0.0% |
| Bangladesh | 0.1 | 0.2 | 1.0 | 0.4 | 58.7% |
| United Arab Emirates | N/A | 0.1 | 1.0 | 0.4 | 100.0% |
| Azerbaijan | N/A | 0.2 | 0.3 | 0.1 | -29.3% |
| Others | 1.3 | 1.8 | 4.3 | 1.2 | -2.6% |
| Total | 8.3 | 7.5 | 20.0 | 7.5 | -3.3% |
Top Export Markets for Direct Dye from Turkey in 2022:
- Egypt (648.4 tons)
- Iran (471.2 tons)
- Uzbekistan (295.1 tons)
- United Kingdom (253.1 tons)
- United Arab Emirates (234.2 tons)
- Bangladesh (131.3 tons)
- India (54.0 tons)
- Azerbaijan (41.2 tons)
Direct Dye Imports in Turkey
For the third year in a row, Turkey recorded decline in purchases abroad of direct dyes and preparations based thereon, which decreased by -45% to 1K tons in 2022. In general, imports faced a precipitous decline. The smallest decline of -14.5% was in 2020.
In value terms, direct dye imports reduced notably to $2.9M in 2022. Over the period under review, imports saw a significant decline. The smallest decline of -10.4% was in 2021.
| Import of Direct Dye in Turkey (Million USD) | |||||
|---|---|---|---|---|---|
| COUNTRY | 2019 | 2020 | 2021 | 2022 | CAGR, 2019-2022 |
| India | 3.6 | 3.4 | 2.9 | 1.6 | -23.7% |
| Spain | 1.6 | 1.0 | 0.7 | 0.5 | -32.1% |
| China | 0.7 | 0.4 | 0.5 | 0.3 | -24.6% |
| Taiwan (Chinese) | 0.3 | 0.4 | 0.2 | 0.1 | -30.7% |
| Others | 0.5 | 0.5 | 0.9 | 0.4 | -7.2% |
| Total | 6.7 | 5.7 | 5.1 | 2.9 | -24.4% |
Top Suppliers of Direct Dye to Turkey in 2022:
- India (542.3 tons)
- Spain (389.0 tons)
- China (32.9 tons)
- Taiwan (Chinese) (21.3 tons)
This report provides an in-depth analysis of the direct dye market in Turkey. Within it, you will discover the latest data on market trends and opportunities by country, consumption, production and price developments, as well as the global trade (imports and exports). The forecast exhibits the market prospects through 2030.
Product coverage:
- Prodcom 20122140 - Direct dyes and preparations based thereon
Country coverage:
- Turkey
Data coverage:
- Market volume and value
- Per Capita consumption
- Forecast of the market dynamics in the medium term
- Trade (exports and imports) in Turkey
- Export and import prices
- Market trends, drivers and restraints
- Key market players and their profiles
Reasons to buy this report:
- Take advantage of the latest data
- Find deeper insights into current market developments
- Discover vital success factors affecting the market
This report is designed for manufacturers, distributors, importers, and wholesalers, as well as for investors, consultants and advisors.
In this report, you can find information that helps you to make informed decisions on the following issues:
- How to diversify your business and benefit from new market opportunities
- How to load your idle production capacity
- How to boost your sales on overseas markets
- How to increase your profit margins
- How to make your supply chain more sustainable
- How to reduce your production and supply chain costs
- How to outsource production to other countries
- How to prepare your business for global expansion
While doing this research, we combine the accumulated expertise of our analysts and the capabilities of artificial intelligence. The AI-based platform, developed by our data scientists, constitutes the key working tool for business analysts, empowering them to discover deep insights and ideas from the marketing data.
-
1. INTRODUCTION
Making Data-Driven Decisions to Grow Your Business
- REPORT DESCRIPTION
- RESEARCH METHODOLOGY AND AI PLATFORM
- DATA-DRIVEN DECISIONS FOR YOUR BUSINESS
- GLOSSARY AND SPECIFIC TERMS
-
2. EXECUTIVE SUMMARY
A Quick Overview of Market Performance
- KEY FINDINGS
- MARKET TRENDS This Chapter is Available Only for the Professional Edition PRO
-
3. MARKET OVERVIEW
Understanding the Current State of The Market and Its Prospects
- MARKET SIZE
- MARKET STRUCTURE
- TRADE BALANCE
- PER CAPITA CONSUMPTION
- MARKET FORECAST TO 2030
-
4. MOST PROMISING PRODUCT
Finding New Products to Diversify Your Business
This Chapter is Available Only for the Professional Edition PRO- TOP PRODUCTS TO DIVERSIFY YOUR BUSINESS
- BEST-SELLING PRODUCTS
- MOST CONSUMED PRODUCT
- MOST TRADED PRODUCT
- MOST PROFITABLE PRODUCT FOR EXPORT
-
5. MOST PROMISING SUPPLYING COUNTRIES
Choosing the Best Countries to Establish Your Sustainable Supply Chain
This Chapter is Available Only for the Professional Edition PRO- TOP COUNTRIES TO SOURCE YOUR PRODUCT
- TOP PRODUCING COUNTRIES
- TOP EXPORTING COUNTRIES
- LOW-COST EXPORTING COUNTRIES
-
6. MOST PROMISING OVERSEAS MARKETS
Choosing the Best Countries to Boost Your Exports
This Chapter is Available Only for the Professional Edition PRO- TOP OVERSEAS MARKETS FOR EXPORTING YOUR PRODUCT
- TOP CONSUMING MARKETS
- UNSATURATED MARKETS
- TOP IMPORTING MARKETS
- MOST PROFITABLE MARKETS
7. PRODUCTION
The Latest Trends and Insights into The Industry
- PRODUCTION VOLUME AND VALUE
8. IMPORTS
The Largest Import Supplying Countries
- IMPORTS FROM 2012–2023
- IMPORTS BY COUNTRY
- IMPORT PRICES BY COUNTRY
9. EXPORTS
The Largest Destinations for Exports
- EXPORTS FROM 2012–2023
- EXPORTS BY COUNTRY
- EXPORT PRICES BY COUNTRY
-
10. PROFILES OF MAJOR PRODUCERS
The Largest Producers on The Market and Their Profiles
This Chapter is Available Only for the Professional Edition PRO -
LIST OF TABLES
- Key Findings In 2023
- Market Volume, In Physical Terms, 2012–2023
- Market Value, 2012–2023
- Per Capita Consumption In 2012-2023
- Imports, In Physical Terms, By Country, 2012–2023
- Imports, In Value Terms, By Country, 2012–2023
- Import Prices, By Country Of Origin, 2012–2023
- Exports, In Physical Terms, By Country, 2012–2023
- Exports, In Value Terms, By Country, 2012–2023
- Export Prices, By Country Of Destination, 2012–2023
-
LIST OF FIGURES
- Market Volume, In Physical Terms, 2012–2023
- Market Value, 2012–2023
- Market Structure – Domestic Supply vs. Imports, In Physical Terms, 2012-2023
- Market Structure – Domestic Supply vs. Imports, In Value Terms, 2012-2023
- Trade Balance, In Physical Terms, 2012-2023
- Trade Balance, In Value Terms, 2012-2023
- Per Capita Consumption, 2012-2023
- Market Volume Forecast to 2030
- Market Value Forecast to 2030
- Products: Market Size And Growth, By Type
- Products: Average Per Capita Consumption, By Type
- Products: Exports And Growth, By Type
- Products: Export Prices And Growth, By Type
- Production Volume And Growth
- Exports And Growth
- Export Prices And Growth
- Market Size And Growth
- Per Capita Consumption
- Imports And Growth
- Import Prices
- Production, In Physical Terms, 2012–2023
- Production, In Value Terms, 2012–2023
- Imports, In Physical Terms, 2012–2023
- Imports, In Value Terms, 2012–2023
- Imports, In Physical Terms, By Country, 2023
- Imports, In Physical Terms, By Country, 2012–2023
- Imports, In Value Terms, By Country, 2012–2023
- Import Prices, By Country Of Origin, 2012–2023
- Exports, In Physical Terms, 2012–2023
- Exports, In Value Terms, 2012–2023
- Exports, In Physical Terms, By Country, 2023
- Exports, In Physical Terms, By Country, 2012–2023
- Exports, In Value Terms, By Country, 2012–2023
- Export Prices, By Country Of Destination, 2012–2023
This report provides an in-depth analysis of the direct dye market in Turkey.
This report provides an in-depth analysis of the organic pigments market in Turkey.
This report provides an in-depth analysis of the market for acid and mordant dye in Turkey.
This report provides an in-depth analysis of the basic dye market in Turkey.
This report provides an in-depth analysis of the disperse dye market in Turkey.
This report provides an in-depth analysis of the market for synthetic organic colouring matters in Turkey.
This report provides an in-depth analysis of the fluorescent brightening agents market in Turkey.
This report provides an in-depth analysis of the global direct dye market.
This report provides an in-depth analysis of the global organic pigments market.
This report provides an in-depth analysis of the global market for acid and mordant dye.
During the period analyzed, Direct Dye exports reached a peak of 4.7K tons in 2022 before experiencing a significant decline in the subsequent year. In terms of value, Direct Dye exports decreased substantially to $8.7M in 2023.
Imports of Basic Dye reached a peak of 283 tons and remained steady until November 2023. In terms of value, the import of Basic Dye surged to $1.7M in November 2023.
The price of Basic Dye in July 2023 was $7,289 per ton (CIF, Turkey), marking a decrease of -4.3% compared to the previous month.
After two years of growth, the global direct dye market decreased by -3.6% to $1.9B in 2019.
In 2016, the amount of organic pigments imported worldwide amounted to X tons, waning by -X% against the previous year level. In general, organic pigments imports continue to indicate a temper...
In 2016, the amount of organic pigments imported worldwide amounted to X tons, waning by -X% against the previous year level. In general, organic pigments imports continue to indicate a temper...
In value terms, unsaturated acyclic monocarboxylic acids imports stood at $X in 2016. Overall, unsaturated acyclic monocarboxylic acids imports continue to indicate a relatively flat trend pattern....
In value terms, unsaturated acyclic monocarboxylic acids exports amounted to $X in 2016. In general, unsaturated acyclic monocarboxylic acids exports continue to indicate a relatively flat trend pa...
In value terms, colouring matter and preparations imports totaled $X in 2016. Overall, it indicated a slight expansion from 2007 to 2016: the total imports value increased at an average annual rate ...
In value terms, artists and signboard painters colours imports totaled $X in 2016. The total import value increased at an average annual rate of +X% over the period from 2007 to 2016; however, th...


