Republic of Korea - Castor Oil Seed - Market Analysis, Forecast, Size, Trends and Insights
Get instant access to more than 2 million reports, dashboards, and datasets on the IndexBox Platform.
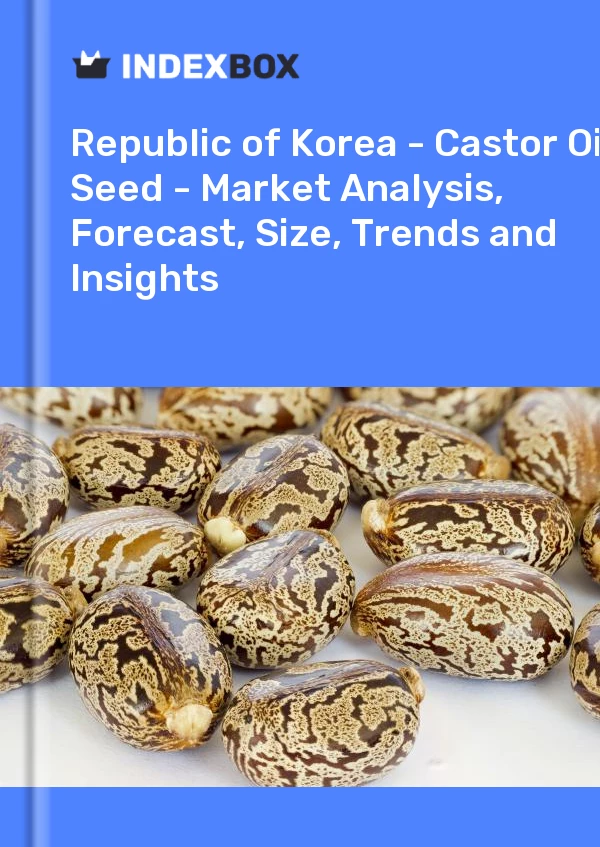
View PricingCastor Oil Seed Price in South Korea - 2022
Contents:
- Castor Oil Seed Price in South Korea (CIF) - 2022
- Castor Oil Seed Price in South Korea (FOB) - 2022
- Castor Oil Seed Imports in South Korea
- Castor Oil Seed Exports in South Korea
Castor Oil Seed Price in South Korea (CIF) - 2022
The average castor oil seed import price stood at $2,075 per ton in December 2022, reducing by -4.3% against the previous month. In general, the import price, however, showed a relatively flat trend pattern. The growth pace was the most rapid in April 2022 an increase of 4.3% m-o-m. Over the period under review, average import prices hit record highs at $2,207 per ton in August 2022; however, from September 2022 to December 2022, import prices remained at a lower figure.
There were significant differences in the average prices amongst the major supplying countries. In December 2022, the country with the highest price was Japan ($3,919 per ton), while the price for India stood at $1,998 per ton.
From December 2021 to December 2022, the most notable rate of growth in terms of prices was attained by Japan (+0.5%).
Castor Oil Seed Price in South Korea (FOB) - 2022
In 2022, the average castor oil seed export price amounted to $2,782 per ton, surging by 11% against the previous year. Overall, the export price, however, showed a noticeable setback. The pace of growth was the most pronounced in 2016 an increase of 109%. Over the period under review, the average export prices reached the peak figure at $4,047 per ton in 2012; however, from 2013 to 2022, the export prices failed to regain momentum.
Prices varied noticeably by country of destination: amid the top suppliers, the country with the highest price was Japan ($4,418 per ton), while the average price for exports to Uzbekistan ($1,660 per ton) was amongst the lowest.
From 2012 to 2022, the most notable rate of growth in terms of prices was recorded for supplies to Japan (+15.3%), while the prices for the other major destinations experienced a decline.
Castor Oil Seed Imports in South Korea
In 2022, after three years of growth, there was significant decline in supplies from abroad of castor oil seed, when their volume decreased by -20.9% to 9.4K tons. Overall, imports showed a mild setback. The pace of growth was the most pronounced in 2021 when imports increased by 20%. As a result, imports attained the peak of 12K tons, and then reduced sharply in the following year.
In value terms, castor oil seed imports declined modestly to $20M in 2022. The total import value increased at an average annual rate of +3.7% over the period from 2019 to 2022; the trend pattern indicated some noticeable fluctuations being recorded in certain years. The most prominent rate of growth was recorded in 2021 with an increase of 38%. As a result, imports attained the peak of $20M, and then reduced in the following year.
| Import of Castor Oil Seed in South Korea (Million USD) | |||||
|---|---|---|---|---|---|
| COUNTRY | 2019 | 2020 | 2021 | 2022 | CAGR, 2019-2022 |
| India | 16.5 | 13.6 | 19.2 | 18.8 | 4.4% |
| Japan | 1.1 | 0.8 | 0.8 | 0.9 | -6.5% |
| Others | 0.2 | 0.3 | 0.2 | 0.2 | 0.0% |
| Total | 17.8 | 14.7 | 20.2 | 19.9 | 3.8% |
Top Suppliers of Castor Oil Seed to South Korea in 2022:
- India (9.1K tons)
- Japan (0.3K tons)
Castor Oil Seed Exports in South Korea
Castor oil seed exports from South Korea dropped to 98 tons in 2022, shrinking by -5.5% on the year before. Over the period under review, exports recorded a precipitous shrinkage. The pace of growth was the most pronounced in 2021 with an increase of 92% against the previous year.
In value terms, castor oil seed exports reached $274K in 2022. Overall, exports recorded a precipitous setback. The most prominent rate of growth was recorded in 2021 with an increase of 77% against the previous year.
| Export of Castor Oil Seed in South Korea (Thousand USD) | |||||
|---|---|---|---|---|---|
| COUNTRY | 2019 | 2020 | 2021 | 2022 | CAGR, 2019-2022 |
| Vietnam | 113 | 87.1 | 97.4 | 163 | 13.0% |
| Thailand | N/A | 7.1 | 32.0 | 49.5 | 164.0% |
| China | 927 | 48.2 | 111 | 39.4 | -65.1% |
| Japan | N/A | N/A | 10.0 | 8.0 | -20.0% |
| Uzbekistan | N/A | 3.7 | 3.0 | 7.0 | 37.5% |
| Others | 1.3 | 0.6 | 6.9 | 7.4 | 78.6% |
| Total | 1,042 | 147 | 260 | 274 | -35.9% |
Top Export Markets for Castor Oil Seed from South Korea in 2022:
- Vietnam (56.1 tons)
- Thailand (22.3 tons)
- China (13.0 tons)
- Uzbekistan (4.2 tons)
- Japan (1.8 tons)
-
1. INTRODUCTION
Making Data-Driven Decisions to Grow Your Business
- REPORT DESCRIPTION
- RESEARCH METHODOLOGY AND AI PLATFORM
- DATA-DRIVEN DECISIONS FOR YOUR BUSINESS
- GLOSSARY AND SPECIFIC TERMS
-
2. EXECUTIVE SUMMARY
A Quick Overview of Market Performance
- KEY FINDINGS
- MARKET TRENDS This Chapter is Available Only for the Professional Edition PRO
-
3. MARKET OVERVIEW
Understanding the Current State of The Market and Its Prospects
- MARKET SIZE
- MARKET STRUCTURE
- TRADE BALANCE
- PER CAPITA CONSUMPTION
- MARKET FORECAST TO 2030
-
4. MOST PROMISING PRODUCT
Finding New Products to Diversify Your Business
This Chapter is Available Only for the Professional Edition PRO- TOP PRODUCTS TO DIVERSIFY YOUR BUSINESS
- BEST-SELLING PRODUCTS
- MOST CONSUMED PRODUCT
- MOST TRADED PRODUCT
- MOST PROFITABLE PRODUCT FOR EXPORT
-
5. MOST PROMISING SUPPLYING COUNTRIES
Choosing the Best Countries to Establish Your Sustainable Supply Chain
This Chapter is Available Only for the Professional Edition PRO- TOP COUNTRIES TO SOURCE YOUR PRODUCT
- TOP PRODUCING COUNTRIES
- COUNTRIES WITH TOP YIELDS
- TOP EXPORTING COUNTRIES
- LOW-COST EXPORTING COUNTRIES
-
6. MOST PROMISING OVERSEAS MARKETS
Choosing the Best Countries to Boost Your Exports
This Chapter is Available Only for the Professional Edition PRO- TOP OVERSEAS MARKETS FOR EXPORTING YOUR PRODUCT
- TOP CONSUMING MARKETS
- UNSATURATED MARKETS
- TOP IMPORTING MARKETS
- MOST PROFITABLE MARKETS
7. PRODUCTION
The Latest Trends and Insights into The Industry
- PRODUCTION, HARVESTED AREA AND YIELD
8. IMPORTS
The Largest Import Supplying Countries
- IMPORTS FROM 2012–2023
- IMPORTS BY COUNTRY
- IMPORT PRICES BY COUNTRY
9. EXPORTS
The Largest Destinations for Exports
- EXPORTS FROM 2012–2023
- EXPORTS BY COUNTRY
- EXPORT PRICES BY COUNTRY
-
10. PROFILES OF MAJOR PRODUCERS
The Largest Producers on The Market and Their Profiles
This Chapter is Available Only for the Professional Edition PRO -
LIST OF TABLES
- Key Findings In 2023
- Market Volume, In Physical Terms, 2012–2023
- Market Value, 2012–2023
- Per Capita Consumption In 2012-2023
- Imports, In Physical Terms, By Country, 2012–2023
- Imports, In Value Terms, By Country, 2012–2023
- Import Prices, By Country Of Origin, 2012–2023
- Exports, In Physical Terms, By Country, 2012–2023
- Exports, In Value Terms, By Country, 2012–2023
- Export Prices, By Country Of Destination, 2012–2023
-
LIST OF FIGURES
- Market Volume, In Physical Terms, 2012–2023
- Market Value, 2012–2023
- Market Structure – Domestic Supply vs. Imports, In Physical Terms, 2012-2023
- Market Structure – Domestic Supply vs. Imports, In Value Terms, 2012-2023
- Trade Balance, In Physical Terms, 2012-2023
- Trade Balance, In Value Terms, 2012-2023
- Per Capita Consumption, 2012-2023
- Market Volume Forecast to 2030
- Market Value Forecast to 2030
- Products: Market Size And Growth, By Type
- Products: Average Per Capita Consumption, By Type
- Products: Exports And Growth, By Type
- Products: Export Prices And Growth, By Type
- Production Volume And Growth
- Yield And Growth
- Exports And Growth
- Export Prices And Growth
- Market Size And Growth
- Per Capita Consumption
- Imports And Growth
- Import Prices
- Production, In Physical Terms, 2012–2023
- Production, In Value Terms, 2012–2023
- Area Harvested, 2012–2023
- Yield, 2012–2023
- Imports, In Physical Terms, 2012–2023
- Imports, In Value Terms, 2012–2023
- Imports, In Physical Terms, By Country, 2023
- Imports, In Physical Terms, By Country, 2012–2023
- Imports, In Value Terms, By Country, 2012–2023
- Import Prices, By Country Of Origin, 2012–2023
- Exports, In Physical Terms, 2012–2023
- Exports, In Value Terms, 2012–2023
- Exports, In Physical Terms, By Country, 2023
- Exports, In Physical Terms, By Country, 2012–2023
- Exports, In Value Terms, By Country, 2012–2023
- Export Prices, By Country Of Destination, 2012–2023
This report provides an in-depth analysis of the castor oil seed market in Republic of Korea.
This report provides an in-depth analysis of the linseed oil market in Republic of Korea.
This report provides an in-depth analysis of the maize oil market in Republic of Korea.
This report provides an in-depth analysis of the sesame oil market in Republic of Korea.
This report provides an in-depth analysis of the crude maize oil market in Republic of Korea.
This report provides an in-depth analysis of the refined maize oil market in Republic of Korea.
Global Castor Oil Seed Market Report 2019. This report provides an in-depth analysis of the global castor oil seed market.
This report provides an in-depth analysis of the global linseed oil market.
This report provides an in-depth analysis of the global maize oil market.
This report provides an in-depth analysis of the global sesame oil market.
Global castor oil seed consumption amounted to X thousand tons in 2015, surging by +X% against the previous year level.
In 2015, the country with the largest volume of the castor oil seed output was India (X thousand tons), accounting for X% of global production.
Despite a rocky 2014, Paraguay continued its dominance in the global castor oil seed trade. In 2014, Paraguay exported X tons of castor oil seed totaling X thousand USD, X% under the previous year. Its only trading partner was Brazil, where
Global linseed oil consumption amounted to X thousand tons in 2015, shrinking by -X% against the previous year level.
In 2015, the countries with the highest levels of linseed oil production were China (X thousand tons), Belgium (X thousand tons), the United States (X thousand tons), together accounting for X% of total output.
Belgium continued its dominance in the global linseed oil trade. In 2014, Belgium exported X thousand tons of linseed oil totaling X million USD, X% under the previous year. Its primary trading partner was Germany, where it supplied X% of its to
Global maize oil consumption amounted to X thousand tons in 2015, falling by -X% against the previous year level.
In 2015, the country with the largest volume of the maize oil output was the United States (X thousand tons), accounting for X% of global production.
The maize oil market reached X million USD, rising with an annual increase of X%.
The U.S. dominates in the global maize oil trade. In 2014, the U.S. exported X thousand tons of maize oil totaling X million USD, X% under the previous year. Its primary trading partner was Saudi Arabia, where it supplied X% of its total maize


