World - Activated Carbon - Market Analysis, Forecast, Size, Trends And Insights
Get instant access to more than 2 million reports, dashboards, and datasets on the IndexBox Platform.
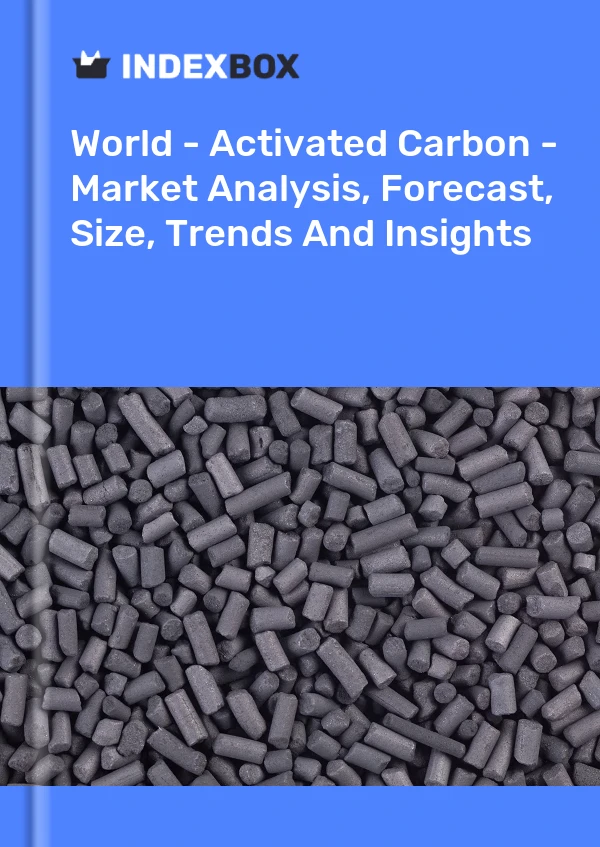
View PricingActivated Carbon Output
Activated carbon is a highly porous form of carbon that is used as a purification and filtration agent in various industries. It is produced by heating carbonaceous materials, such as coal, wood, or coconut shells, to high temperatures in the absence of air, a process known as activation. This results in the formation of a network of fine pores with a large internal surface area, giving activated carbon its exceptional adsorption properties.
The output of activated carbon production depends on several factors, including the raw material used, the activation process employed, and the desired properties of the final product. Different types of activated carbon are suitable for specific applications, and their output can vary accordingly.
Raw Materials
One key factor that affects the output of activated carbon is the choice of raw material. Commonly used carbonaceous materials include coal, wood, coconut shells, peat, and petroleum pitch. Each material has its own set of characteristics, which influences the quality and quantity of activated carbon obtained.
Coconut shells are a popular raw material for activated carbon production due to their high carbon content, low levels of impurities, and sustainable sourcing. The output of activated carbon from coconut shells can range from 25% to 30% of the weight of the shells. Similarly, wood-based activated carbon can yield around 20% to 40% of the raw material weight.
Activation Process
The activation process is a critical step in determining the output of activated carbon. There are two main methods of activation: physical activation and chemical activation.
Physical activation involves directly heating the carbonaceous material in the presence of an inert gas, such as nitrogen or steam. The high temperatures cause the material to decompose, leaving behind a highly porous structure. This process typically yields activated carbon with larger pore sizes and a lower surface area.
Chemical activation, on the other hand, involves impregnating the carbonaceous material with a chemical agent, typically an alkaline compound like potassium hydroxide or phosphoric acid. The impregnated material is then heated, resulting in the development of a porous structure. Chemical activation generally produces activated carbon with smaller pore sizes and a higher surface area compared to physical activation.
Properties and Output
The desired properties of activated carbon, such as pore size distribution, surface area, and hardness, can also impact its output. Different applications require activated carbon with specific characteristics, and manufacturers tailor their production processes accordingly.
The specific surface area of activated carbon is a crucial parameter that influences its adsorption capacity. High surface area enables more adsorption sites, increasing the effectiveness of the carbon in removing impurities. The surface area is typically measured using the Brunauer-Emmett-Teller (BET) method. Activated carbon with a surface area of 500 to 1500 square meters per gram is considered suitable for most applications.
The output of activated carbon can be quantified in terms of weight or volume, depending on the manufacturing process and customer requirements. The production capacity of activated carbon plants varies widely, ranging from several tons to thousands of tons per year.
In conclusion, the output of activated carbon production depends on factors such as the raw material used, the activation process employed, and the desired properties of the final product. Various raw materials can be used, with coconut shells and wood being commonly preferred. The choice between physical and chemical activation influences the pore size distribution and surface area of the activated carbon. Manufacturers customize their production processes to meet specific application requirements, ensuring the desired properties of the final product. The output can be measured in weight or volume, with production capacities ranging from a few tons to several thousand tons per year.
This report provides an in-depth analysis of the global activated carbon market. Within it, you will discover the latest data on market trends and opportunities by country, consumption, production and price developments, as well as the global trade (imports and exports). The forecast exhibits the market prospects through 2030.
Product coverage:
- Prodcom 20595400 - Activated carbon
Country coverage:
Worldwide - the report contains statistical data for 200 countries and includes detailed profiles of the 50 largest consuming countries:
- USA
- China
- Japan
- Germany
- United Kingdom
- France
- Brazil
- Italy
- Russian Federation
- India
- Canada
- Australia
- Republic of Korea
- Spain
- Mexico
- Indonesia
- Netherlands
- Turkey
- Saudi Arabia
- Switzerland
- Sweden
- Nigeria
- Poland
- Belgium
- Argentina
- Norway
- Austria
- Thailand
- United Arab Emirates
- Colombia
- Denmark
- South Africa
- Malaysia
- Israel
- Singapore
- Egypt
- Philippines
- Finland
- Chile
- Ireland
- Pakistan
- Greece
- Portugal
- Kazakhstan
- Algeria
- Czech Republic
- Qatar
- Peru
- Romania
- Vietnam
+ the largest producing countries
Data coverage:
- Global market volume and value
- Per Capita consumption
- Forecast of the market dynamics in the medium term
- Global production, split by region and country
- Global trade (exports and imports)
- Export and import prices
- Market trends, drivers and restraints
- Key market players and their profiles
Reasons to buy this report:
- Take advantage of the latest data
- Find deeper insights into current market developments
- Discover vital success factors affecting the market
This report is designed for manufacturers, distributors, importers, and wholesalers, as well as for investors, consultants and advisors.
In this report, you can find information that helps you to make informed decisions on the following issues:
- How to diversify your business and benefit from new market opportunities
- How to load your idle production capacity
- How to boost your sales on overseas markets
- How to increase your profit margins
- How to make your supply chain more sustainable
- How to reduce your production and supply chain costs
- How to outsource production to other countries
- How to prepare your business for global expansion
While doing this research, we combine the accumulated expertise of our analysts and the capabilities of artificial intelligence. The AI-based platform, developed by our data scientists, constitutes the key working tool for business analysts, empowering them to discover deep insights and ideas from the marketing data.
-
1. INTRODUCTION
Making Data-Driven Decisions to Grow Your Business
- REPORT DESCRIPTION
- RESEARCH METHODOLOGY AND AI PLATFORM
- DATA-DRIVEN DECISIONS FOR YOUR BUSINESS
- GLOSSARY AND SPECIFIC TERMS
-
2. EXECUTIVE SUMMARY
A Quick Overview of Market Performance
- KEY FINDINGS
- MARKET TRENDS This Chapter is Available Only for the Professional Edition PRO
-
3. MARKET OVERVIEW
Understanding the Current State of The Market and Its Prospects
- MARKET SIZE
- CONSUMPTION BY COUNTRY
- MARKET FORECAST TO 2030
-
4. MOST PROMISING PRODUCT
Finding New Products to Diversify Your Business
This Chapter is Available Only for the Professional Edition PRO- TOP PRODUCTS TO DIVERSIFY YOUR BUSINESS
- BEST-SELLING PRODUCTS
- MOST CONSUMED PRODUCT
- MOST TRADED PRODUCT
- MOST PROFITABLE PRODUCT FOR EXPORT
-
5. MOST PROMISING SUPPLYING COUNTRIES
Choosing the Best Countries to Establish Your Sustainable Supply Chain
This Chapter is Available Only for the Professional Edition PRO- TOP COUNTRIES TO SOURCE YOUR PRODUCT
- TOP PRODUCING COUNTRIES
- TOP EXPORTING COUNTRIES
- LOW-COST EXPORTING COUNTRIES
-
6. MOST PROMISING OVERSEAS MARKETS
Choosing the Best Countries to Boost Your Exports
This Chapter is Available Only for the Professional Edition PRO- TOP OVERSEAS MARKETS FOR EXPORTING YOUR PRODUCT
- TOP CONSUMING MARKETS
- UNSATURATED MARKETS
- TOP IMPORTING MARKETS
- MOST PROFITABLE MARKETS
7. GLOBAL PRODUCTION
The Latest Trends and Insights into The Industry
- PRODUCTION VOLUME AND VALUE
- PRODUCTION BY COUNTRY
8. GLOBAL IMPORTS
The Largest Importers on The Market and How They Succeed
- IMPORTS FROM 2012–2023
- IMPORTS BY COUNTRY
- IMPORT PRICES BY COUNTRY
9. GLOBAL EXPORTS
The Largest Exporters on The Market and How They Succeed
- EXPORTS FROM 2012–2023
- EXPORTS BY COUNTRY
- EXPORT PRICES BY COUNTRY
-
10. PROFILES OF MAJOR PRODUCERS
The Largest Producers on The Market and Their Profiles
This Chapter is Available Only for the Professional Edition PRO -
11. COUNTRY PROFILES
The Largest Markets And Their Profiles
This Chapter is Available Only for the Professional Edition PRO- United States
- China
- Japan
- Germany
- United Kingdom
- France
- Brazil
- Italy
- Russian Federation
- India
- Canada
- Australia
- Republic of Korea
- Spain
- Mexico
- Indonesia
- Netherlands
- Turkey
- Saudi Arabia
- Switzerland
- Sweden
- Nigeria
- Poland
- Belgium
- Argentina
- Norway
- Austria
- Thailand
- United Arab Emirates
- Colombia
- Denmark
- South Africa
- Malaysia
- Israel
- Singapore
- Egypt
- Philippines
- Finland
- Chile
- Ireland
- Pakistan
- Greece
- Portugal
- Kazakhstan
- Algeria
- Czech Republic
- Qatar
- Peru
- Romania
- Vietnam
-
LIST OF TABLES
- Key Findings In 2023
- Market Volume, In Physical Terms, 2012–2023
- Market Value, 2012–2023
- Per Capita Consumption, By Country, 2018–2023
- Production, In Physical Terms, By Country, 2012–2023
- Imports, In Physical Terms, By Country, 2012–2023
- Imports, In Value Terms, By Country, 2012–2023
- Import Prices, By Country Of Destination, 2012–2023
- Exports, In Physical Terms, By Country, 2012–2023
- Exports, In Value Terms, By Country, 2012–2023
- Export Prices, By Country Of Origin, 2012–2023
-
LIST OF FIGURES
- Market Volume, In Physical Terms, 2012–2023
- Market Value, 2012–2023
- Consumption, By Country, 2023
- Market Volume Forecast to 2030
- Market Value Forecast to 2030
- Products: Market Size And Growth, By Type
- Products: Average Per Capita Consumption, By Type
- Products: Exports And Growth, By Type
- Products: Export Prices And Growth, By Type
- Production Volume And Growth
- Exports And Growth
- Export Prices And Growth
- Market Size And Growth
- Per Capita Consumption
- Imports And Growth
- Import Prices
- Production, In Physical Terms, 2012–2023
- Production, In Value Terms, 2012–2023
- Production, By Country, 2023
- Production, In Physical Terms, By Country, 2012–2023
- Imports, In Physical Terms, 2012–2023
- Imports, In Value Terms, 2012–2023
- Imports, In Physical Terms, By Country, 2023
- Imports, In Physical Terms, By Country, 2012–2023
- Imports, In Value Terms, By Country, 2012–2023
- Import Prices, By Country, 2012–2023
- Exports, In Physical Terms, 2012–2023
- Exports, In Value Terms, 2012–2023
- Exports, In Physical Terms, By Country, 2023
- Exports, In Physical Terms, By Country, 2012–2023
- Exports, In Value Terms, By Country, 2012–2023
- Export Prices, 2012–2023
This report provides an in-depth analysis of the global activated carbon market.
This report provides an in-depth analysis of the global market for activated natural mineral products.
The global activated carbon market expanded markedly to $4.7B in 2019, rising by 5.4% against the previous year. This...
In value terms, activated carbon imports totaled $X in 2016. Overall, it indicated a strong growth from 2007 to 2016: the total imports value increased at an average annual rate of +X% over the l...
In value terms, activated carbon exports stood at $X in 2016. Overall, it indicated a remarkable increase from 2007 to 2016: the total exports value increased at an average annual rate of +X% ove...


