
U.S. Steel Wire Market. Analysis And Forecast to 2030
Get instant access to more than 2 million reports, dashboards, and datasets on the IndexBox Platform.
View PricingJune 2023 Sees An 11% Decline in U.S. Imports of Steel Wire, Totaling $179M.
U.S. Steel Wire Imports
In June 2023, supplies from abroad of steel wire decreased by -6.9% to 111K tons for the first time since February 2023, thus ending a three-month rising trend. Over the period under review, imports saw a perceptible contraction. The most prominent rate of growth was recorded in April 2023 when imports increased by 15% against the previous month.
In value terms, steel wire imports fell to $179M (IndexBox estimates) in June 2023. Overall, imports showed a perceptible slump. The pace of growth appeared the most rapid in April 2023 with an increase of 11% m-o-m. 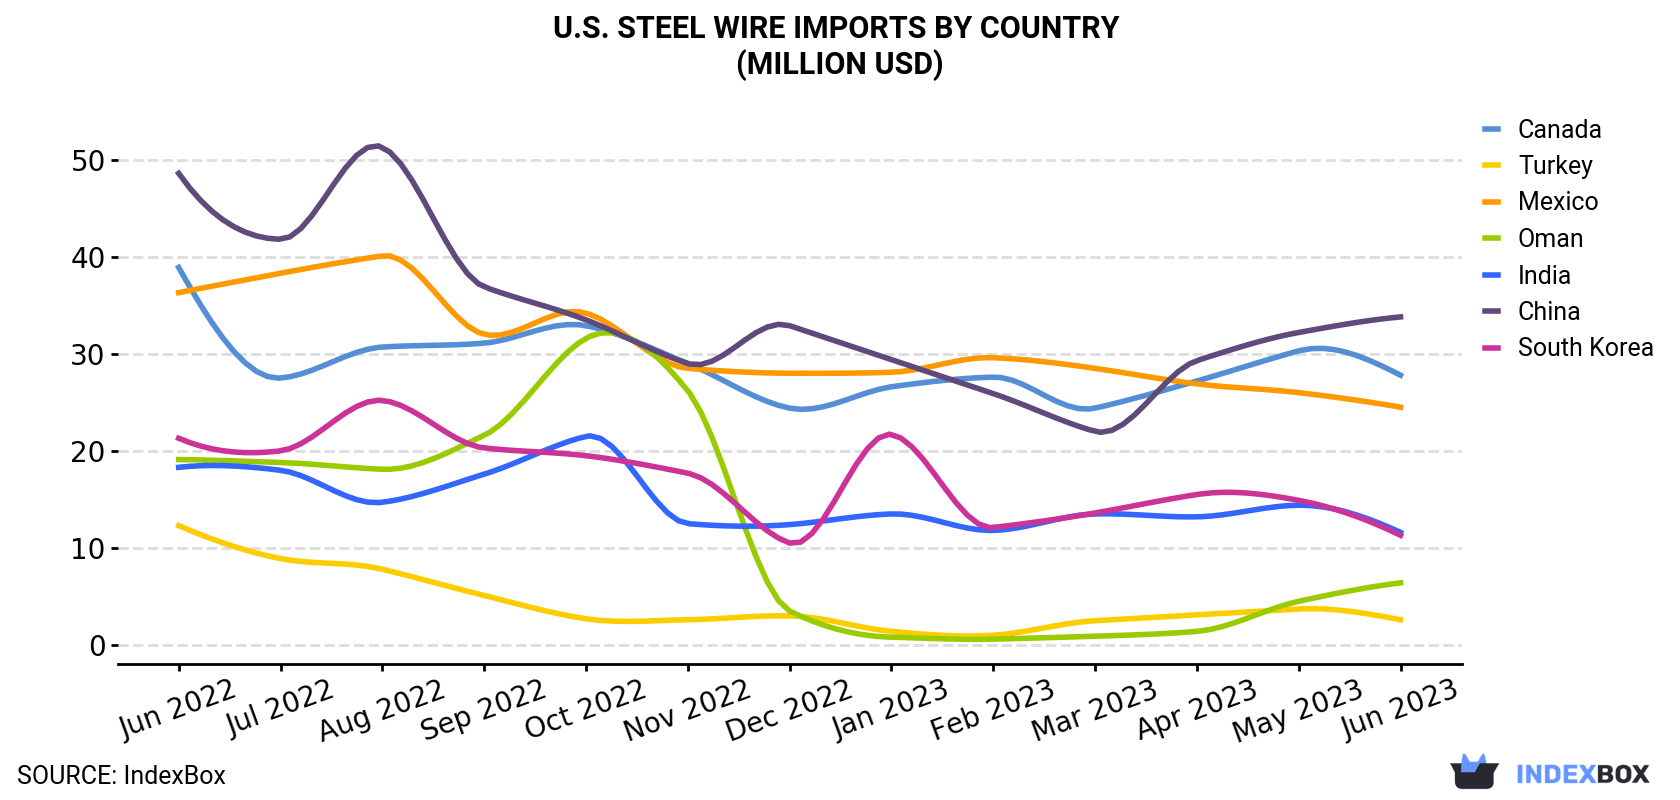
| COUNTRY | Import Value of Steel Wire in U.S. (million USD) | ||||||||||||
|---|---|---|---|---|---|---|---|---|---|---|---|---|---|
| Jun 2022 | Jul 2022 | Aug 2022 | Sep 2022 | Oct 2022 | Nov 2022 | Dec 2022 | Jan 2023 | Feb 2023 | Mar 2023 | Apr 2023 | May 2023 | Jun 2023 | |
| China | 48.6 | 41.8 | 51.3 | 36.9 | 33.5 | 29.0 | 32.9 | 29.4 | 25.9 | 22.0 | 29.3 | 32.2 | 33.8 |
| Canada | 38.9 | 27.5 | 30.7 | 31.1 | 32.9 | 29.0 | 24.4 | 26.6 | 27.6 | 24.4 | 27.2 | 30.3 | 27.8 |
| Mexico | 36.3 | 38.3 | 40.1 | 32.0 | 34.2 | 28.5 | 28.0 | 28.1 | 29.6 | 28.5 | 26.9 | 26.0 | 24.5 |
| India | 18.3 | 18.0 | 14.7 | 17.6 | 21.5 | 12.5 | 12.4 | 13.5 | 11.8 | 13.5 | 13.2 | 14.4 | 11.6 |
| South Korea | 21.3 | 20.0 | 25.2 | 20.3 | 19.5 | 17.7 | 10.5 | 21.7 | 12.1 | 13.6 | 15.5 | 14.9 | 11.3 |
| Oman | 19.1 | 18.8 | 18.1 | 21.6 | 31.6 | 26.2 | 3.5 | 0.8 | 0.6 | 0.9 | 1.4 | 4.5 | 6.4 |
| Turkey | 12.3 | 8.9 | 7.8 | 5.1 | 2.7 | 2.6 | 3.0 | 1.4 | 1.0 | 2.5 | 3.1 | 3.7 | 2.6 |
| Others | 92.5 | 99.6 | 107 | 91.5 | 99.7 | 88.1 | 84.8 | 82.9 | 61.4 | 70.5 | 78.9 | 75.2 | 60.9 |
| Total | 287 | 273 | 295 | 256 | 276 | 234 | 199 | 204 | 170 | 176 | 196 | 201 | 179 |
Imports by Country
China (30K tons), Mexico (22K tons) and Canada (13K tons) were the main suppliers of steel wire imports to the United States, together accounting for 59% of total imports.
From June 2022 to June 2023, the biggest increases were in China (with a CAGR of -1.2%), while purchases for the other leaders experienced a decline.
In value terms, China ($34M), Canada ($28M) and Mexico ($25M) constituted the largest steel wire suppliers to the United States, with a combined 48% share of total imports.
In terms of the main suppliers, Canada, with a CAGR of -2.8%, saw the highest rates of growth with regard to the value of imports, over the period under review, while purchases for the other leaders experienced a decline.
Import Prices by Country
In June 2023, the steel wire price stood at $1,606 per ton (CIF, US), reducing by -4.4% against the previous month. In general, the import price showed a slight curtailment. The pace of growth was the most pronounced in January 2023 an increase of 5.4% month-to-month. Over the period under review, average import prices attained the maximum at $2,053 per ton in September 2022; however, from October 2022 to June 2023, import prices stood at a somewhat lower figure.
There were significant differences in the average prices amongst the major supplying countries. In June 2023, the country with the highest price was South Korea ($2,221 per ton), while the price for Mexico ($1,128 per ton) was amongst the lowest.
From June 2022 to June 2023, the most notable rate of growth in terms of prices was attained by Sri Lanka (+0.0%), while the prices for the other major suppliers experienced a decline.
This report provides an in-depth analysis of the steel wire market in the U.S.. Within it, you will discover the latest data on market trends and opportunities by country, consumption, production and price developments, as well as the global trade (imports and exports). The forecast exhibits the market prospects through 2030.
Product coverage:
- NAICS 3311109 - Steel wire, including galvanized and other coated wire, made in steel mills producing wire rods or hot rolled bars
- NAICS 331222 - Steel wire drawing
Companies mentioned:
- Fort Wayne Metals Research Products Corp
- Bekaert Corporation
- Master-Halco, Gafp
- Insteel Industries
- Taubensee Steel & Wire Company
- The Heico Companies L L C
- Suncoast Post-Tension
- Southwestern Wire
- Draka Elevator Products
- Zapp Precision Wire
- Tappan Wire & Cable Inc.
- Tokusen U.S.A., Hamrock
- Davis Wire Corporation
- Laclede Chain Manufacturing Company
- National-Standard
- Owl Wire & Cable
- Barrette Outdoor Living
- Loos & Co.
- Mount Joy Wire Corporation
- Central Wire
- Tree Island Wire (usa)
- American Manufacturing
- United Wire Hanger Corp
- Bekaert North America Management Corporation
- Insteel Wire Products Company
- National Material Company
- The Gehr Group
Country coverage:
- United States
Data coverage:
- Market volume and value
- Per Capita consumption
- Forecast of the market dynamics in the medium term
- Trade (exports and imports) in the U.S.
- Export and import prices
- Market trends, drivers and restraints
- Key market players and their profiles
Reasons to buy this report:
- Take advantage of the latest data
- Find deeper insights into current market developments
- Discover vital success factors affecting the market
This report is designed for manufacturers, distributors, importers, and wholesalers, as well as for investors, consultants and advisors.
In this report, you can find information that helps you to make informed decisions on the following issues:
- How to diversify your business and benefit from new market opportunities
- How to load your idle production capacity
- How to boost your sales on overseas markets
- How to increase your profit margins
- How to make your supply chain more sustainable
- How to reduce your production and supply chain costs
- How to outsource production to other countries
- How to prepare your business for global expansion
While doing this research, we combine the accumulated expertise of our analysts and the capabilities of artificial intelligence. The AI-based platform, developed by our data scientists, constitutes the key working tool for business analysts, empowering them to discover deep insights and ideas from the marketing data.
-
1. INTRODUCTION
Making Data-Driven Decisions to Grow Your Business
- REPORT DESCRIPTION
- RESEARCH METHODOLOGY AND AI PLATFORM
- DATA-DRIVEN DECISIONS FOR YOUR BUSINESS
- GLOSSARY AND SPECIFIC TERMS
-
2. EXECUTIVE SUMMARY
A Quick Overview of Market Performance
- KEY FINDINGS
- MARKET TRENDS This Chapter is Available Only for the Professional Edition PRO
-
3. MARKET OVERVIEW
Understanding the Current State of The Market and Its Prospects
- MARKET SIZE
- MARKET STRUCTURE
- TRADE BALANCE
- PER CAPITA CONSUMPTION
- MARKET FORECAST TO 2030
-
4. MOST PROMISING PRODUCT
Finding New Products to Diversify Your Business
This Chapter is Available Only for the Professional Edition PRO- TOP PRODUCTS TO DIVERSIFY YOUR BUSINESS
- BEST-SELLING PRODUCTS
- MOST CONSUMED PRODUCT
- MOST TRADED PRODUCT
- MOST PROFITABLE PRODUCT FOR EXPORT
-
5. MOST PROMISING SUPPLYING COUNTRIES
Choosing the Best Countries to Establish Your Sustainable Supply Chain
This Chapter is Available Only for the Professional Edition PRO- TOP COUNTRIES TO SOURCE YOUR PRODUCT
- TOP PRODUCING COUNTRIES
- TOP EXPORTING COUNTRIES
- LOW-COST EXPORTING COUNTRIES
-
6. MOST PROMISING OVERSEAS MARKETS
Choosing the Best Countries to Boost Your Exports
This Chapter is Available Only for the Professional Edition PRO- TOP OVERSEAS MARKETS FOR EXPORTING YOUR PRODUCT
- TOP CONSUMING MARKETS
- UNSATURATED MARKETS
- TOP IMPORTING MARKETS
- MOST PROFITABLE MARKETS
7. PRODUCTION
The Latest Trends and Insights into The Industry
- PRODUCTION VOLUME AND VALUE
8. IMPORTS
The Largest Import Supplying Countries
- IMPORTS FROM 2012–2023
- IMPORTS BY COUNTRY
- IMPORT PRICES BY COUNTRY
9. EXPORTS
The Largest Destinations for Exports
- EXPORTS FROM 2012–2023
- EXPORTS BY COUNTRY
- EXPORT PRICES BY COUNTRY
-
10. PROFILES OF MAJOR PRODUCERS
The Largest Producers on The Market and Their Profiles
This Chapter is Available Only for the Professional Edition PRO -
LIST OF TABLES
- Key Findings In 2023
- Market Volume, In Physical Terms, 2012–2023
- Market Value, 2012–2023
- Per Capita Consumption In 2012-2023
- Imports, In Physical Terms, By Country, 2012–2023
- Imports, In Value Terms, By Country, 2012–2023
- Import Prices, By Country Of Origin, 2012–2023
- Exports, In Physical Terms, By Country, 2012–2023
- Exports, In Value Terms, By Country, 2012–2023
- Export Prices, By Country Of Destination, 2012–2023
-
LIST OF FIGURES
- Market Volume, In Physical Terms, 2012–2023
- Market Value, 2012–2023
- Market Structure – Domestic Supply vs. Imports, In Physical Terms, 2012-2023
- Market Structure – Domestic Supply vs. Imports, In Value Terms, 2012-2023
- Trade Balance, In Physical Terms, 2012-2023
- Trade Balance, In Value Terms, 2012-2023
- Per Capita Consumption, 2012-2023
- Market Volume Forecast to 2030
- Market Value Forecast to 2030
- Products: Market Size And Growth, By Type
- Products: Average Per Capita Consumption, By Type
- Products: Exports And Growth, By Type
- Products: Export Prices And Growth, By Type
- Production Volume And Growth
- Exports And Growth
- Export Prices And Growth
- Market Size And Growth
- Per Capita Consumption
- Imports And Growth
- Import Prices
- Production, In Physical Terms, 2012–2023
- Production, In Value Terms, 2012–2023
- Imports, In Physical Terms, 2012–2023
- Imports, In Value Terms, 2012–2023
- Imports, In Physical Terms, By Country, 2023
- Imports, In Physical Terms, By Country, 2012–2023
- Imports, In Value Terms, By Country, 2012–2023
- Import Prices, By Country Of Origin, 2012–2023
- Exports, In Physical Terms, 2012–2023
- Exports, In Value Terms, 2012–2023
- Exports, In Physical Terms, By Country, 2023
- Exports, In Physical Terms, By Country, 2012–2023
- Exports, In Value Terms, By Country, 2012–2023
- Export Prices, By Country Of Destination, 2012–2023


