U.S. - Dried Milk - Market Analysis, Forecast, Size, Trends and Insights
Get instant access to more than 2 million reports, dashboards, and datasets on the IndexBox Platform.
View PricingUS Powdered Milk Exports Plummet to $198M in June 2023
U.S. Powdered Milk Exports
In June 2023, the amount of powdered milk exported from the United States reduced to 71K tons, which is down by -13.8% against May 2023 figures. In general, exports recorded a relatively flat trend pattern. The growth pace was the most rapid in March 2023 when exports increased by 23% against the previous month.
In value terms, powdered milk exports declined markedly to $198M (IndexBox estimates) in June 2023. Over the period under review, exports continue to indicate a pronounced contraction. The most prominent rate of growth was recorded in March 2023 when exports increased by 16% against the previous month. 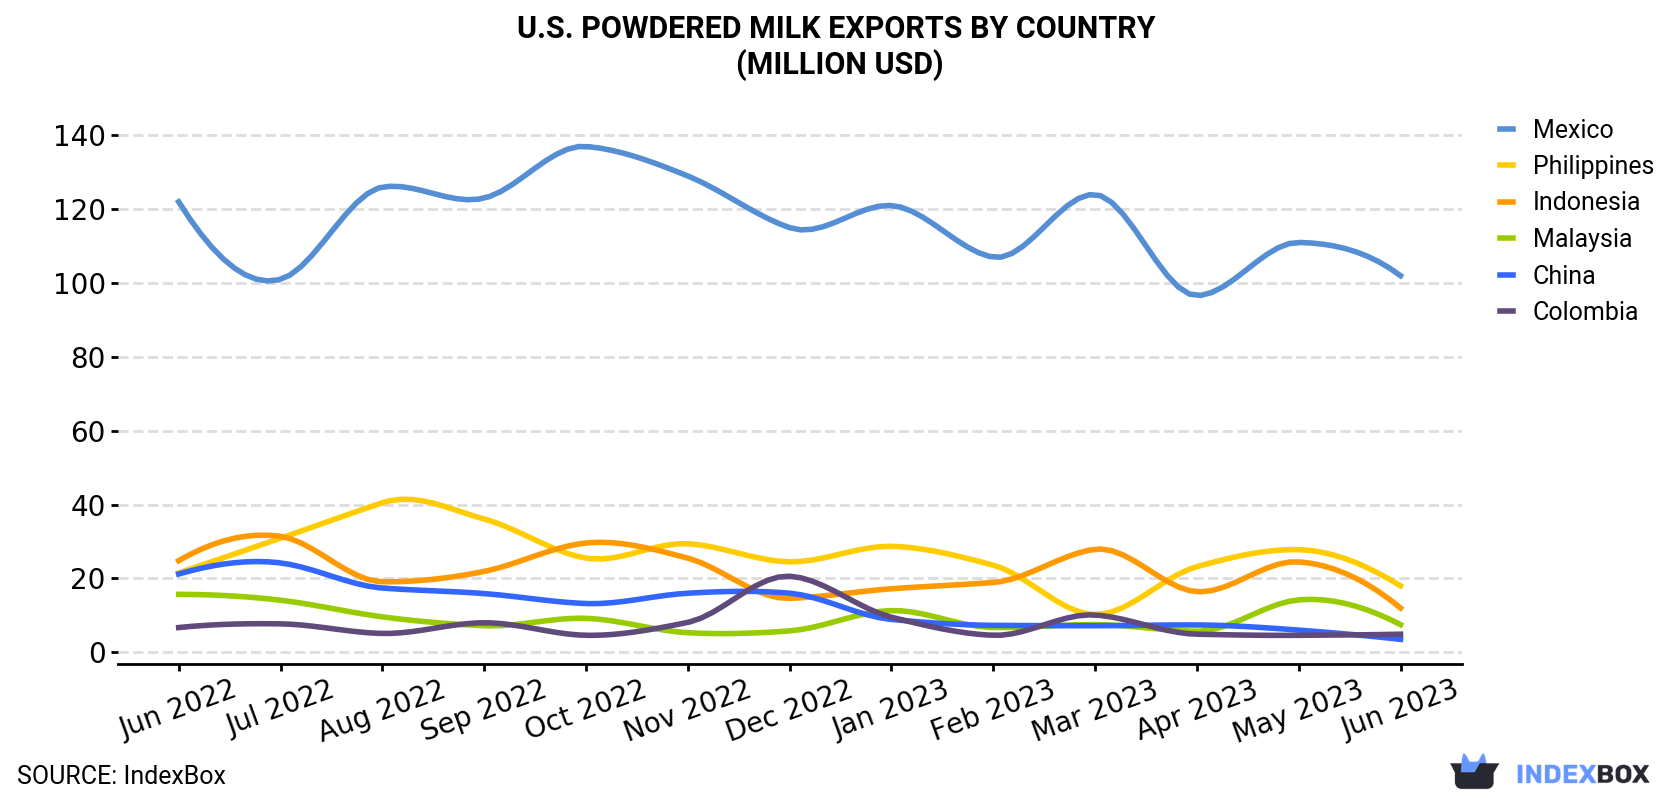
| COUNTRY | Export Value of Powdered Milk in U.S. (million USD) | ||||||||||||
|---|---|---|---|---|---|---|---|---|---|---|---|---|---|
| Jun 2022 | Jul 2022 | Aug 2022 | Sep 2022 | Oct 2022 | Nov 2022 | Dec 2022 | Jan 2023 | Feb 2023 | Mar 2023 | Apr 2023 | May 2023 | Jun 2023 | |
| Mexico | 122 | 101 | 126 | 123 | 137 | 129 | 115 | 121 | 107 | 124 | 96.6 | 111 | 102 |
| Philippines | 21.5 | 30.9 | 40.5 | 36.1 | 25.5 | 29.4 | 24.5 | 28.7 | 23.6 | 10.2 | 23.2 | 27.8 | 18.0 |
| Indonesia | 24.8 | 31.4 | 19.1 | 21.9 | 29.6 | 25.5 | 14.6 | 17.2 | 18.9 | 27.9 | 16.4 | 24.5 | 12.0 |
| Malaysia | 15.7 | 14.1 | 9.6 | 7.2 | 9.2 | 5.3 | 5.8 | 11.3 | 6.7 | 7.5 | 5.7 | 14.2 | 7.5 |
| Colombia | 6.7 | 7.7 | 5.1 | 8.0 | 4.6 | 8.1 | 20.6 | 9.5 | 4.6 | 10.1 | 4.9 | 4.6 | 4.9 |
| China | 21.2 | 24.2 | 17.4 | 15.9 | 13.2 | 16.0 | 16.0 | 8.9 | 7.3 | 7.2 | 7.4 | 6.0 | 3.5 |
| Others | 72.4 | 57.0 | 58.7 | 47.4 | 55.2 | 54.8 | 41.5 | 38.7 | 37.7 | 52.4 | 53.6 | 51.8 | 50.2 |
| Total | 284 | 266 | 277 | 259 | 275 | 269 | 238 | 235 | 206 | 240 | 208 | 239 | 198 |
Exports by Country
Mexico (37K tons) was the main destination for powdered milk exports from the United States, with a 53% share of total exports. Moreover, powdered milk exports to Mexico exceeded the volume sent to the second major destination, the Philippines (6.3K tons), sixfold. Indonesia (4.4K tons) ranked third in terms of total exports with a 6.2% share.
From June 2022 to June 2023, the average monthly rate of growth in terms of volume to Mexico amounted to +1.5%. Exports to the other major destinations recorded the following average monthly rates of exports growth: the Philippines (+1.2% per month) and Indonesia (-2.8% per month).
In value terms, Mexico ($102M) remains the key foreign market for powdered milk exports from the United States, comprising 52% of total exports. The second position in the ranking was taken by the Philippines ($18M), with a 9.1% share of total exports. It was followed by Indonesia, with a 6.1% share.
From June 2022 to June 2023, the average monthly rate of growth in terms of value to Mexico amounted to -1.5%. Exports to the other major destinations recorded the following average monthly rates of exports growth: the Philippines (-1.5% per month) and Indonesia (-5.8% per month).
Exports by Type
Dairy produce (69K tons) was the largest type of powdered milk exported from the United States, accounting for a 97% share of total exports. It was followed by dairy produce; milk and cream, concentrated, not containing added sugar or other sweetening matter, in powder, granules or other solid forms, of a fat content exceeding 1.5% (by weight) (1.8K tons), with a 2.5% share of total exports.
From June 2022 to June 2023, the average monthly rate of growth in terms of the volume of export of dairy produce was relatively modest. With regard to the other exported products, the following average monthly rates of growth were recorded: dairy produce; milk and cream, concentrated, not containing added sugar or other sweetening matter, in powder, granules or other solid forms, of a fat content exceeding 1.5% (by weight) (-5.8% per month) and dairy produce; milk and cream, containing added sugar or other sweetening matter, in powder, granules or other solid forms, of a fat content exceeding 1.5% (by weight) (+2.0% per month).
In value terms, dairy produce ($193M) remains the largest type of powdered milk exported from the United States, comprising 97% of total exports. The second position in the ranking was taken by dairy produce; milk and cream, concentrated, not containing added sugar or other sweetening matter, in powder, granules or other solid forms, of a fat content exceeding 1.5% (by weight) ($5.5M), with a 2.8% share of total exports.
From June 2022 to June 2023, the average monthly rate of growth in terms of the export volume of dairy produce amounted to -2.7%. With regard to the other exported products, the following average monthly rates of growth were recorded: dairy produce; milk and cream, concentrated, not containing added sugar or other sweetening matter, in powder, granules or other solid forms, of a fat content exceeding 1.5% (by weight) (-8.1% per month) and dairy produce; milk and cream, containing added sugar or other sweetening matter, in powder, granules or other solid forms, of a fat content exceeding 1.5% (by weight) (+3.1% per month).
Export Prices by Country
In June 2023, the powdered milk price stood at $2,796 per ton (FOB, US), declining by -4% against the previous month. Over the period under review, the export price continues to indicate a pronounced reduction. The most prominent rate of growth was recorded in July 2022 an increase of 1.1% m-o-m. As a result, the export price reached the peak level of $3,997 per ton. From August 2022 to June 2023, the the average export prices remained at a somewhat lower figure.
Average prices varied noticeably for the major foreign markets. In June 2023, the highest price was recorded for prices to Peru ($3,246 per ton) and Malaysia ($3,095 per ton), while the average price for exports to Vietnam ($2,625 per ton) and Honduras ($2,689 per ton) were amongst the lowest.
From June 2022 to June 2023, the most notable rate of growth in terms of prices was recorded for supplies to Peru (-1.5%), while the prices for the other major destinations experienced a decline.
This report provides an in-depth analysis of the powdered milk market in the U.S.. Within it, you will discover the latest data on market trends and opportunities by country, consumption, production and price developments, as well as the global trade (imports and exports). The forecast exhibits the market prospects through 2030.
Product coverage:
- FCL 897 - Dry Whole Cow Milk
- FCL 898 - Dry Skim Cow Milk
Country coverage:
- United States
Data coverage:
- Market volume and value
- Per Capita consumption
- Forecast of the market dynamics in the medium term
- Trade (exports and imports) in the U.S.
- Export and import prices
- Market trends, drivers and restraints
- Key market players and their profiles
Reasons to buy this report:
- Take advantage of the latest data
- Find deeper insights into current market developments
- Discover vital success factors affecting the market
This report is designed for manufacturers, distributors, importers, and wholesalers, as well as for investors, consultants and advisors.
In this report, you can find information that helps you to make informed decisions on the following issues:
- How to diversify your business and benefit from new market opportunities
- How to load your idle production capacity
- How to boost your sales on overseas markets
- How to increase your profit margins
- How to make your supply chain more sustainable
- How to reduce your production and supply chain costs
- How to outsource production to other countries
- How to prepare your business for global expansion
While doing this research, we combine the accumulated expertise of our analysts and the capabilities of artificial intelligence. The AI-based platform, developed by our data scientists, constitutes the key working tool for business analysts, empowering them to discover deep insights and ideas from the marketing data.
-
1. INTRODUCTION
Making Data-Driven Decisions to Grow Your Business
- REPORT DESCRIPTION
- RESEARCH METHODOLOGY AND AI PLATFORM
- DATA-DRIVEN DECISIONS FOR YOUR BUSINESS
- GLOSSARY AND SPECIFIC TERMS
-
2. EXECUTIVE SUMMARY
A Quick Overview of Market Performance
- KEY FINDINGS
- MARKET TRENDS This Chapter is Available Only for the Professional Edition PRO
-
3. MARKET OVERVIEW
Understanding the Current State of The Market and Its Prospects
- MARKET SIZE
- MARKET STRUCTURE
- TRADE BALANCE
- PER CAPITA CONSUMPTION
- MARKET FORECAST TO 2030
-
4. MOST PROMISING PRODUCT
Finding New Products to Diversify Your Business
This Chapter is Available Only for the Professional Edition PRO- TOP PRODUCTS TO DIVERSIFY YOUR BUSINESS
- BEST-SELLING PRODUCTS
- MOST CONSUMED PRODUCT
- MOST TRADED PRODUCT
- MOST PROFITABLE PRODUCT FOR EXPORT
-
5. MOST PROMISING SUPPLYING COUNTRIES
Choosing the Best Countries to Establish Your Sustainable Supply Chain
This Chapter is Available Only for the Professional Edition PRO- TOP COUNTRIES TO SOURCE YOUR PRODUCT
- TOP PRODUCING COUNTRIES
- COUNTRIES WITH TOP YIELDS
- TOP EXPORTING COUNTRIES
- LOW-COST EXPORTING COUNTRIES
-
6. MOST PROMISING OVERSEAS MARKETS
Choosing the Best Countries to Boost Your Exports
This Chapter is Available Only for the Professional Edition PRO- TOP OVERSEAS MARKETS FOR EXPORTING YOUR PRODUCT
- TOP CONSUMING MARKETS
- UNSATURATED MARKETS
- TOP IMPORTING MARKETS
- MOST PROFITABLE MARKETS
7. PRODUCTION
The Latest Trends and Insights into The Industry
- PRODUCTION, PRODUCING ANIMALS AND YIELD
8. IMPORTS
The Largest Import Supplying Countries
- IMPORTS FROM 2012–2023
- IMPORTS BY COUNTRY
- IMPORT PRICES BY COUNTRY
9. EXPORTS
The Largest Destinations for Exports
- EXPORTS FROM 2012–2023
- EXPORTS BY COUNTRY
- EXPORT PRICES BY COUNTRY
-
10. PROFILES OF MAJOR PRODUCERS
The Largest Producers on The Market and Their Profiles
This Chapter is Available Only for the Professional Edition PRO -
LIST OF TABLES
- Key Findings In 2023
- Market Volume, In Physical Terms, 2012–2023
- Market Value, 2012–2023
- Per Capita Consumption In 2012-2023
- Imports, In Physical Terms, By Country, 2012–2023
- Imports, In Value Terms, By Country, 2012–2023
- Import Prices, By Country Of Origin, 2012–2023
- Exports, In Physical Terms, By Country, 2012–2023
- Exports, In Value Terms, By Country, 2012–2023
- Export Prices, By Country Of Destination, 2012–2023
-
LIST OF FIGURES
- Market Volume, In Physical Terms, 2012–2023
- Market Value, 2012–2023
- Market Structure – Domestic Supply vs. Imports, In Physical Terms, 2012-2023
- Market Structure – Domestic Supply vs. Imports, In Value Terms, 2012-2023
- Trade Balance, In Physical Terms, 2012-2023
- Trade Balance, In Value Terms, 2012-2023
- Per Capita Consumption, 2012-2023
- Market Volume Forecast to 2030
- Market Value Forecast to 2030
- Products: Market Size And Growth, By Type
- Products: Average Per Capita Consumption, By Type
- Products: Exports And Growth, By Type
- Products: Export Prices And Growth, By Type
- Production Volume And Growth
- Yield And Growth
- Exports And Growth
- Export Prices And Growth
- Market Size And Growth
- Per Capita Consumption
- Imports And Growth
- Import Prices
- Production, In Physical Terms, 2012–2023
- Production, In Value Terms, 2012–2023
- Producing Animals Slaughtered, 2012–2023
- Yield, 2012–2023
- Imports, In Physical Terms, 2012–2023
- Imports, In Value Terms, 2012–2023
- Imports, In Physical Terms, By Country, 2023
- Imports, In Physical Terms, By Country, 2012–2023
- Imports, In Value Terms, By Country, 2012–2023
- Import Prices, By Country Of Origin, 2012–2023
- Exports, In Physical Terms, 2012–2023
- Exports, In Value Terms, 2012–2023
- Exports, In Physical Terms, By Country, 2023
- Exports, In Physical Terms, By Country, 2012–2023
- Exports, In Value Terms, By Country, 2012–2023
- Export Prices, By Country Of Destination, 2012–2023


