
U.S. Motor And Generator Market. Analysis And Forecast to 2030
Get instant access to more than 2 million reports, dashboards, and datasets on the IndexBox Platform.
View PricingImports of Motors and Generators in the U.S. Rise Modestly to $1.6B in October 2023
U.S. Motor And Generator Imports
In October 2023, the amount of motors and generators imported into the United States rose sharply to 80M units, with an increase of 9.2% on the previous month. Over the period under review, imports saw a relatively flat trend pattern. The pace of growth was the most pronounced in July 2023 when imports increased by 12% m-o-m. Imports peaked at 81M units in August 2023; however, from September 2023 to October 2023, imports remained at a lower figure.
In value terms, motor and generator imports expanded markedly to $1.6B (IndexBox estimates) in October 2023. In general, imports, however, saw a relatively flat trend pattern. The growth pace was the most rapid in March 2023 with an increase of 11% against the previous month. Imports peaked at 1.6B units in May 2023; however, from June 2023 to October 2023, imports failed to regain momentum.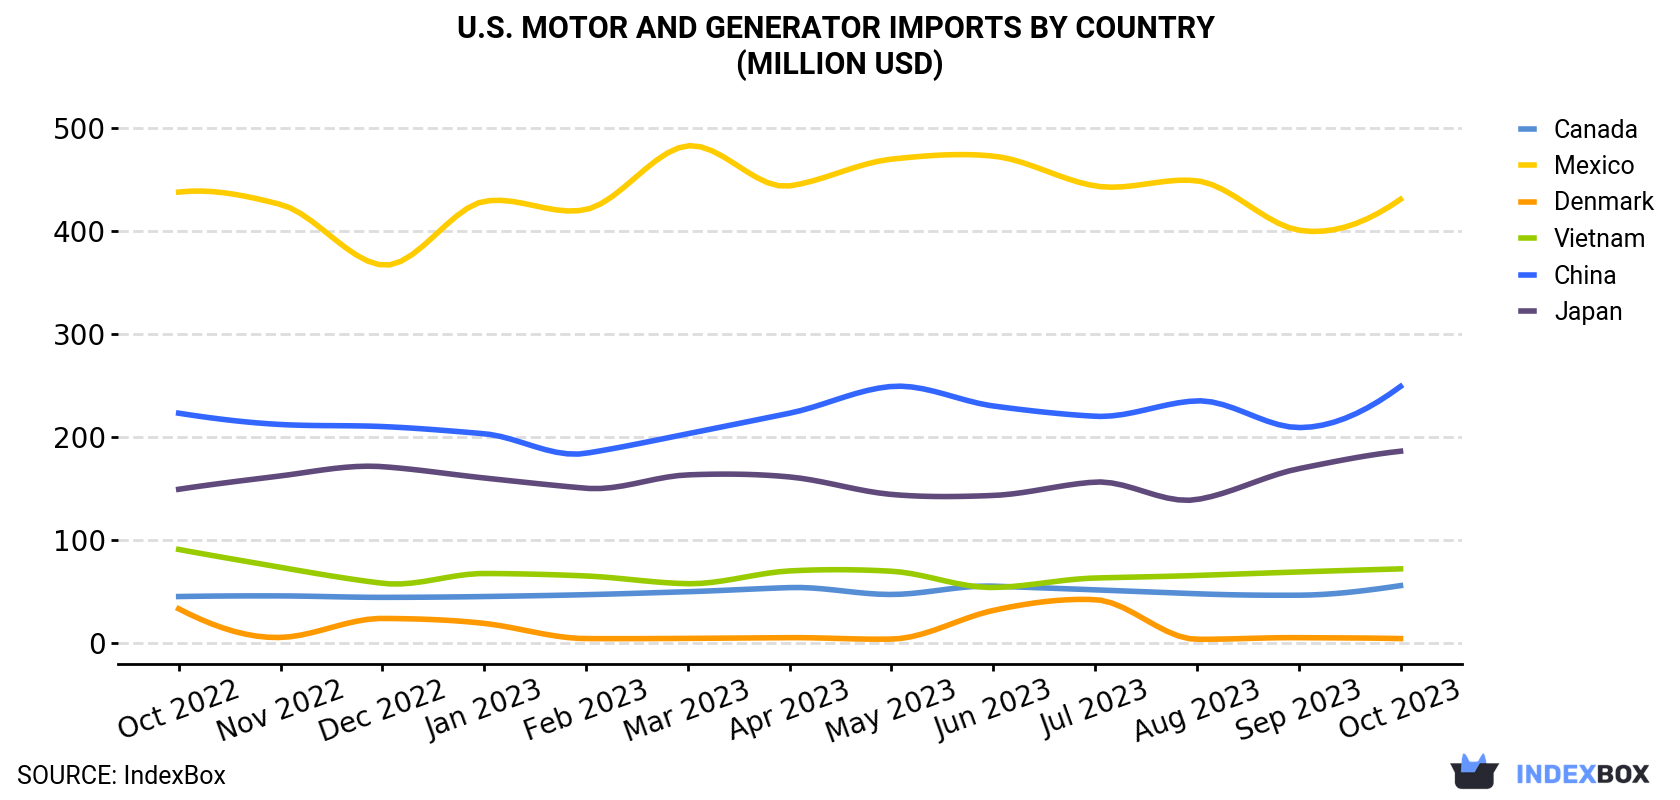
| COUNTRY | Import Value of Motor And Generator in U.S. (million USD) | ||||||||||||
|---|---|---|---|---|---|---|---|---|---|---|---|---|---|
| Oct 2022 | Nov 2022 | Dec 2022 | Jan 2023 | Feb 2023 | Mar 2023 | Apr 2023 | May 2023 | Jun 2023 | Jul 2023 | Aug 2023 | Sep 2023 | Oct 2023 | |
| Mexico | 438 | 426 | 367 | 429 | 421 | 483 | 444 | 470 | 473 | 444 | 449 | 401 | 431 |
| China | 223 | 212 | 210 | 203 | 184 | 203 | 223 | 249 | 230 | 220 | 235 | 209 | 249 |
| Japan | 149 | 162 | 171 | 160 | 150 | 163 | 161 | 144 | 143 | 156 | 139 | 169 | 186 |
| Vietnam | 90.5 | 73.1 | 57.6 | 67.1 | 64.7 | 57.2 | 69.6 | 69.3 | 53.5 | 62.7 | 65.2 | 68.6 | 71.6 |
| Canada | 44.7 | 45.3 | 43.9 | 44.7 | 46.5 | 49.4 | 53.4 | 46.7 | 54.8 | 51.2 | 47.4 | 46.0 | 55.3 |
| Denmark | 32.8 | 4.9 | 23.4 | 18.6 | 3.8 | 4.0 | 4.7 | 3.3 | 31.2 | 41.7 | 3.1 | 4.7 | 3.8 |
| Others | 614 | 558 | 539 | 568 | 512 | 581 | 569 | 617 | 569 | 609 | 615 | 527 | 570 |
| Total | 1,592 | 1,482 | 1,412 | 1,492 | 1,382 | 1,541 | 1,524 | 1,598 | 1,554 | 1,584 | 1,553 | 1,424 | 1,567 |
Imports by Country
Mexico (19M units), China (17M units) and Vietnam (8.4M units) were the main suppliers of motor and generator imports to the United States, with a combined 55% share of total imports.
From October 2022 to October 2023, the biggest increases were in Vietnam (with a CAGR of +4.0%), while purchases for the other leaders experienced more modest paces of growth.
In value terms, the largest motor and generator suppliers to the United States were Mexico ($431M), China ($249M) and Japan ($186M), together comprising 55% of total imports.
Among the main suppliers, Japan, with a CAGR of +1.9%, saw the highest rates of growth with regard to the value of imports, over the period under review, while purchases for the other leaders experienced more modest paces of growth.
Import Prices by Country
In October 2023, the motor and generator price amounted to $19.5 per unit (CIF, US), stabilizing at the previous month. In general, the import price, however, showed a relatively flat trend pattern. The most prominent rate of growth was recorded in February 2023 an increase of 10% month-to-month. Over the period under review, average import prices attained the maximum at $22.4 per unit in June 2023; however, from July 2023 to October 2023, import prices failed to regain momentum.
Prices varied noticeably by the country of origin: the country with the highest price was Denmark ($51.5 per unit), while the price for the Philippines ($7.1 per unit) was amongst the lowest.
From October 2022 to October 2023, the most notable rate of growth in terms of prices was attained by Denmark (+14.3%), while the prices for the other major suppliers experienced more modest paces of growth.
This report provides an in-depth analysis of the motor and generator market in the U.S.. Within it, you will discover the latest data on market trends and opportunities by country, consumption, production and price developments, as well as the global trade (imports and exports). The forecast exhibits the market prospects through 2030.
Product coverage:
- NAICS 335312 - Motor and generator manufacturing
Companies mentioned:
- Hamilton Sundstrand Corporation
- Ametek, Bwx Technologies
- Regal-Beloit Corporation
- Nidec Motor Corporation
- Baldor Electric Company
- Franklin Electric Co.
- Generac Power Systems
- Yaskawa America
- Cummins Power Generation
- Electro-Motive Diesel
- Toshiba International Corporation
- NRG Energy
- Luvata Grenada
- Teco-Westinghouse Motor Company
- Regal Beloit America
- Kollmorgen Corporation
- Kato Engineering
- Leroy-Somer
- The Hines Group
- Generac Power Systems
- Allied Motion Technologies
- GE Energy Manufacturing
- Kinetek
- Jordan Industries
- Exx
- AES Alamitos
- Briggs & Stratton Power Products Group
- US Test Company 509
- Generac Holdings
- Teco Holdings Usa
- Nidec US Holdings Corporation
Country coverage:
- United States
Data coverage:
- Market volume and value
- Per Capita consumption
- Forecast of the market dynamics in the medium term
- Trade (exports and imports) in the U.S.
- Export and import prices
- Market trends, drivers and restraints
- Key market players and their profiles
Reasons to buy this report:
- Take advantage of the latest data
- Find deeper insights into current market developments
- Discover vital success factors affecting the market
This report is designed for manufacturers, distributors, importers, and wholesalers, as well as for investors, consultants and advisors.
In this report, you can find information that helps you to make informed decisions on the following issues:
- How to diversify your business and benefit from new market opportunities
- How to load your idle production capacity
- How to boost your sales on overseas markets
- How to increase your profit margins
- How to make your supply chain more sustainable
- How to reduce your production and supply chain costs
- How to outsource production to other countries
- How to prepare your business for global expansion
While doing this research, we combine the accumulated expertise of our analysts and the capabilities of artificial intelligence. The AI-based platform, developed by our data scientists, constitutes the key working tool for business analysts, empowering them to discover deep insights and ideas from the marketing data.
-
1. INTRODUCTION
Making Data-Driven Decisions to Grow Your Business
- REPORT DESCRIPTION
- RESEARCH METHODOLOGY AND AI PLATFORM
- DATA-DRIVEN DECISIONS FOR YOUR BUSINESS
- GLOSSARY AND SPECIFIC TERMS
-
2. EXECUTIVE SUMMARY
A Quick Overview of Market Performance
- KEY FINDINGS
- MARKET TRENDS This Chapter is Available Only for the Professional Edition PRO
-
3. MARKET OVERVIEW
Understanding the Current State of The Market and Its Prospects
- MARKET SIZE
- MARKET STRUCTURE
- TRADE BALANCE
- PER CAPITA CONSUMPTION
- MARKET FORECAST TO 2030
-
4. MOST PROMISING PRODUCT
Finding New Products to Diversify Your Business
This Chapter is Available Only for the Professional Edition PRO- TOP PRODUCTS TO DIVERSIFY YOUR BUSINESS
- BEST-SELLING PRODUCTS
- MOST CONSUMED PRODUCT
- MOST TRADED PRODUCT
- MOST PROFITABLE PRODUCT FOR EXPORT
-
5. MOST PROMISING SUPPLYING COUNTRIES
Choosing the Best Countries to Establish Your Sustainable Supply Chain
This Chapter is Available Only for the Professional Edition PRO- TOP COUNTRIES TO SOURCE YOUR PRODUCT
- TOP PRODUCING COUNTRIES
- TOP EXPORTING COUNTRIES
- LOW-COST EXPORTING COUNTRIES
-
6. MOST PROMISING OVERSEAS MARKETS
Choosing the Best Countries to Boost Your Exports
This Chapter is Available Only for the Professional Edition PRO- TOP OVERSEAS MARKETS FOR EXPORTING YOUR PRODUCT
- TOP CONSUMING MARKETS
- UNSATURATED MARKETS
- TOP IMPORTING MARKETS
- MOST PROFITABLE MARKETS
7. PRODUCTION
The Latest Trends and Insights into The Industry
- PRODUCTION VOLUME AND VALUE
8. IMPORTS
The Largest Import Supplying Countries
- IMPORTS FROM 2012–2023
- IMPORTS BY COUNTRY
- IMPORT PRICES BY COUNTRY
9. EXPORTS
The Largest Destinations for Exports
- EXPORTS FROM 2012–2023
- EXPORTS BY COUNTRY
- EXPORT PRICES BY COUNTRY
-
10. PROFILES OF MAJOR PRODUCERS
The Largest Producers on The Market and Their Profiles
This Chapter is Available Only for the Professional Edition PRO -
LIST OF TABLES
- Key Findings In 2023
- Market Volume, In Physical Terms, 2012–2023
- Market Value, 2012–2023
- Per Capita Consumption In 2012-2023
- Imports, In Physical Terms, By Country, 2012–2023
- Imports, In Value Terms, By Country, 2012–2023
- Import Prices, By Country Of Origin, 2012–2023
- Exports, In Physical Terms, By Country, 2012–2023
- Exports, In Value Terms, By Country, 2012–2023
- Export Prices, By Country Of Destination, 2012–2023
-
LIST OF FIGURES
- Market Volume, In Physical Terms, 2012–2023
- Market Value, 2012–2023
- Market Structure – Domestic Supply vs. Imports, In Physical Terms, 2012-2023
- Market Structure – Domestic Supply vs. Imports, In Value Terms, 2012-2023
- Trade Balance, In Physical Terms, 2012-2023
- Trade Balance, In Value Terms, 2012-2023
- Per Capita Consumption, 2012-2023
- Market Volume Forecast to 2030
- Market Value Forecast to 2030
- Products: Market Size And Growth, By Type
- Products: Average Per Capita Consumption, By Type
- Products: Exports And Growth, By Type
- Products: Export Prices And Growth, By Type
- Production Volume And Growth
- Exports And Growth
- Export Prices And Growth
- Market Size And Growth
- Per Capita Consumption
- Imports And Growth
- Import Prices
- Production, In Physical Terms, 2012–2023
- Production, In Value Terms, 2012–2023
- Imports, In Physical Terms, 2012–2023
- Imports, In Value Terms, 2012–2023
- Imports, In Physical Terms, By Country, 2023
- Imports, In Physical Terms, By Country, 2012–2023
- Imports, In Value Terms, By Country, 2012–2023
- Import Prices, By Country Of Origin, 2012–2023
- Exports, In Physical Terms, 2012–2023
- Exports, In Value Terms, 2012–2023
- Exports, In Physical Terms, By Country, 2023
- Exports, In Physical Terms, By Country, 2012–2023
- Exports, In Value Terms, By Country, 2012–2023
- Export Prices, By Country Of Destination, 2012–2023


