
U.S. Lime Market. Analysis And Forecast to 2030
Get instant access to more than 2 million reports, dashboards, and datasets on the IndexBox Platform.
View PricingAverage Lime Price Drops 6% in the United States to $212 per Ton
U.S. Lime Import Price in August 2023
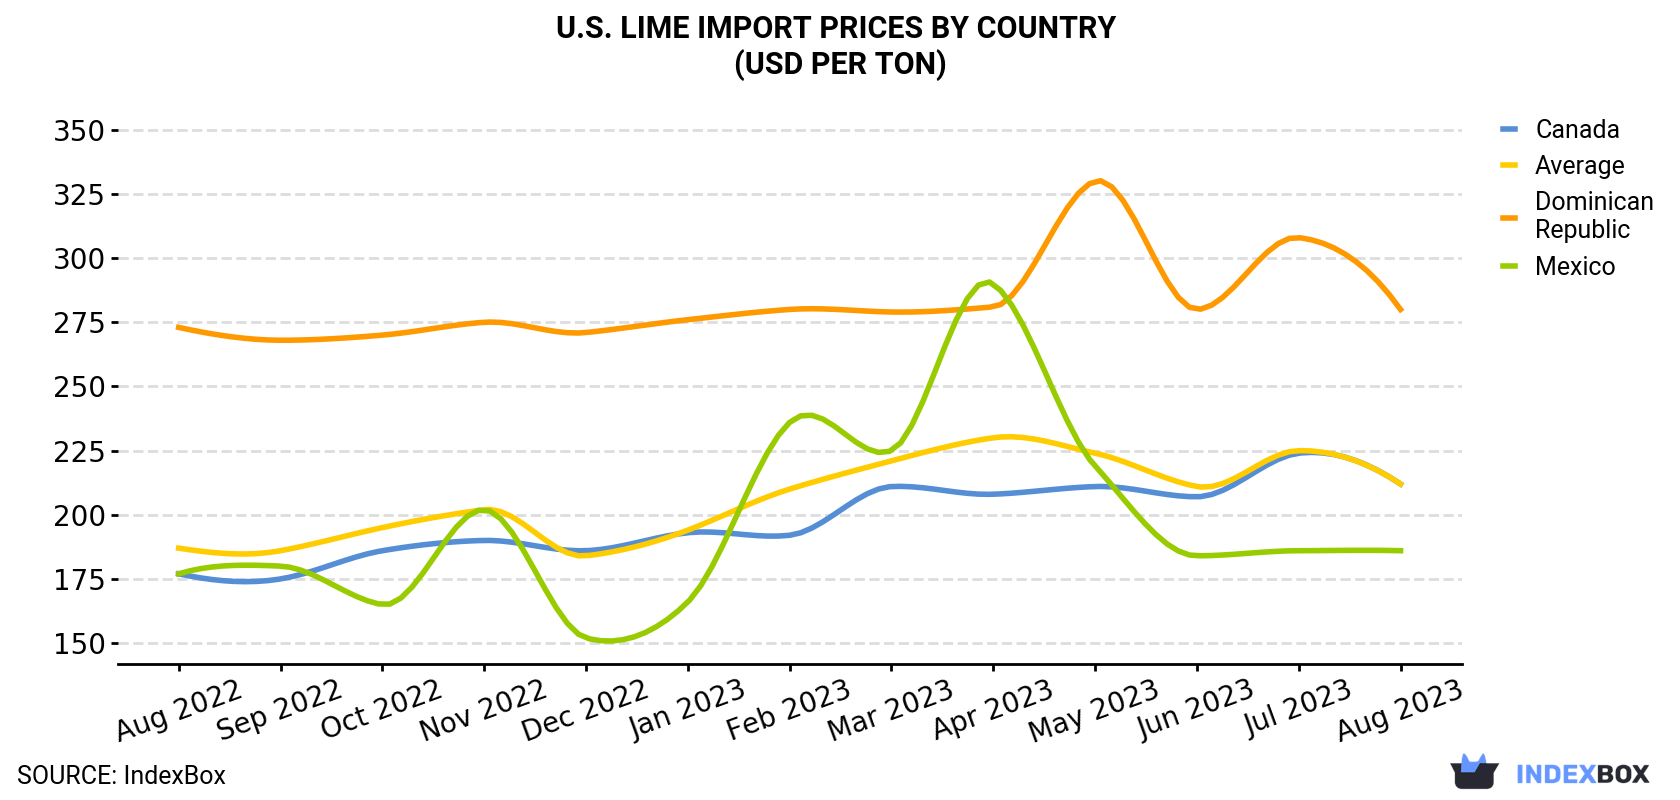
In August 2023, the lime price amounted to $212 per ton (CIF, US), declining by -5.9% against the previous month. Over the period from August 2022 to August 2023, it increased at an average monthly rate of +1.0%. The pace of growth was the most pronounced in February 2023 an increase of 8.1% month-to-month. The import price peaked at $230 per ton in April 2023; however, from May 2023 to August 2023, import prices failed to regain momentum.
There were significant differences in the average prices amongst the major supplying countries. In August 2023, the country with the highest price was the Dominican Republic ($280 per ton), while the price for Mexico ($186 per ton) was amongst the lowest.
From August 2022 to August 2023, the most notable rate of growth in terms of prices was attained by Canada (+1.5%), while the prices for the other major suppliers experienced more modest paces of growth.
| COUNTRY | Import Price of Lime in U.S. (USD per ton) | ||||||||||||
|---|---|---|---|---|---|---|---|---|---|---|---|---|---|
| Aug 2022 | Sep 2022 | Oct 2022 | Nov 2022 | Dec 2022 | Jan 2023 | Feb 2023 | Mar 2023 | Apr 2023 | May 2023 | Jun 2023 | Jul 2023 | Aug 2023 | |
| Dominican Republic | 273 | 268 | 270 | 275 | 271 | 276 | 280 | 279 | 281 | 330 | 280 | 308 | 280 |
| Canada | 177 | 175 | 186 | 190 | 186 | 193 | 192 | 211 | 208 | 211 | 207 | 224 | 212 |
| Mexico | 177 | 180 | 165 | 202 | 152 | 166 | 236 | 225 | 290 | 219 | 184 | 186 | 186 |
| Average | 187 | 186 | 195 | 202 | 184 | 194 | 210 | 221 | 230 | 224 | 211 | 225 | 212 |
U.S. Lime Imports
After two months of decline, overseas purchases of lime increased by 32% to 36K tons in August 2023. Over the period under review, imports, however, showed a relatively flat trend pattern. The pace of growth was the most pronounced in May 2023 with an increase of 64% against the previous month.
In value terms, lime imports skyrocketed to $7.6M (IndexBox estimates) in August 2023. Overall, imports saw a relatively flat trend pattern. The pace of growth appeared the most rapid in May 2023 with an increase of 60% m-o-m. Imports peaked in August 2023.
U.S. Lime Imports by Country
In August 2023, Canada (27K tons) constituted the largest lime supplier to the United States, accounting for a 75% share of total imports. Moreover, lime imports from Canada exceeded the figures recorded by the second-largest supplier, Mexico (8K tons), threefold.
From August 2022 to August 2023, the average monthly rate of growth in terms of volume from Canada was relatively modest. The remaining supplying countries recorded the following average monthly rates of imports growth: Mexico (+0.4% per month) and the Dominican Republic (+8.3% per month).
In value terms, Canada ($5.7M) constituted the largest supplier of lime to the United States, comprising 74% of total imports. The second position in the ranking was held by Mexico ($1.5M), with a 19% share of total imports.
From August 2022 to August 2023, the average monthly rate of growth in terms of value from Canada was relatively modest. The remaining supplying countries recorded the following average monthly rates of imports growth: Mexico (+0.8% per month) and the Dominican Republic (+8.5% per month).
This report provides an in-depth analysis of the lime market in the U.S.. Within it, you will discover the latest data on market trends and opportunities by country, consumption, production and price developments, as well as the global trade (imports and exports). The forecast exhibits the market prospects through 2030.
Product coverage:
- NAICS 327410 - Lime manufacturing
Companies mentioned:
- Lhoist North America
- Mississippi Lime Company
- Naked Lime
- Rockydale Quarries Corporation
- Graymont Dolime (oh) Inc.
- Huron Lime
- Graymont (pa) Inc.
- Lhoist North America of Virginia
- Cheney Lime & Cement Company
- Graymont (wi)
- Austin White Lime Company
- Peak Lime
- Cutler-Magner Company
- Western Lime Corporation
- Lhoist North America of Arizona
- Lafarge Corp
- Millersville Lime Inc
- Mercer Lime Company
- Lhoist North America of Alabama
- Greenacres Gypsum & Lime Inc.
- Texas Lime Company
- Midwest Minerals
- Kdm Holding, Mk Minerals
- Edwards Lime Gathering
- Florida Lime Corp
- O-N Minerals (luttrell) Company
- Southern Lime Corporation
- Star Group, Lime Holding
- Lhoist North America of Missouri
- Chemical Lime-Southwest
Country coverage:
- United States
Data coverage:
- Market volume and value
- Per Capita consumption
- Forecast of the market dynamics in the medium term
- Trade (exports and imports) in the U.S.
- Export and import prices
- Market trends, drivers and restraints
- Key market players and their profiles
Reasons to buy this report:
- Take advantage of the latest data
- Find deeper insights into current market developments
- Discover vital success factors affecting the market
This report is designed for manufacturers, distributors, importers, and wholesalers, as well as for investors, consultants and advisors.
In this report, you can find information that helps you to make informed decisions on the following issues:
- How to diversify your business and benefit from new market opportunities
- How to load your idle production capacity
- How to boost your sales on overseas markets
- How to increase your profit margins
- How to make your supply chain more sustainable
- How to reduce your production and supply chain costs
- How to outsource production to other countries
- How to prepare your business for global expansion
While doing this research, we combine the accumulated expertise of our analysts and the capabilities of artificial intelligence. The AI-based platform, developed by our data scientists, constitutes the key working tool for business analysts, empowering them to discover deep insights and ideas from the marketing data.
-
1. INTRODUCTION
Making Data-Driven Decisions to Grow Your Business
- REPORT DESCRIPTION
- RESEARCH METHODOLOGY AND AI PLATFORM
- DATA-DRIVEN DECISIONS FOR YOUR BUSINESS
- GLOSSARY AND SPECIFIC TERMS
-
2. EXECUTIVE SUMMARY
A Quick Overview of Market Performance
- KEY FINDINGS
- MARKET TRENDS This Chapter is Available Only for the Professional Edition PRO
-
3. MARKET OVERVIEW
Understanding the Current State of The Market and Its Prospects
- MARKET SIZE
- MARKET STRUCTURE
- TRADE BALANCE
- PER CAPITA CONSUMPTION
- MARKET FORECAST TO 2030
-
4. MOST PROMISING PRODUCT
Finding New Products to Diversify Your Business
This Chapter is Available Only for the Professional Edition PRO- TOP PRODUCTS TO DIVERSIFY YOUR BUSINESS
- BEST-SELLING PRODUCTS
- MOST CONSUMED PRODUCT
- MOST TRADED PRODUCT
- MOST PROFITABLE PRODUCT FOR EXPORT
-
5. MOST PROMISING SUPPLYING COUNTRIES
Choosing the Best Countries to Establish Your Sustainable Supply Chain
This Chapter is Available Only for the Professional Edition PRO- TOP COUNTRIES TO SOURCE YOUR PRODUCT
- TOP PRODUCING COUNTRIES
- TOP EXPORTING COUNTRIES
- LOW-COST EXPORTING COUNTRIES
-
6. MOST PROMISING OVERSEAS MARKETS
Choosing the Best Countries to Boost Your Exports
This Chapter is Available Only for the Professional Edition PRO- TOP OVERSEAS MARKETS FOR EXPORTING YOUR PRODUCT
- TOP CONSUMING MARKETS
- UNSATURATED MARKETS
- TOP IMPORTING MARKETS
- MOST PROFITABLE MARKETS
7. PRODUCTION
The Latest Trends and Insights into The Industry
- PRODUCTION VOLUME AND VALUE
8. IMPORTS
The Largest Import Supplying Countries
- IMPORTS FROM 2012–2023
- IMPORTS BY COUNTRY
- IMPORT PRICES BY COUNTRY
9. EXPORTS
The Largest Destinations for Exports
- EXPORTS FROM 2012–2023
- EXPORTS BY COUNTRY
- EXPORT PRICES BY COUNTRY
-
10. PROFILES OF MAJOR PRODUCERS
The Largest Producers on The Market and Their Profiles
This Chapter is Available Only for the Professional Edition PRO -
LIST OF TABLES
- Key Findings In 2023
- Market Volume, In Physical Terms, 2012–2023
- Market Value, 2012–2023
- Per Capita Consumption In 2012-2023
- Imports, In Physical Terms, By Country, 2012–2023
- Imports, In Value Terms, By Country, 2012–2023
- Import Prices, By Country Of Origin, 2012–2023
- Exports, In Physical Terms, By Country, 2012–2023
- Exports, In Value Terms, By Country, 2012–2023
- Export Prices, By Country Of Destination, 2012–2023
-
LIST OF FIGURES
- Market Volume, In Physical Terms, 2012–2023
- Market Value, 2012–2023
- Market Structure – Domestic Supply vs. Imports, In Physical Terms, 2012-2023
- Market Structure – Domestic Supply vs. Imports, In Value Terms, 2012-2023
- Trade Balance, In Physical Terms, 2012-2023
- Trade Balance, In Value Terms, 2012-2023
- Per Capita Consumption, 2012-2023
- Market Volume Forecast to 2030
- Market Value Forecast to 2030
- Products: Market Size And Growth, By Type
- Products: Average Per Capita Consumption, By Type
- Products: Exports And Growth, By Type
- Products: Export Prices And Growth, By Type
- Production Volume And Growth
- Exports And Growth
- Export Prices And Growth
- Market Size And Growth
- Per Capita Consumption
- Imports And Growth
- Import Prices
- Production, In Physical Terms, 2012–2023
- Production, In Value Terms, 2012–2023
- Imports, In Physical Terms, 2012–2023
- Imports, In Value Terms, 2012–2023
- Imports, In Physical Terms, By Country, 2023
- Imports, In Physical Terms, By Country, 2012–2023
- Imports, In Value Terms, By Country, 2012–2023
- Import Prices, By Country Of Origin, 2012–2023
- Exports, In Physical Terms, 2012–2023
- Exports, In Value Terms, 2012–2023
- Exports, In Physical Terms, By Country, 2023
- Exports, In Physical Terms, By Country, 2012–2023
- Exports, In Value Terms, By Country, 2012–2023
- Export Prices, By Country Of Destination, 2012–2023


