
U.S. Boat Market. Analysis And Forecast to 2030
Get instant access to more than 2 million reports, dashboards, and datasets on the IndexBox Platform.
View PricingImports of Watercraft Increase by 14% to $2.9 Billion in the United States for the Year 2023
U.S. Boat Imports
In 2023, supplies from abroad of boats decreased by -9.2% to 340K units, falling for the second consecutive year after two years of growth. Over the period under review, imports, however, enjoyed a noticeable increase. The most prominent rate of growth was recorded in 2020 when imports increased by 36% against the previous year. Imports peaked at 633K units in 2021; however, from 2022 to 2023, imports remained at a lower figure.
In value terms, boat imports rose remarkably to $2.9B (IndexBox estimates) in 2023. In general, imports, however, posted a prominent increase. The growth pace was the most rapid in 2015 when imports increased by 66%. Over the period under review, imports attained the peak figure in 2023 and are expected to retain growth in the immediate term.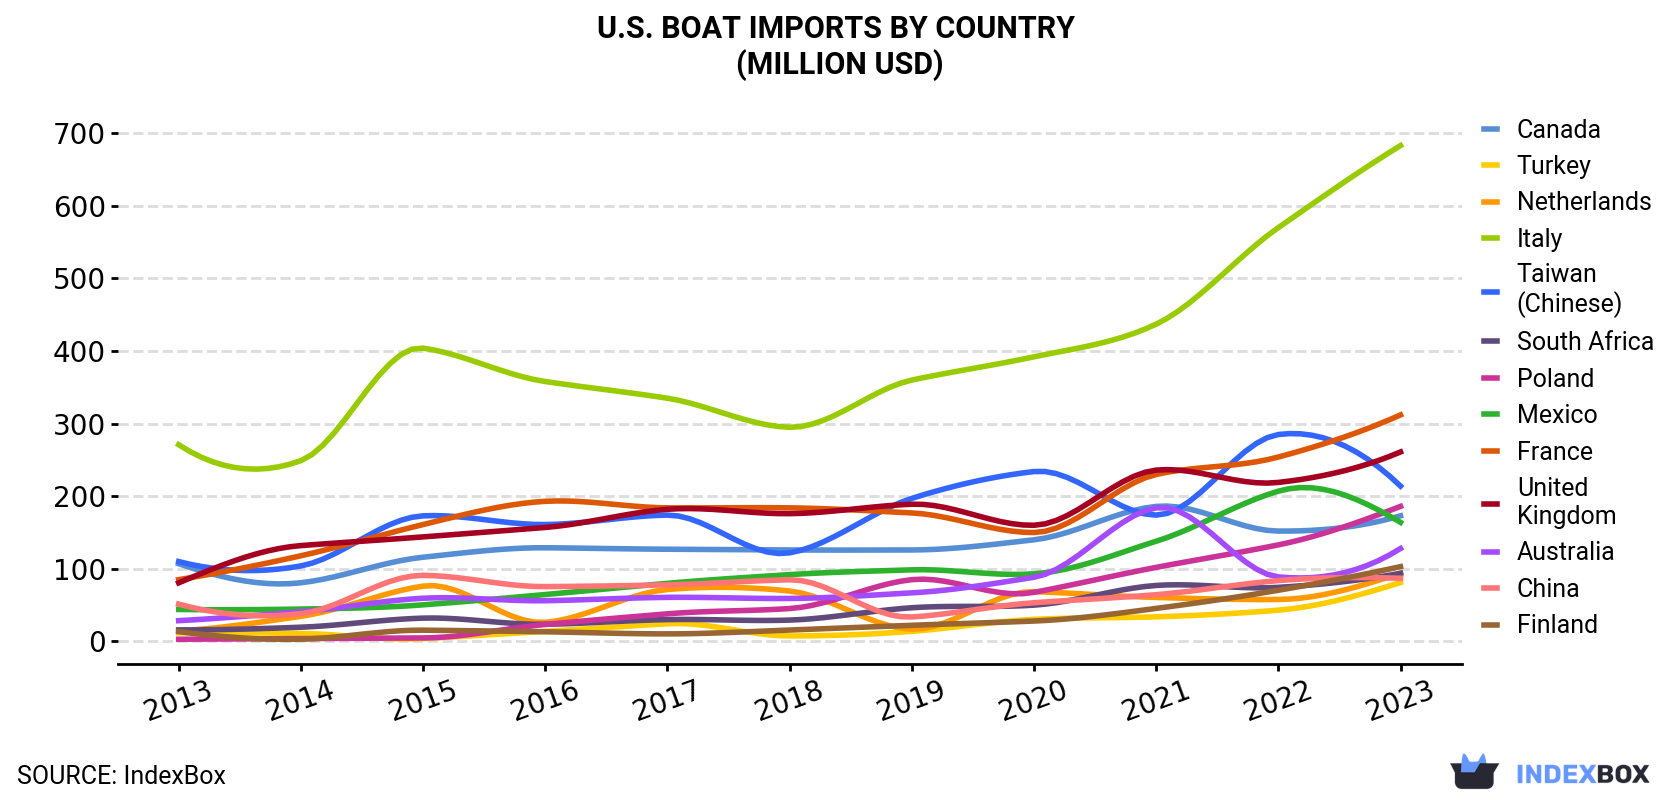
| COUNTRY | Import Value of Boat in U.S. (million USD) | ||||||||||
|---|---|---|---|---|---|---|---|---|---|---|---|
| 2013 | 2014 | 2015 | 2016 | 2017 | 2018 | 2019 | 2020 | 2021 | 2022 | 2023 | |
| Italy | 271 | 249 | 404 | 358 | 335 | 295 | 360 | 392 | 437 | 570 | 683 |
| France | 85.1 | 118 | 161 | 193 | 184 | 184 | 177 | 150 | 230 | 254 | 312 |
| United Kingdom | 80.7 | 132 | 144 | 157 | 182 | 176 | 189 | 160 | 236 | 219 | 261 |
| Taiwan (Chinese) | 110 | 104 | 173 | 161 | 174 | 122 | 197 | 234 | 174 | 285 | 214 |
| Poland | 3.0 | 3.9 | 4.8 | 23.4 | 38.0 | 45.3 | 85.1 | 67.6 | 102 | 133 | 186 |
| Canada | 107 | 80.8 | 116 | 129 | 127 | 126 | 126 | 140 | 186 | 152 | 173 |
| Mexico | 44.0 | 44.6 | 50.4 | 64.6 | 80.0 | 92.0 | 98.6 | 93.1 | 138 | 207 | 164 |
| Australia | 28.6 | 40.9 | 59.5 | 56.1 | 60.7 | 59.2 | 66.9 | 88.4 | 184 | 88.9 | 128 |
| Finland | 13.5 | 3.1 | 15.5 | 13.3 | 10.4 | 15.7 | 22.2 | 28.1 | 45.5 | 70.5 | 103 |
| Netherlands | 14.6 | 34.6 | 76.2 | 26.3 | 71.5 | 69.4 | 16.9 | 68.5 | 60.6 | 57.8 | 94.0 |
| South Africa | 15.9 | 19.6 | 32.1 | 23.6 | 30.1 | 29.4 | 46.4 | 50.0 | 77.1 | 74.5 | 93.8 |
| China | 51.4 | 38.2 | 91.0 | 75.5 | 77.9 | 84.9 | 33.7 | 53.3 | 64.4 | 83.8 | 87.0 |
| Turkey | 11.8 | 11.0 | 3.9 | 13.9 | 24.4 | 7.6 | 13.9 | 30.4 | 33.9 | 43.1 | 81.1 |
| Others | 86.7 | 75.4 | 255 | 129 | 149 | 174 | 131 | 145 | 189 | 261 | 284 |
| Total | 922 | 956 | 1,586 | 1,423 | 1,543 | 1,481 | 1,564 | 1,700 | 2,158 | 2,501 | 2,863 |
Imports by Country
In 2023, Canada (246K units) constituted the largest supplier of boat to the United States, with a 72% share of total imports. Moreover, boat imports from Canada exceeded the figures recorded by the second-largest supplier, China (41K units), sixfold. The third position in this ranking was held by Mexico (27K units), with an 8.1% share.
From 2013 to 2023, the average annual rate of growth in terms of volume from Canada amounted to +2.8%. The remaining supplying countries recorded the following average annual rates of imports growth: China (+6.0% per year) and Mexico (+21.6% per year).
In value terms, Italy ($683M) constituted the largest supplier of boats to the United States, comprising 24% of total imports. The second position in the ranking was taken by France ($312M), with an 11% share of total imports. It was followed by the UK, with a 9.1% share.
From 2013 to 2023, the average annual growth rate of value from Italy amounted to +9.7%. The remaining supplying countries recorded the following average annual rates of imports growth: France (+13.9% per year) and the UK (+12.4% per year).
Import Prices by Country
In 2023, the boat price amounted to $8,418 per unit (CIF, US), jumping by 26% against the previous year. Overall, the import price posted buoyant growth. The growth pace was the most rapid in 2022 an increase of 96% against the previous year. Over the period under review, average import prices hit record highs in 2023 and is likely to see gradual growth in the near future.
Prices varied noticeably by country of origin: amid the top importers, the country with the highest price was Mexico ($5,967 per unit), while the price for Thailand ($655 per unit) was amongst the lowest.
From 2013 to 2023, the most notable rate of growth in terms of prices was attained by Thailand (+10.3%), while the prices for the other major suppliers experienced mixed trend patterns.
This report provides an in-depth analysis of the boat market in the U.S.. Within it, you will discover the latest data on market trends and opportunities by country, consumption, production and price developments, as well as the global trade (imports and exports). The forecast exhibits the market prospects through 2030.
Product coverage:
- NAICS 336612 - Boat building
Companies mentioned:
- Mercury Marine Group
- Rec Boat Holdings
- Tracker Marine
- Marine Products Corporation
- Sea Ray Boats
- Regal Marine Industries
- Cobalt Boats
- Boston Whaler
- Premier Marine
- Lowe Boats
- Fishing Holdings
- Dometic Corporation
- Viking Yacht Company
- Delta Marine Industries
- Chris Craft Corporation
- KCS International
- Dakota Creek Industries
- Leisure Properties
- Christensen Shipyards
- Palmer Johnson Yachts
- Chaparral Boats
- Malibu Boats
- The Talaria Company
- Kawasaki Motors Manufacturing Corp.
- Smoker Craft
- Brp US Inc.
- McBc Holdings
- Beneteau
- J&D Acquisitions
Country coverage:
- United States
Data coverage:
- Market volume and value
- Per Capita consumption
- Forecast of the market dynamics in the medium term
- Trade (exports and imports) in the U.S.
- Export and import prices
- Market trends, drivers and restraints
- Key market players and their profiles
Reasons to buy this report:
- Take advantage of the latest data
- Find deeper insights into current market developments
- Discover vital success factors affecting the market
This report is designed for manufacturers, distributors, importers, and wholesalers, as well as for investors, consultants and advisors.
In this report, you can find information that helps you to make informed decisions on the following issues:
- How to diversify your business and benefit from new market opportunities
- How to load your idle production capacity
- How to boost your sales on overseas markets
- How to increase your profit margins
- How to make your supply chain more sustainable
- How to reduce your production and supply chain costs
- How to outsource production to other countries
- How to prepare your business for global expansion
While doing this research, we combine the accumulated expertise of our analysts and the capabilities of artificial intelligence. The AI-based platform, developed by our data scientists, constitutes the key working tool for business analysts, empowering them to discover deep insights and ideas from the marketing data.
-
1. INTRODUCTION
Making Data-Driven Decisions to Grow Your Business
- REPORT DESCRIPTION
- RESEARCH METHODOLOGY AND AI PLATFORM
- DATA-DRIVEN DECISIONS FOR YOUR BUSINESS
- GLOSSARY AND SPECIFIC TERMS
-
2. EXECUTIVE SUMMARY
A Quick Overview of Market Performance
- KEY FINDINGS
- MARKET TRENDS This Chapter is Available Only for the Professional Edition PRO
-
3. MARKET OVERVIEW
Understanding the Current State of The Market and Its Prospects
- MARKET SIZE
- MARKET STRUCTURE
- TRADE BALANCE
- PER CAPITA CONSUMPTION
- MARKET FORECAST TO 2030
-
4. MOST PROMISING PRODUCT
Finding New Products to Diversify Your Business
This Chapter is Available Only for the Professional Edition PRO- TOP PRODUCTS TO DIVERSIFY YOUR BUSINESS
- BEST-SELLING PRODUCTS
- MOST CONSUMED PRODUCT
- MOST TRADED PRODUCT
- MOST PROFITABLE PRODUCT FOR EXPORT
-
5. MOST PROMISING SUPPLYING COUNTRIES
Choosing the Best Countries to Establish Your Sustainable Supply Chain
This Chapter is Available Only for the Professional Edition PRO- TOP COUNTRIES TO SOURCE YOUR PRODUCT
- TOP PRODUCING COUNTRIES
- TOP EXPORTING COUNTRIES
- LOW-COST EXPORTING COUNTRIES
-
6. MOST PROMISING OVERSEAS MARKETS
Choosing the Best Countries to Boost Your Exports
This Chapter is Available Only for the Professional Edition PRO- TOP OVERSEAS MARKETS FOR EXPORTING YOUR PRODUCT
- TOP CONSUMING MARKETS
- UNSATURATED MARKETS
- TOP IMPORTING MARKETS
- MOST PROFITABLE MARKETS
7. PRODUCTION
The Latest Trends and Insights into The Industry
- PRODUCTION VOLUME AND VALUE
8. IMPORTS
The Largest Import Supplying Countries
- IMPORTS FROM 2012–2023
- IMPORTS BY COUNTRY
- IMPORT PRICES BY COUNTRY
9. EXPORTS
The Largest Destinations for Exports
- EXPORTS FROM 2012–2023
- EXPORTS BY COUNTRY
- EXPORT PRICES BY COUNTRY
-
10. PROFILES OF MAJOR PRODUCERS
The Largest Producers on The Market and Their Profiles
This Chapter is Available Only for the Professional Edition PRO -
LIST OF TABLES
- Key Findings In 2023
- Market Volume, In Physical Terms, 2012–2023
- Market Value, 2012–2023
- Per Capita Consumption In 2012-2023
- Imports, In Physical Terms, By Country, 2012–2023
- Imports, In Value Terms, By Country, 2012–2023
- Import Prices, By Country Of Origin, 2012–2023
- Exports, In Physical Terms, By Country, 2012–2023
- Exports, In Value Terms, By Country, 2012–2023
- Export Prices, By Country Of Destination, 2012–2023
-
LIST OF FIGURES
- Market Volume, In Physical Terms, 2012–2023
- Market Value, 2012–2023
- Market Structure – Domestic Supply vs. Imports, In Physical Terms, 2012-2023
- Market Structure – Domestic Supply vs. Imports, In Value Terms, 2012-2023
- Trade Balance, In Physical Terms, 2012-2023
- Trade Balance, In Value Terms, 2012-2023
- Per Capita Consumption, 2012-2023
- Market Volume Forecast to 2030
- Market Value Forecast to 2030
- Products: Market Size And Growth, By Type
- Products: Average Per Capita Consumption, By Type
- Products: Exports And Growth, By Type
- Products: Export Prices And Growth, By Type
- Production Volume And Growth
- Exports And Growth
- Export Prices And Growth
- Market Size And Growth
- Per Capita Consumption
- Imports And Growth
- Import Prices
- Production, In Physical Terms, 2012–2023
- Production, In Value Terms, 2012–2023
- Imports, In Physical Terms, 2012–2023
- Imports, In Value Terms, 2012–2023
- Imports, In Physical Terms, By Country, 2023
- Imports, In Physical Terms, By Country, 2012–2023
- Imports, In Value Terms, By Country, 2012–2023
- Import Prices, By Country Of Origin, 2012–2023
- Exports, In Physical Terms, 2012–2023
- Exports, In Value Terms, 2012–2023
- Exports, In Physical Terms, By Country, 2023
- Exports, In Physical Terms, By Country, 2012–2023
- Exports, In Value Terms, By Country, 2012–2023
- Export Prices, By Country Of Destination, 2012–2023


