
United Kingdom - Woven Carpets And Other Woven Textile Coverings - Market Analysis, Forecast, Size, Trends And Insights
Get instant access to more than 2 million reports, dashboards, and datasets on the IndexBox Platform.
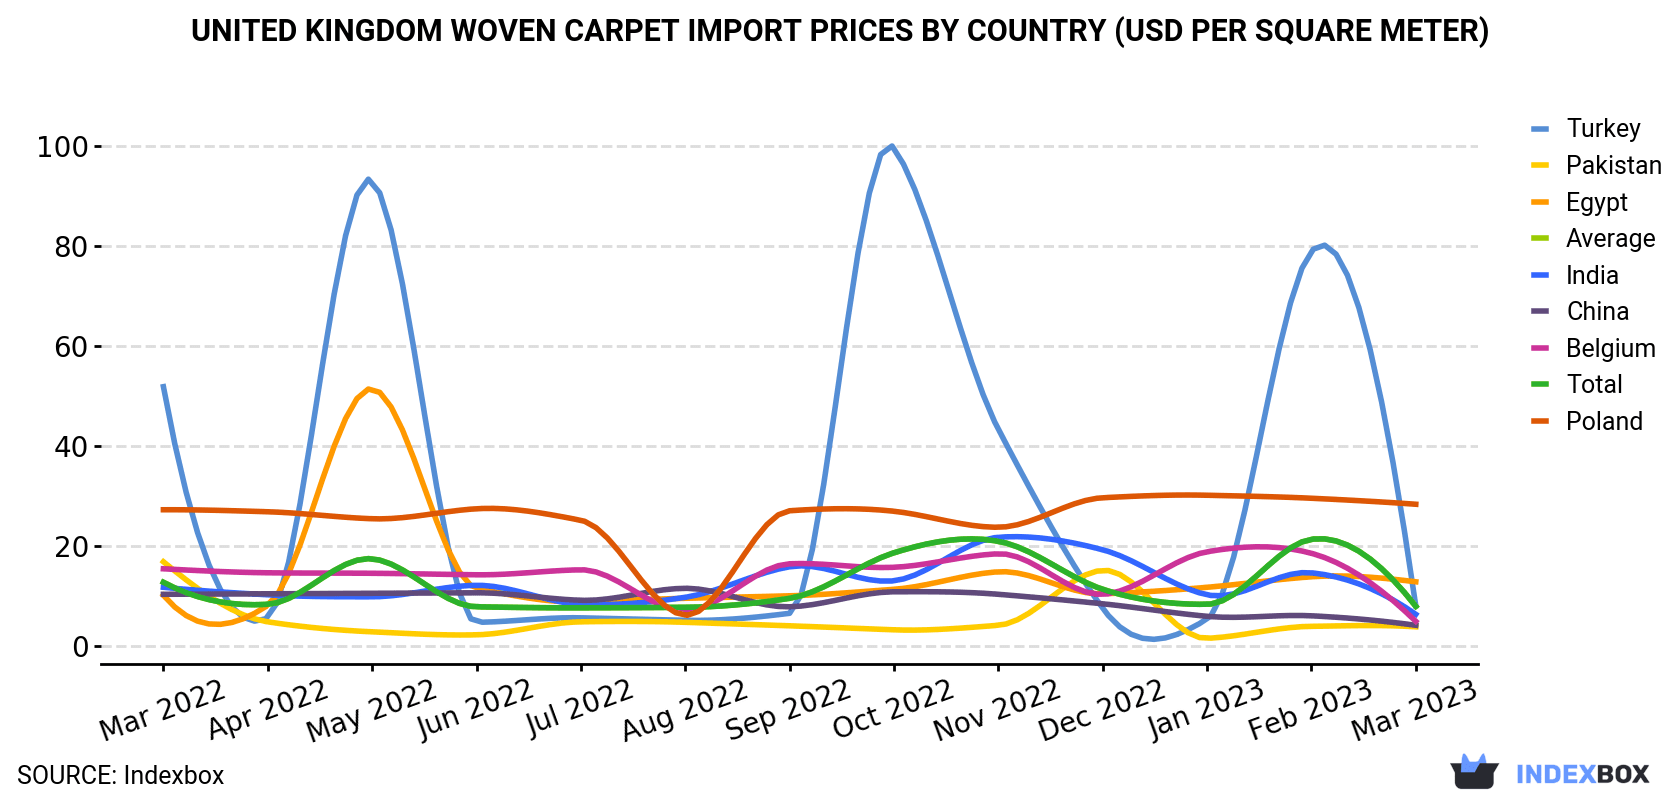
View PricingPrice of Woven Carpets in UK Plummet to $7.9 per Sqm
United Kingdom Woven Carpet Import Price in March 2023
In March 2023, the woven carpet price amounted to $7.9 per square meter (CIF, United Kingdom), declining by -62.9% against the previous month. Over the period under review, the import price showed a pronounced downturn. The pace of growth appeared the most rapid in February 2023 an increase of 156% against the previous month. As a result, import price attained the peak level of $21,297 per thousand square meters, and then declined dramatically in the following month.
There were significant differences in the average prices amongst the major supplying countries. In March 2023, the country with the highest price was Poland ($28.3 per square meter), while the price for Pakistan ($3.8 per square meter) was amongst the lowest.
From March 2022 to March 2023, the most notable rate of growth in terms of prices was attained by Egypt (+2.0%), while the prices for the other major suppliers experienced mixed trend patterns.
United Kingdom Woven Carpet Imports
In March 2023, woven carpet imports into the UK surged to 2.4M square meters, with an increase of 177% on the month before. Over the period under review, imports enjoyed a perceptible expansion. As a result, imports attained the peak and are likely to continue growth in the immediate term.
In value terms, woven carpet imports rose to $19M (IndexBox estimates) in March 2023. In general, imports, however, continue to indicate a relatively flat trend pattern. The most prominent rate of growth was recorded in September 2022 with an increase of 36% month-to-month. Over the period under review, imports reached the maximum at 21M square meters in March 2022; however, from April 2022 to March 2023, imports failed to regain momentum.
United Kingdom Woven Carpet Imports by Type
Carpets and other textile floor coverings; woven, (not tufted or flocked), of man-made textile materials, of pile construction, made up, n.e.s. in item no. 5702.10 or 5702.20 (804K square meters), carpets and other textile floor coverings; woven, (not tufted or flocked), whether or not made up, of coconut fibres (coir) (503K square meters) and carpets and other textile floor coverings; woven, (not tufted or flocked), of wool or fine animal hair, of pile construction, not made up, n.e.s. in item no. 5702.10 or 5702.20 (428K square meters) were the main products of woven carpet imports to the UK, together comprising 73% of total imports.
From March 2022 to March 2023, the most notable rate of growth in terms of purchases, amongst the major product types, was attained by carpets and other textile floor coverings; woven, (not tufted or flocked), whether or not made up, of coconut fibres (coir) (with a CAGR of +12.5%), while imports for the other products experienced more modest paces of growth.
In value terms, carpets and other textile floor coverings; woven, (not tufted or flocked), of man-made textile materials, of pile construction, made up, n.e.s. in item no. 5702.10 or 5702.20 ($6.7M), carpets and other textile floor coverings; woven, (not tufted or flocked), of wool or fine animal hair, of pile construction, not made up, n.e.s. in item no. 5702.10 or 5702.20 ($3.4M) and carpets and other textile floor coverings; woven, (not tufted or flocked), not of pile construction, not made up, n.e.c. in item no. 5702.10 or 5702.20 ($1.5M) appeared to be the most imported types of woven carpets and other woven textile coverings in the UK, with a combined 62% share of total imports.
United Kingdom Woven Carpet Imports by Country
India (695K square meters), Turkey (648K square meters) and Belgium (415K square meters) were the main suppliers of woven carpet imports to the UK, with a combined 74% share of total imports.
From March 2022 to March 2023, the biggest increases were in Turkey (with a CAGR of +14.4%), while purchases for the other leaders experienced more modest paces of growth.
In value terms, Turkey ($5.2M), India ($4.4M) and Belgium ($2M) appeared to be the largest woven carpet suppliers to the UK, together accounting for 62% of total imports. Poland, Egypt, China and Pakistan lagged somewhat behind, together comprising a further 24%.
Among the main suppliers, Poland, with a CAGR of +4.7%, recorded the highest growth rate of the value of imports, over the period under review, while purchases for the other leaders experienced more modest paces of growth.
This report provides an in-depth analysis of the woven carpet market in the UK. Within it, you will discover the latest data on market trends and opportunities by country, consumption, production and price developments, as well as the global trade (imports and exports). The forecast exhibits the market prospects through 2030.
Product coverage:
- Prodcom 13931200 - Woven carpets and other woven textile coverings (excluding tufted or flocked)
Country coverage:
- United Kingdom
Data coverage:
- Market volume and value
- Per Capita consumption
- Forecast of the market dynamics in the medium term
- Trade (exports and imports) in the UK
- Export and import prices
- Market trends, drivers and restraints
- Key market players and their profiles
Reasons to buy this report:
- Take advantage of the latest data
- Find deeper insights into current market developments
- Discover vital success factors affecting the market
This report is designed for manufacturers, distributors, importers, and wholesalers, as well as for investors, consultants and advisors.
In this report, you can find information that helps you to make informed decisions on the following issues:
- How to diversify your business and benefit from new market opportunities
- How to load your idle production capacity
- How to boost your sales on overseas markets
- How to increase your profit margins
- How to make your supply chain more sustainable
- How to reduce your production and supply chain costs
- How to outsource production to other countries
- How to prepare your business for global expansion
While doing this research, we combine the accumulated expertise of our analysts and the capabilities of artificial intelligence. The AI-based platform, developed by our data scientists, constitutes the key working tool for business analysts, empowering them to discover deep insights and ideas from the marketing data.
-
1. INTRODUCTION
Making Data-Driven Decisions to Grow Your Business
- REPORT DESCRIPTION
- RESEARCH METHODOLOGY AND AI PLATFORM
- DATA-DRIVEN DECISIONS FOR YOUR BUSINESS
- GLOSSARY AND SPECIFIC TERMS
-
2. EXECUTIVE SUMMARY
A Quick Overview of Market Performance
- KEY FINDINGS
- MARKET TRENDS This Chapter is Available Only for the Professional Edition PRO
-
3. MARKET OVERVIEW
Understanding the Current State of The Market and Its Prospects
- MARKET SIZE
- MARKET STRUCTURE
- TRADE BALANCE
- PER CAPITA CONSUMPTION
- MARKET FORECAST TO 2030
-
4. MOST PROMISING PRODUCT
Finding New Products to Diversify Your Business
This Chapter is Available Only for the Professional Edition PRO- TOP PRODUCTS TO DIVERSIFY YOUR BUSINESS
- BEST-SELLING PRODUCTS
- MOST CONSUMED PRODUCT
- MOST TRADED PRODUCT
- MOST PROFITABLE PRODUCT FOR EXPORT
-
5. MOST PROMISING SUPPLYING COUNTRIES
Choosing the Best Countries to Establish Your Sustainable Supply Chain
This Chapter is Available Only for the Professional Edition PRO- TOP COUNTRIES TO SOURCE YOUR PRODUCT
- TOP PRODUCING COUNTRIES
- TOP EXPORTING COUNTRIES
- LOW-COST EXPORTING COUNTRIES
-
6. MOST PROMISING OVERSEAS MARKETS
Choosing the Best Countries to Boost Your Exports
This Chapter is Available Only for the Professional Edition PRO- TOP OVERSEAS MARKETS FOR EXPORTING YOUR PRODUCT
- TOP CONSUMING MARKETS
- UNSATURATED MARKETS
- TOP IMPORTING MARKETS
- MOST PROFITABLE MARKETS
7. PRODUCTION
The Latest Trends and Insights into The Industry
- PRODUCTION VOLUME AND VALUE
8. IMPORTS
The Largest Import Supplying Countries
- IMPORTS FROM 2012–2023
- IMPORTS BY COUNTRY
- IMPORT PRICES BY COUNTRY
9. EXPORTS
The Largest Destinations for Exports
- EXPORTS FROM 2012–2023
- EXPORTS BY COUNTRY
- EXPORT PRICES BY COUNTRY
-
10. PROFILES OF MAJOR PRODUCERS
The Largest Producers on The Market and Their Profiles
This Chapter is Available Only for the Professional Edition PRO -
LIST OF TABLES
- Key Findings In 2023
- Market Volume, In Physical Terms, 2012–2023
- Market Value, 2012–2023
- Per Capita Consumption In 2012-2023
- Imports, In Physical Terms, By Country, 2012–2023
- Imports, In Value Terms, By Country, 2012–2023
- Import Prices, By Country Of Origin, 2012–2023
- Exports, In Physical Terms, By Country, 2012–2023
- Exports, In Value Terms, By Country, 2012–2023
- Export Prices, By Country Of Destination, 2012–2023
-
LIST OF FIGURES
- Market Volume, In Physical Terms, 2012–2023
- Market Value, 2012–2023
- Market Structure – Domestic Supply vs. Imports, In Physical Terms, 2012-2023
- Market Structure – Domestic Supply vs. Imports, In Value Terms, 2012-2023
- Trade Balance, In Physical Terms, 2012-2023
- Trade Balance, In Value Terms, 2012-2023
- Per Capita Consumption, 2012-2023
- Market Volume Forecast to 2030
- Market Value Forecast to 2030
- Products: Market Size And Growth, By Type
- Products: Average Per Capita Consumption, By Type
- Products: Exports And Growth, By Type
- Products: Export Prices And Growth, By Type
- Production Volume And Growth
- Exports And Growth
- Export Prices And Growth
- Market Size And Growth
- Per Capita Consumption
- Imports And Growth
- Import Prices
- Production, In Physical Terms, 2012–2023
- Production, In Value Terms, 2012–2023
- Imports, In Physical Terms, 2012–2023
- Imports, In Value Terms, 2012–2023
- Imports, In Physical Terms, By Country, 2023
- Imports, In Physical Terms, By Country, 2012–2023
- Imports, In Value Terms, By Country, 2012–2023
- Import Prices, By Country Of Origin, 2012–2023
- Exports, In Physical Terms, 2012–2023
- Exports, In Value Terms, 2012–2023
- Exports, In Physical Terms, By Country, 2023
- Exports, In Physical Terms, By Country, 2012–2023
- Exports, In Value Terms, By Country, 2012–2023
- Export Prices, By Country Of Destination, 2012–2023


