United Kingdom - Canned Meat - Market Analysis, Forecast, Size, Trends And Insights
Get instant access to more than 2 million reports, dashboards, and datasets on the IndexBox Platform.
View PricingImport of Canned Meat From UK Decreases by 3% to $272M in November 2023
United Kingdom Canned Meat Imports
In November 2023, imports of canned meat into the UK shrank to 53K tons, declining by -5.5% on the previous month. In general, imports, however, continue to indicate a relatively flat trend pattern. The growth pace was the most rapid in March 2023 when imports increased by 34% month-to-month. As a result, imports attained the peak of 60K tons. From April 2023 to November 2023, the growth of imports failed to regain momentum.
In value terms, canned meat imports fell to $272M (IndexBox estimates) in November 2023. Over the period under review, imports, however, recorded a relatively flat trend pattern. The growth pace was the most rapid in March 2023 when imports increased by 35% month-to-month. As a result, imports attained the peak of $309M. From April 2023 to November 2023, the growth of imports remained at a somewhat lower figure.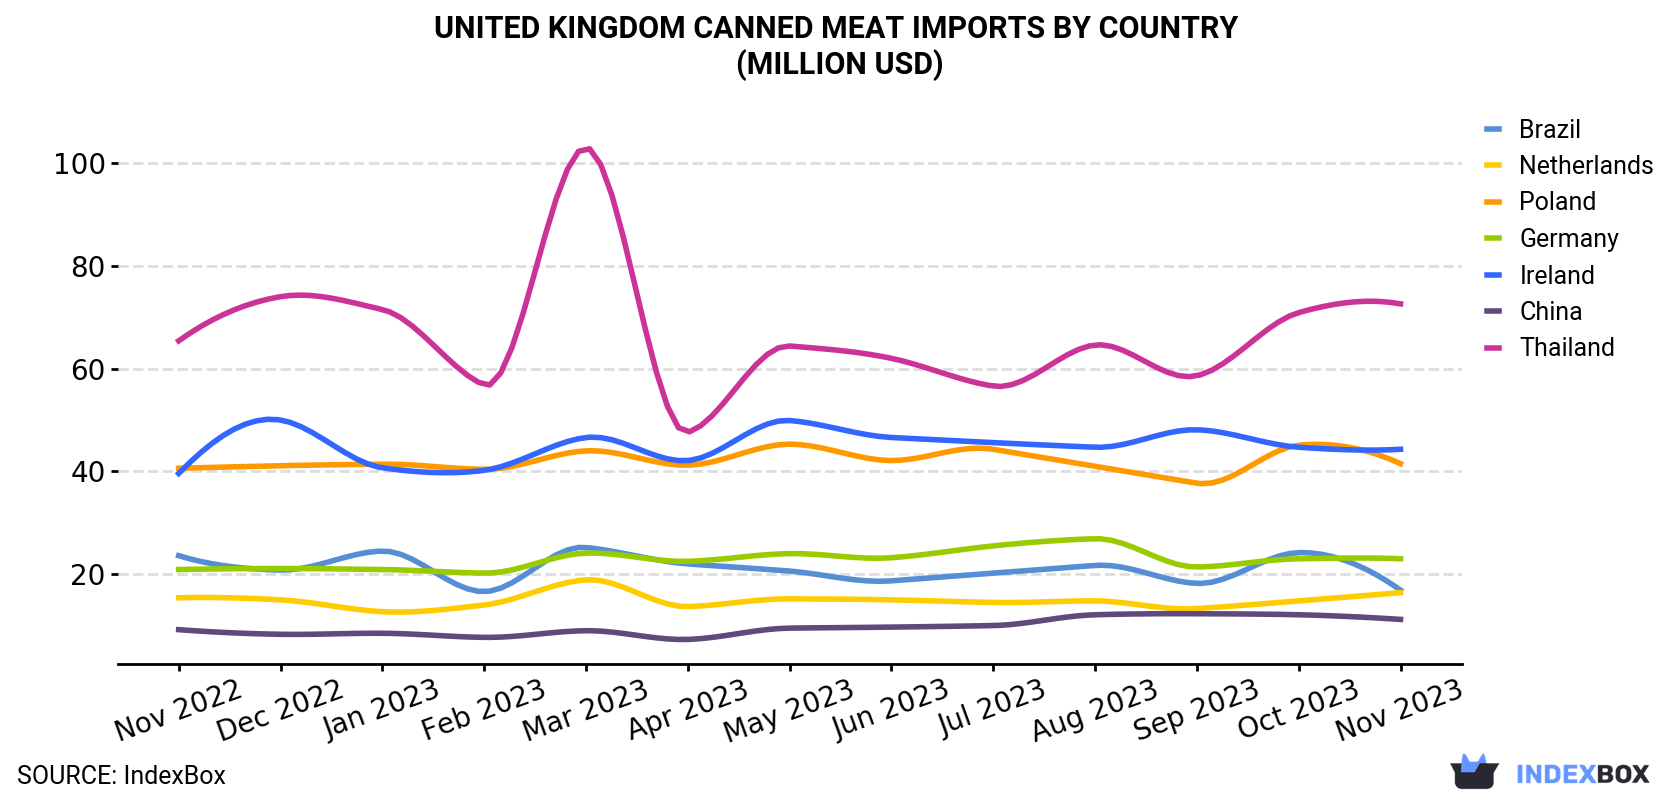
| COUNTRY | Import Value of Canned Meat in United Kingdom (million USD) | ||||||||||||
|---|---|---|---|---|---|---|---|---|---|---|---|---|---|
| Nov 2022 | Dec 2022 | Jan 2023 | Feb 2023 | Mar 2023 | Apr 2023 | May 2023 | Jun 2023 | Jul 2023 | Aug 2023 | Sep 2023 | Oct 2023 | Nov 2023 | |
| Thailand | 65.4 | 74.0 | 71.5 | 56.8 | 103 | 47.6 | 64.4 | 62.0 | 56.6 | 64.6 | 58.6 | 70.9 | 72.6 |
| Ireland | 39.6 | 50.0 | 40.7 | 40.2 | 46.6 | 42.1 | 49.9 | 46.6 | 45.6 | 44.7 | 48.1 | 44.7 | 44.3 |
| Poland | 40.6 | 41.1 | 41.4 | 40.4 | 44.0 | 41.2 | 45.3 | 42.1 | 44.3 | 41.0 | 37.7 | 45.1 | 41.5 |
| Germany | 20.9 | 21.1 | 20.9 | 20.2 | 24.1 | 22.5 | 24.0 | 23.2 | 25.5 | 26.9 | 21.4 | 23.0 | 23.0 |
| Brazil | 23.6 | 20.8 | 24.5 | 16.6 | 25.2 | 22.0 | 20.6 | 18.7 | 20.2 | 21.7 | 18.2 | 24.2 | 16.9 |
| Netherlands | 15.4 | 15.0 | 12.7 | 14.0 | 18.9 | 13.7 | 15.2 | 15.0 | 14.5 | 14.8 | 13.3 | 14.8 | 16.4 |
| China | 9.2 | 8.3 | 8.5 | 7.7 | 9.0 | 7.3 | 9.5 | 9.7 | 10.0 | 12.1 | 12.3 | 12.1 | 11.2 |
| Others | 47.8 | 45.4 | 34.9 | 32.9 | 38.2 | 37.4 | 45.7 | 39.1 | 40.4 | 40.3 | 41.1 | 45.2 | 46.2 |
| Total | 263 | 276 | 255 | 229 | 309 | 234 | 275 | 256 | 257 | 266 | 251 | 280 | 272 |
Imports by Country
Thailand (16K tons), Poland (8.8K tons) and Ireland (5.6K tons) were the main suppliers of canned meat imports to the UK, together accounting for 57% of total imports. These countries were followed by Germany, Brazil, the Netherlands and China, which together accounted for a further 28%.
From November 2022 to November 2023, the most notable rate of growth in terms of purchases, amongst the main suppliers, was attained by China (with a CAGR of +3.1%), while imports for the other leaders experienced more modest paces of growth.
In value terms, the largest canned meat suppliers to the UK were Thailand ($73M), Ireland ($44M) and Poland ($41M), with a combined 58% share of total imports. Germany, Brazil, the Netherlands and China lagged somewhat behind, together comprising a further 25%.
Among the main suppliers, China, with a CAGR of +1.7%, recorded the highest growth rate of the value of imports, over the period under review, while purchases for the other leaders experienced more modest paces of growth.
Import Prices by Country
In November 2023, the canned meat price amounted to $5,115 per ton (CIF, United Kingdom), with an increase of 2.8% against the previous month. In general, the import price, however, recorded a relatively flat trend pattern. The pace of growth was the most pronounced in April 2023 when the average import price increased by 2.8% month-to-month. Over the period under review, average import prices attained the peak figure at $5,351 per ton in July 2023; however, from August 2023 to November 2023, import prices remained at a lower figure.
Prices varied noticeably by the country of origin: the country with the highest price was Ireland ($7,962 per ton), while the price for Brazil ($3,997 per ton) was amongst the lowest.
From November 2022 to November 2023, the most notable rate of growth in terms of prices was attained by Poland (+0.7%), while the prices for the other major suppliers experienced more modest paces of growth.
This report provides an in-depth analysis of the canned meat market in the UK. Within it, you will discover the latest data on market trends and opportunities by country, consumption, production and price developments, as well as the global trade (imports and exports). The forecast exhibits the market prospects through 2030.
Product coverage:
- Prodcom 10861010 - Homogenised preparations of meat, meat offal or blood (excluding sausages and similar products of meat, food preparations based on these products)
- Prodcom 10131505 - Prepared or preserved goose or duck liver (excluding sausages and prepared meals and dishes)
- Prodcom 10131515 - Prepared or preserved liver of other animals (excluding sausages and prepared meals and dishes)
- Prodcom 10131525 - Prepared or preserved meat or offal of turkeys (excluding sausages, preparations of liver and prepared meals and dishes)
- Prodcom 10131535 - Other prepared or preserved poultry meat (excluding sausages, preparations of liver and prepared meals and dishes)
- Prodcom 10131545 - Prepared or preserved meat of swine: hams and cuts thereof (excluding prepared meals and dishes)
- Prodcom 10131555 - Prepared or preserved meat of swine: shoulders and cuts thereof, of swine (excluding prepared meals and dishes)
- Prodcom 10131565 - Prepared or preserved meat, offal and mixtures of domestic swine, including mixtures, containing < .40 % meat or offal of any kind and fats of any kind (excluding sausages and similar products, homogenised preparations, preparations of liver and prepared meals and dishes)
- Prodcom 10131575 - Other prepared or preserved meat, offal and mixtures of
- Prodcom 10131585 - Prepared or preserved meat or offal of bovine animals (excluding sausages and similar products, homogenised preparations, preparations of liver and prepared meals and dishes)
- Prodcom 10131595 - Other prepared or preserved meat or offal, including blood
Country coverage:
- United Kingdom
Data coverage:
- Market volume and value
- Per Capita consumption
- Forecast of the market dynamics in the medium term
- Trade (exports and imports) in the UK
- Export and import prices
- Market trends, drivers and restraints
- Key market players and their profiles
Reasons to buy this report:
- Take advantage of the latest data
- Find deeper insights into current market developments
- Discover vital success factors affecting the market
This report is designed for manufacturers, distributors, importers, and wholesalers, as well as for investors, consultants and advisors.
In this report, you can find information that helps you to make informed decisions on the following issues:
- How to diversify your business and benefit from new market opportunities
- How to load your idle production capacity
- How to boost your sales on overseas markets
- How to increase your profit margins
- How to make your supply chain more sustainable
- How to reduce your production and supply chain costs
- How to outsource production to other countries
- How to prepare your business for global expansion
While doing this research, we combine the accumulated expertise of our analysts and the capabilities of artificial intelligence. The AI-based platform, developed by our data scientists, constitutes the key working tool for business analysts, empowering them to discover deep insights and ideas from the marketing data.
-
1. INTRODUCTION
Making Data-Driven Decisions to Grow Your Business
- REPORT DESCRIPTION
- RESEARCH METHODOLOGY AND AI PLATFORM
- DATA-DRIVEN DECISIONS FOR YOUR BUSINESS
- GLOSSARY AND SPECIFIC TERMS
-
2. EXECUTIVE SUMMARY
A Quick Overview of Market Performance
- KEY FINDINGS
- MARKET TRENDS This Chapter is Available Only for the Professional Edition PRO
-
3. MARKET OVERVIEW
Understanding the Current State of The Market and Its Prospects
- MARKET SIZE
- MARKET STRUCTURE
- TRADE BALANCE
- PER CAPITA CONSUMPTION
- MARKET FORECAST TO 2030
-
4. MOST PROMISING PRODUCT
Finding New Products to Diversify Your Business
This Chapter is Available Only for the Professional Edition PRO- TOP PRODUCTS TO DIVERSIFY YOUR BUSINESS
- BEST-SELLING PRODUCTS
- MOST CONSUMED PRODUCT
- MOST TRADED PRODUCT
- MOST PROFITABLE PRODUCT FOR EXPORT
-
5. MOST PROMISING SUPPLYING COUNTRIES
Choosing the Best Countries to Establish Your Sustainable Supply Chain
This Chapter is Available Only for the Professional Edition PRO- TOP COUNTRIES TO SOURCE YOUR PRODUCT
- TOP PRODUCING COUNTRIES
- TOP EXPORTING COUNTRIES
- LOW-COST EXPORTING COUNTRIES
-
6. MOST PROMISING OVERSEAS MARKETS
Choosing the Best Countries to Boost Your Exports
This Chapter is Available Only for the Professional Edition PRO- TOP OVERSEAS MARKETS FOR EXPORTING YOUR PRODUCT
- TOP CONSUMING MARKETS
- UNSATURATED MARKETS
- TOP IMPORTING MARKETS
- MOST PROFITABLE MARKETS
7. PRODUCTION
The Latest Trends and Insights into The Industry
- PRODUCTION VOLUME AND VALUE
8. IMPORTS
The Largest Import Supplying Countries
- IMPORTS FROM 2012–2023
- IMPORTS BY COUNTRY
- IMPORT PRICES BY COUNTRY
9. EXPORTS
The Largest Destinations for Exports
- EXPORTS FROM 2012–2023
- EXPORTS BY COUNTRY
- EXPORT PRICES BY COUNTRY
-
10. PROFILES OF MAJOR PRODUCERS
The Largest Producers on The Market and Their Profiles
This Chapter is Available Only for the Professional Edition PRO -
LIST OF TABLES
- Key Findings In 2023
- Market Volume, In Physical Terms, 2012–2023
- Market Value, 2012–2023
- Per Capita Consumption In 2012-2023
- Imports, In Physical Terms, By Country, 2012–2023
- Imports, In Value Terms, By Country, 2012–2023
- Import Prices, By Country Of Origin, 2012–2023
- Exports, In Physical Terms, By Country, 2012–2023
- Exports, In Value Terms, By Country, 2012–2023
- Export Prices, By Country Of Destination, 2012–2023
-
LIST OF FIGURES
- Market Volume, In Physical Terms, 2012–2023
- Market Value, 2012–2023
- Market Structure – Domestic Supply vs. Imports, In Physical Terms, 2012-2023
- Market Structure – Domestic Supply vs. Imports, In Value Terms, 2012-2023
- Trade Balance, In Physical Terms, 2012-2023
- Trade Balance, In Value Terms, 2012-2023
- Per Capita Consumption, 2012-2023
- Market Volume Forecast to 2030
- Market Value Forecast to 2030
- Products: Market Size And Growth, By Type
- Products: Average Per Capita Consumption, By Type
- Products: Exports And Growth, By Type
- Products: Export Prices And Growth, By Type
- Production Volume And Growth
- Exports And Growth
- Export Prices And Growth
- Market Size And Growth
- Per Capita Consumption
- Imports And Growth
- Import Prices
- Production, In Physical Terms, 2012–2023
- Production, In Value Terms, 2012–2023
- Imports, In Physical Terms, 2012–2023
- Imports, In Value Terms, 2012–2023
- Imports, In Physical Terms, By Country, 2023
- Imports, In Physical Terms, By Country, 2012–2023
- Imports, In Value Terms, By Country, 2012–2023
- Import Prices, By Country Of Origin, 2012–2023
- Exports, In Physical Terms, 2012–2023
- Exports, In Value Terms, 2012–2023
- Exports, In Physical Terms, By Country, 2023
- Exports, In Physical Terms, By Country, 2012–2023
- Exports, In Value Terms, By Country, 2012–2023
- Export Prices, By Country Of Destination, 2012–2023


