
Turkey - Sewing Thread Of Man-Made Filaments Or Staple Fibers - Market Analysis, Forecast, Size, Trends and Insights
Get instant access to more than 2 million reports, dashboards, and datasets on the IndexBox Platform.
View PricingTurkey's July 2023 Imports of Sewing Thread Surge by 28% to Reach $5.7M
Turkey Sewing Thread Imports
In July 2023, imports of sewing thread of man-made filaments or staple fibers into Turkey skyrocketed to 1.1K tons, surging by 40% against the previous month. Overall, total imports indicated modest growth from July 2022 to July 2023: its volume increased at an average monthly rate of +1.2% over the last twelve-month period. The trend pattern, however, indicated some noticeable fluctuations being recorded throughout the analyzed period. Based on July 2023 figures, imports increased by +79.7% against March 2023 indices.
In value terms, sewing thread imports skyrocketed to $5.7M (IndexBox estimates) in July 2023. In general, imports saw a relatively flat trend pattern.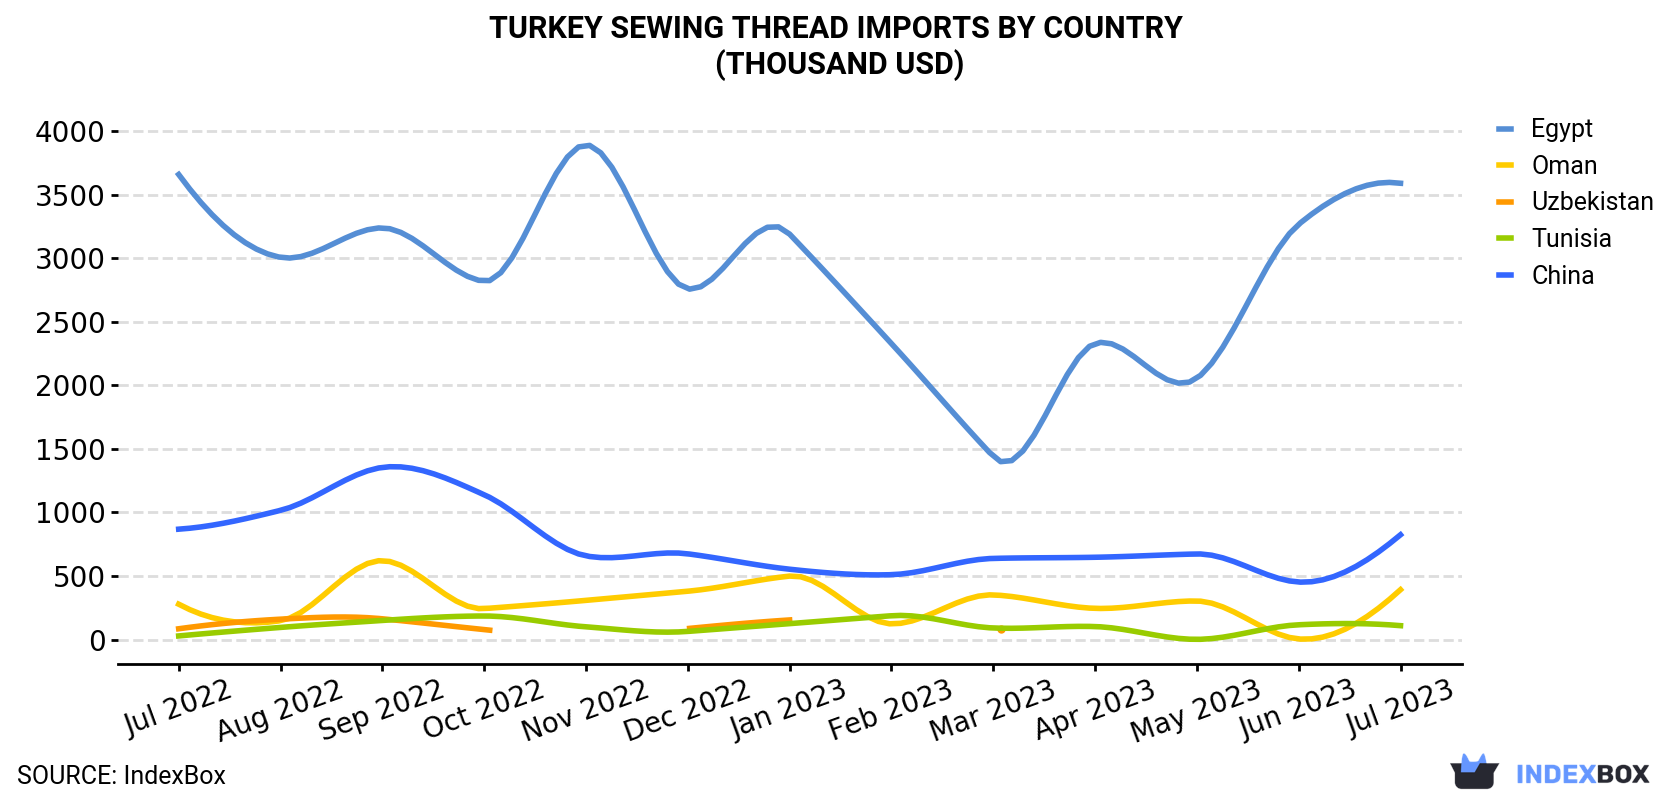
| COUNTRY | Import Value of Sewing Thread in Turkey (thousand USD) | ||||||||||||
|---|---|---|---|---|---|---|---|---|---|---|---|---|---|
| Jul 2022 | Aug 2022 | Sep 2022 | Oct 2022 | Nov 2022 | Dec 2022 | Jan 2023 | Feb 2023 | Mar 2023 | Apr 2023 | May 2023 | Jun 2023 | Jul 2023 | |
| Egypt | 3,658 | 3,006 | 3,238 | 2,818 | 3,891 | 2,758 | 3,189 | 2,328 | 1,440 | 2,329 | 2,055 | 3,266 | 3,589 |
| China | 868 | 1,016 | 1,354 | 1,139 | 658 | 674 | 553 | 510 | 638 | 647 | 673 | 452 | 824 |
| Oman | 278 | 148 | 621 | 243 | 308 | 380 | 499 | 123 | 351 | 245 | 303 | 4.3 | 392 |
| Tunisia | 28.1 | 95.2 | 150 | 185 | 99.8 | 63.8 | 125 | 187 | 90.7 | 102 | 1.2 | 116 | 109 |
| Uzbekistan | 84.5 | 160 | 163 | 78.2 | N/A | 86.2 | 154 | N/A | 79.9 | N/A | N/A | N/A | N/A |
| Others | 422 | 645 | 732 | 643 | 636 | 555 | 569 | 760 | 833 | 968 | 843 | 633 | 807 |
| Total | 5,338 | 5,070 | 6,257 | 5,105 | 5,593 | 4,517 | 5,089 | 3,908 | 3,432 | 4,291 | 3,876 | 4,472 | 5,722 |
Imports by Country
In July 2023, Egypt (770 tons) constituted the largest sewing thread supplier to Turkey, with a 69% share of total imports. Moreover, sewing thread imports from Egypt exceeded the figures recorded by the second-largest supplier, China (144 tons), fivefold. The third position in this ranking was taken by Oman (110 tons), with a 9.8% share.
From July 2022 to July 2023, the average monthly growth rate of volume from Egypt was relatively modest. The remaining supplying countries recorded the following average monthly rates of imports growth: China (+0.6% per month) and Oman (+6.7% per month).
In value terms, Egypt ($3.6M) constituted the largest supplier of sewing thread to Turkey, comprising 63% of total imports. The second position in the ranking was taken by China ($824K), with a 14% share of total imports. It was followed by Oman, with a 6.8% share.
From July 2022 to July 2023, the average monthly growth rate of value from Egypt was relatively modest. The remaining supplying countries recorded the following average monthly rates of imports growth: China (-0.4% per month) and Oman (+2.9% per month).
Imports by Type
In July 2023, sewing thread of man-made staple fibres, whether or not put up for retail sale (892 tons) constituted the largest type of sewing thread supplied to Turkey, accounting for a 80% share of total imports. Moreover, sewing thread of man-made staple fibres, whether or not put up for retail sale exceeded the figures recorded for the second-largest type, sewing thread of man-made filaments, whether or not put up for retail sale (225 tons), fourfold.
From July 2022 to July 2023, the average monthly growth rate of the volume of import of sewing thread of man-made staple fibres, whether or not put up for retail sale stood at +1.1%.
In value terms, sewing thread of man-made staple fibres, whether or not put up for retail sale ($3.9M) constituted the largest type of sewing thread supplied to Turkey, comprising 69% of total imports. The second position in the ranking was taken by sewing thread of man-made filaments, whether or not put up for retail sale ($1.8M), with a 31% share of total imports.
Import Prices by Country
In July 2023, the sewing thread price stood at $5,122 per ton (CIF, Turkey), waning by -8.4% against the previous month. In general, the import price showed a relatively flat trend pattern. The most prominent rate of growth was recorded in November 2022 when the average import price increased by 5% m-o-m. Over the period under review, average import prices hit record highs at $5,701 per ton in August 2022; however, from September 2022 to July 2023, import prices failed to regain momentum.
Prices varied noticeably by the country of origin: the country with the highest price was India ($10,208 per ton), while the price for Oman ($3,561 per ton) was amongst the lowest.
From July 2022 to July 2023, the most notable rate of growth in terms of prices was attained by India (+5.3%), while the prices for the other major suppliers experienced mixed trend patterns.
This report provides an in-depth analysis of the sewing thread market in Turkey. Within it, you will discover the latest data on market trends and opportunities by country, consumption, production and price developments, as well as the global trade (imports and exports). The forecast exhibits the market prospects through 2030.
Product coverage:
- Prodcom 13108510 - Sewing thread of man-made filaments
- Prodcom 13108550 - Sewing thread of man-made staple fibres
Country coverage:
- Turkey
Data coverage:
- Market volume and value
- Per Capita consumption
- Forecast of the market dynamics in the medium term
- Trade (exports and imports) in Turkey
- Export and import prices
- Market trends, drivers and restraints
- Key market players and their profiles
Reasons to buy this report:
- Take advantage of the latest data
- Find deeper insights into current market developments
- Discover vital success factors affecting the market
This report is designed for manufacturers, distributors, importers, and wholesalers, as well as for investors, consultants and advisors.
In this report, you can find information that helps you to make informed decisions on the following issues:
- How to diversify your business and benefit from new market opportunities
- How to load your idle production capacity
- How to boost your sales on overseas markets
- How to increase your profit margins
- How to make your supply chain more sustainable
- How to reduce your production and supply chain costs
- How to outsource production to other countries
- How to prepare your business for global expansion
While doing this research, we combine the accumulated expertise of our analysts and the capabilities of artificial intelligence. The AI-based platform, developed by our data scientists, constitutes the key working tool for business analysts, empowering them to discover deep insights and ideas from the marketing data.
-
1. INTRODUCTION
Making Data-Driven Decisions to Grow Your Business
- REPORT DESCRIPTION
- RESEARCH METHODOLOGY AND AI PLATFORM
- DATA-DRIVEN DECISIONS FOR YOUR BUSINESS
- GLOSSARY AND SPECIFIC TERMS
-
2. EXECUTIVE SUMMARY
A Quick Overview of Market Performance
- KEY FINDINGS
- MARKET TRENDS This Chapter is Available Only for the Professional Edition PRO
-
3. MARKET OVERVIEW
Understanding the Current State of The Market and Its Prospects
- MARKET SIZE
- MARKET STRUCTURE
- TRADE BALANCE
- PER CAPITA CONSUMPTION
- MARKET FORECAST TO 2030
-
4. MOST PROMISING PRODUCT
Finding New Products to Diversify Your Business
This Chapter is Available Only for the Professional Edition PRO- TOP PRODUCTS TO DIVERSIFY YOUR BUSINESS
- BEST-SELLING PRODUCTS
- MOST CONSUMED PRODUCT
- MOST TRADED PRODUCT
- MOST PROFITABLE PRODUCT FOR EXPORT
-
5. MOST PROMISING SUPPLYING COUNTRIES
Choosing the Best Countries to Establish Your Sustainable Supply Chain
This Chapter is Available Only for the Professional Edition PRO- TOP COUNTRIES TO SOURCE YOUR PRODUCT
- TOP PRODUCING COUNTRIES
- TOP EXPORTING COUNTRIES
- LOW-COST EXPORTING COUNTRIES
-
6. MOST PROMISING OVERSEAS MARKETS
Choosing the Best Countries to Boost Your Exports
This Chapter is Available Only for the Professional Edition PRO- TOP OVERSEAS MARKETS FOR EXPORTING YOUR PRODUCT
- TOP CONSUMING MARKETS
- UNSATURATED MARKETS
- TOP IMPORTING MARKETS
- MOST PROFITABLE MARKETS
7. PRODUCTION
The Latest Trends and Insights into The Industry
- PRODUCTION VOLUME AND VALUE
8. IMPORTS
The Largest Import Supplying Countries
- IMPORTS FROM 2012–2023
- IMPORTS BY COUNTRY
- IMPORT PRICES BY COUNTRY
9. EXPORTS
The Largest Destinations for Exports
- EXPORTS FROM 2012–2023
- EXPORTS BY COUNTRY
- EXPORT PRICES BY COUNTRY
-
10. PROFILES OF MAJOR PRODUCERS
The Largest Producers on The Market and Their Profiles
This Chapter is Available Only for the Professional Edition PRO -
LIST OF TABLES
- Key Findings In 2023
- Market Volume, In Physical Terms, 2012–2023
- Market Value, 2012–2023
- Per Capita Consumption In 2012-2023
- Imports, In Physical Terms, By Country, 2012–2023
- Imports, In Value Terms, By Country, 2012–2023
- Import Prices, By Country Of Origin, 2012–2023
- Exports, In Physical Terms, By Country, 2012–2023
- Exports, In Value Terms, By Country, 2012–2023
- Export Prices, By Country Of Destination, 2012–2023
-
LIST OF FIGURES
- Market Volume, In Physical Terms, 2012–2023
- Market Value, 2012–2023
- Market Structure – Domestic Supply vs. Imports, In Physical Terms, 2012-2023
- Market Structure – Domestic Supply vs. Imports, In Value Terms, 2012-2023
- Trade Balance, In Physical Terms, 2012-2023
- Trade Balance, In Value Terms, 2012-2023
- Per Capita Consumption, 2012-2023
- Market Volume Forecast to 2030
- Market Value Forecast to 2030
- Products: Market Size And Growth, By Type
- Products: Average Per Capita Consumption, By Type
- Products: Exports And Growth, By Type
- Products: Export Prices And Growth, By Type
- Production Volume And Growth
- Exports And Growth
- Export Prices And Growth
- Market Size And Growth
- Per Capita Consumption
- Imports And Growth
- Import Prices
- Production, In Physical Terms, 2012–2023
- Production, In Value Terms, 2012–2023
- Imports, In Physical Terms, 2012–2023
- Imports, In Value Terms, 2012–2023
- Imports, In Physical Terms, By Country, 2023
- Imports, In Physical Terms, By Country, 2012–2023
- Imports, In Value Terms, By Country, 2012–2023
- Import Prices, By Country Of Origin, 2012–2023
- Exports, In Physical Terms, 2012–2023
- Exports, In Value Terms, 2012–2023
- Exports, In Physical Terms, By Country, 2023
- Exports, In Physical Terms, By Country, 2012–2023
- Exports, In Value Terms, By Country, 2012–2023
- Export Prices, By Country Of Destination, 2012–2023


