Turkey - Saturated Acyclic Monocarboxylic Acids - Market Analysis, Forecast, Size, Trends and Insights
Get instant access to more than 2 million reports, dashboards, and datasets on the IndexBox Platform.
View PricingTurkey's Imports of Saturated Acyclic Monocarboxylic Acids Soar to $34M in November 2023
Turkey Saturated Acyclic Monocarboxylic Acids Imports
In November 2023, imports of saturated acyclic monocarboxylic acids into Turkey surged to 39K tons, with an increase of 48% against the previous month. Over the period under review, imports enjoyed a tangible expansion. The pace of growth was the most pronounced in December 2022 with an increase of 83% m-o-m. As a result, imports reached the peak of 54K tons. From January 2023 to November 2023, the growth of imports remained at a lower figure.
In value terms, saturated acyclic monocarboxylic acids imports soared to $34M (IndexBox estimates) in November 2023. In general, imports, however, recorded a relatively flat trend pattern. The most prominent rate of growth was recorded in December 2022 with an increase of 61% m-o-m. As a result, imports attained the peak of $61M. From January 2023 to November 2023, the growth of imports failed to regain momentum.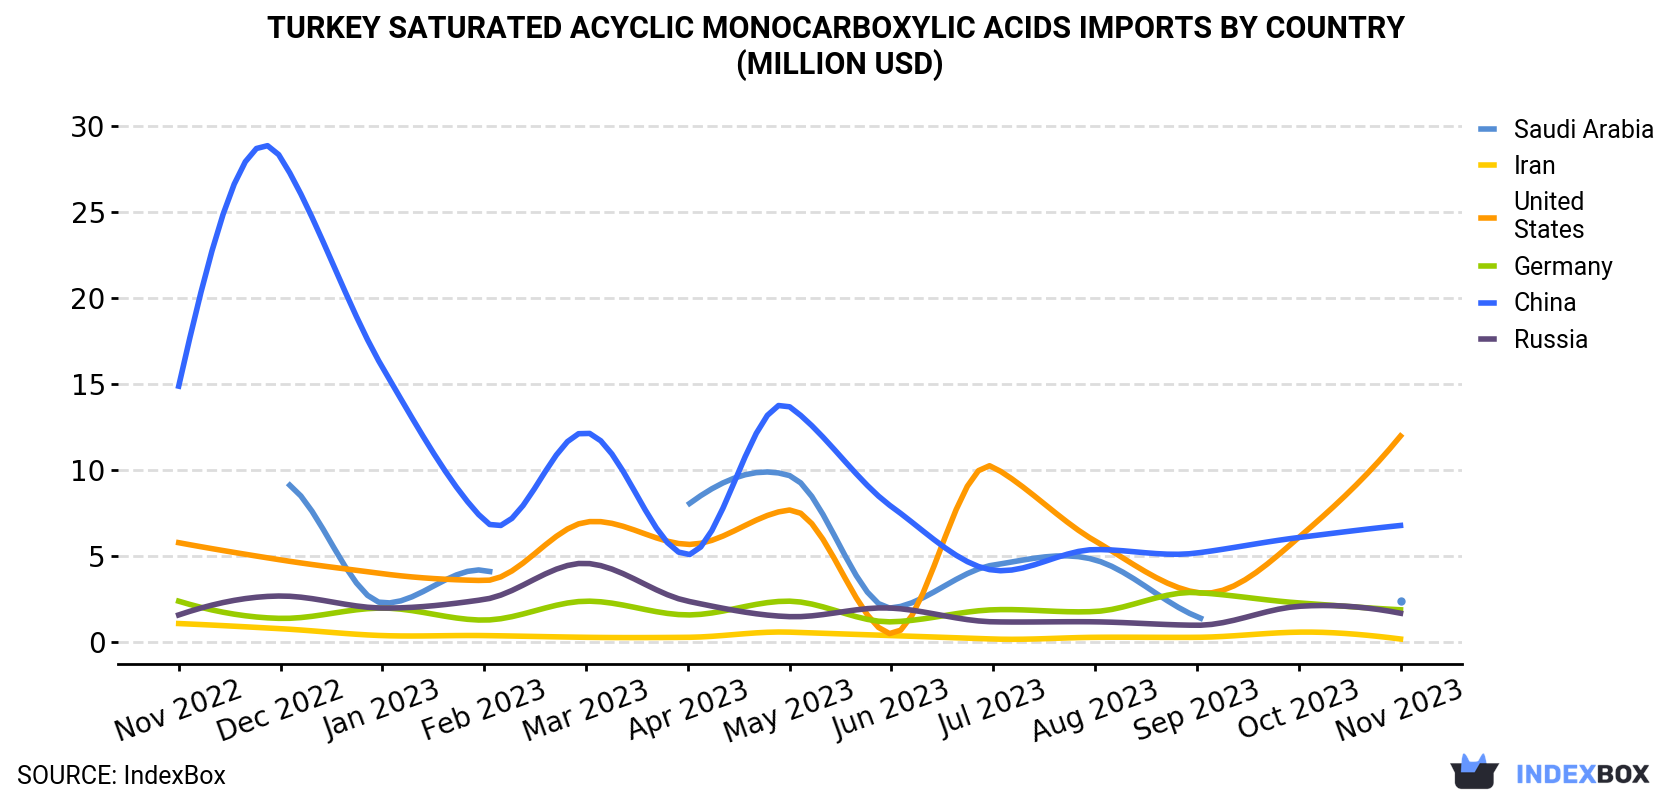
| COUNTRY | Import Value of Saturated Acyclic Monocarboxylic Acids in Turkey (million USD) | ||||||||||||
|---|---|---|---|---|---|---|---|---|---|---|---|---|---|
| Nov 2022 | Dec 2022 | Jan 2023 | Feb 2023 | Mar 2023 | Apr 2023 | May 2023 | Jun 2023 | Jul 2023 | Aug 2023 | Sep 2023 | Oct 2023 | Nov 2023 | |
| United States | 5.8 | 4.8 | 4.0 | 3.6 | 7.0 | 5.7 | 7.7 | 0.5 | 10.2 | 5.9 | 2.9 | 6.1 | 12.0 |
| China | 14.9 | 28.2 | 16.0 | 7.1 | 12.2 | 5.1 | 13.7 | 7.9 | 4.2 | 5.4 | 5.2 | 6.1 | 6.8 |
| Saudi Arabia | N/A | 9.4 | 2.3 | 4.2 | N/A | 8.0 | 9.7 | 2.0 | 4.5 | 4.8 | 1.5 | N/A | 2.4 |
| Germany | 2.4 | 1.4 | 2.0 | 1.3 | 2.4 | 1.6 | 2.4 | 1.2 | 1.9 | 1.8 | 2.9 | 2.3 | 1.9 |
| Russia | 1.6 | 2.7 | 2.0 | 2.5 | 4.6 | 2.4 | 1.5 | 2.0 | 1.2 | 1.2 | 1.0 | 2.1 | 1.7 |
| Iran | 1.1 | 0.8 | 0.4 | 0.4 | 0.3 | 0.3 | 0.6 | 0.4 | 0.2 | 0.3 | 0.3 | 0.6 | 0.2 |
| Others | 11.9 | 13.3 | 6.7 | 11.5 | 9.1 | 9.8 | 11.5 | 8.3 | 7.0 | 8.7 | 8.8 | 9.2 | 9.6 |
| Total | 37.7 | 60.6 | 33.5 | 30.4 | 35.5 | 32.7 | 47.1 | 22.3 | 29.1 | 28.2 | 22.6 | 26.5 | 34.4 |
Imports by Country
In November 2023, the United States (18K tons) constituted the largest saturated acyclic monocarboxylic acids supplier to Turkey, accounting for a 47% share of total imports. Moreover, saturated acyclic monocarboxylic acids imports from the United States exceeded the figures recorded by the second-largest supplier, China (7.4K tons), twofold. Saudi Arabia (2.5K tons) ranked third in terms of total imports with a 6.5% share.
From November 2022 to November 2023, the average monthly growth rate of volume from the United States stood at +13.7%. The remaining supplying countries recorded the following average monthly rates of imports growth: China (-6.0% per month) and Saudi Arabia (-9.8% per month).
In value terms, the United States ($12M), China ($6.8M) and Saudi Arabia ($2.4M) constituted the largest saturated acyclic monocarboxylic acids suppliers to Turkey, together comprising 61% of total imports.
the United States, with a CAGR of +6.1%, recorded the highest rates of growth with regard to the value of imports, in terms of the main suppliers over the period under review, while purchases for the other leaders experienced mixed trend patterns.
Imports by Type
Acetic acid (15K tons), esters of acetic acid (excluding ethyl acetate) (11K tons) and ethyl acetate (5.6K tons) were the main products of saturated acyclic monocarboxylic acids imports to Turkey, together accounting for 83% of total imports. These products were followed by formic acid, its salts and esters, mono-, di- or tri-chloroacetic acids; propionic, butanoic and pentanoic acids and their salts and esters, salts of acetic acid, palmitic acid, stearic acid, their salts and esters and acetic anhydride, which together accounted for a further 17%.
From November 2022 to November 2023, the biggest increases were in salts of acetic acid (with a CAGR of +18.7%), while purchases for the other products experienced more modest paces of growth.
In value terms, the most traded types of saturated acyclic monocarboxylic acids in Turkey were esters of acetic acid (excluding ethyl acetate) ($13M), acetic acid ($8.7M) and ethyl acetate ($6M), together accounting for 80% of total imports. These products were followed by formic acid, its salts and esters, mono-, di- or tri-chloroacetic acids; propionic, butanoic and pentanoic acids and their salts and esters, salts of acetic acid, palmitic acid, stearic acid, their salts and esters and acetic anhydride, which together accounted for a further 20%.
Import Prices by Country
In November 2023, the saturated acyclic monocarboxylic acids price amounted to $891 per ton (CIF, Turkey), shrinking by -12.4% against the previous month. In general, the import price continues to indicate a noticeable decline. The most prominent rate of growth was recorded in September 2023 an increase of 26% m-o-m. Over the period under review, average import prices reached the peak figure at $1,285 per ton in November 2022; however, from December 2022 to November 2023, import prices stood at a somewhat lower figure.
There were significant differences in the average prices amongst the major supplying countries. In November 2023, the country with the highest price was Belgium ($1,511 per ton), while the price for the United States ($663 per ton) was amongst the lowest.
From November 2022 to November 2023, the most notable rate of growth in terms of prices was attained by Russia (+1.1%), while the prices for the other major suppliers experienced a decline.
This report provides an in-depth analysis of the market for saturated acyclic monocarboxylic acids in Turkey. Within it, you will discover the latest data on market trends and opportunities by country, consumption, production and price developments, as well as the global trade (imports and exports). The forecast exhibits the market prospects through 2030.
Product coverage:
- Prodcom 20143215 - Ethyl acetate
- Prodcom 20143219 - Esters of acetic acid (excluding ethyl acetate)
- Prodcom 20143220 - Mono-, di- or tri-chloroacetic acids, propionic, butanoic and pentanoic acids, their salts and esters
- Prodcom 20143230 -
- Prodcom 20143240 -
- Prodcom 20143250 - Formic acid, its salts and esters
- Prodcom 20143271 - Acetic acid
- Prodcom 20143278 - Salts of acetic acid
- Prodcom 20143280 - Lauric acid and others, salts and esters
Country coverage:
- Turkey
Data coverage:
- Market volume and value
- Per Capita consumption
- Forecast of the market dynamics in the medium term
- Trade (exports and imports) in Turkey
- Export and import prices
- Market trends, drivers and restraints
- Key market players and their profiles
Reasons to buy this report:
- Take advantage of the latest data
- Find deeper insights into current market developments
- Discover vital success factors affecting the market
This report is designed for manufacturers, distributors, importers, and wholesalers, as well as for investors, consultants and advisors.
In this report, you can find information that helps you to make informed decisions on the following issues:
- How to diversify your business and benefit from new market opportunities
- How to load your idle production capacity
- How to boost your sales on overseas markets
- How to increase your profit margins
- How to make your supply chain more sustainable
- How to reduce your production and supply chain costs
- How to outsource production to other countries
- How to prepare your business for global expansion
While doing this research, we combine the accumulated expertise of our analysts and the capabilities of artificial intelligence. The AI-based platform, developed by our data scientists, constitutes the key working tool for business analysts, empowering them to discover deep insights and ideas from the marketing data.
-
1. INTRODUCTION
Making Data-Driven Decisions to Grow Your Business
- REPORT DESCRIPTION
- RESEARCH METHODOLOGY AND AI PLATFORM
- DATA-DRIVEN DECISIONS FOR YOUR BUSINESS
- GLOSSARY AND SPECIFIC TERMS
-
2. EXECUTIVE SUMMARY
A Quick Overview of Market Performance
- KEY FINDINGS
- MARKET TRENDS This Chapter is Available Only for the Professional Edition PRO
-
3. MARKET OVERVIEW
Understanding the Current State of The Market and Its Prospects
- MARKET SIZE
- MARKET STRUCTURE
- TRADE BALANCE
- PER CAPITA CONSUMPTION
- MARKET FORECAST TO 2030
-
4. MOST PROMISING PRODUCT
Finding New Products to Diversify Your Business
This Chapter is Available Only for the Professional Edition PRO- TOP PRODUCTS TO DIVERSIFY YOUR BUSINESS
- BEST-SELLING PRODUCTS
- MOST CONSUMED PRODUCT
- MOST TRADED PRODUCT
- MOST PROFITABLE PRODUCT FOR EXPORT
-
5. MOST PROMISING SUPPLYING COUNTRIES
Choosing the Best Countries to Establish Your Sustainable Supply Chain
This Chapter is Available Only for the Professional Edition PRO- TOP COUNTRIES TO SOURCE YOUR PRODUCT
- TOP PRODUCING COUNTRIES
- TOP EXPORTING COUNTRIES
- LOW-COST EXPORTING COUNTRIES
-
6. MOST PROMISING OVERSEAS MARKETS
Choosing the Best Countries to Boost Your Exports
This Chapter is Available Only for the Professional Edition PRO- TOP OVERSEAS MARKETS FOR EXPORTING YOUR PRODUCT
- TOP CONSUMING MARKETS
- UNSATURATED MARKETS
- TOP IMPORTING MARKETS
- MOST PROFITABLE MARKETS
7. PRODUCTION
The Latest Trends and Insights into The Industry
- PRODUCTION VOLUME AND VALUE
8. IMPORTS
The Largest Import Supplying Countries
- IMPORTS FROM 2012–2023
- IMPORTS BY COUNTRY
- IMPORT PRICES BY COUNTRY
9. EXPORTS
The Largest Destinations for Exports
- EXPORTS FROM 2012–2023
- EXPORTS BY COUNTRY
- EXPORT PRICES BY COUNTRY
-
10. PROFILES OF MAJOR PRODUCERS
The Largest Producers on The Market and Their Profiles
This Chapter is Available Only for the Professional Edition PRO -
LIST OF TABLES
- Key Findings In 2023
- Market Volume, In Physical Terms, 2012–2023
- Market Value, 2012–2023
- Per Capita Consumption In 2012-2023
- Imports, In Physical Terms, By Country, 2012–2023
- Imports, In Value Terms, By Country, 2012–2023
- Import Prices, By Country Of Origin, 2012–2023
- Exports, In Physical Terms, By Country, 2012–2023
- Exports, In Value Terms, By Country, 2012–2023
- Export Prices, By Country Of Destination, 2012–2023
-
LIST OF FIGURES
- Market Volume, In Physical Terms, 2012–2023
- Market Value, 2012–2023
- Market Structure – Domestic Supply vs. Imports, In Physical Terms, 2012-2023
- Market Structure – Domestic Supply vs. Imports, In Value Terms, 2012-2023
- Trade Balance, In Physical Terms, 2012-2023
- Trade Balance, In Value Terms, 2012-2023
- Per Capita Consumption, 2012-2023
- Market Volume Forecast to 2030
- Market Value Forecast to 2030
- Products: Market Size And Growth, By Type
- Products: Average Per Capita Consumption, By Type
- Products: Exports And Growth, By Type
- Products: Export Prices And Growth, By Type
- Production Volume And Growth
- Exports And Growth
- Export Prices And Growth
- Market Size And Growth
- Per Capita Consumption
- Imports And Growth
- Import Prices
- Production, In Physical Terms, 2012–2023
- Production, In Value Terms, 2012–2023
- Imports, In Physical Terms, 2012–2023
- Imports, In Value Terms, 2012–2023
- Imports, In Physical Terms, By Country, 2023
- Imports, In Physical Terms, By Country, 2012–2023
- Imports, In Value Terms, By Country, 2012–2023
- Import Prices, By Country Of Origin, 2012–2023
- Exports, In Physical Terms, 2012–2023
- Exports, In Value Terms, 2012–2023
- Exports, In Physical Terms, By Country, 2023
- Exports, In Physical Terms, By Country, 2012–2023
- Exports, In Value Terms, By Country, 2012–2023
- Export Prices, By Country Of Destination, 2012–2023


