
Turkey - Concrete Reinforcing Bars - Market Analysis, Forecast, Size, Trends And Insights
Get instant access to more than 2 million reports, dashboards, and datasets on the IndexBox Platform.
View PricingTurkey Experiences a Significant Drop in Concrete Reinforcing Bar Exports, Falling to $166M in January 2024
Turkey Concrete Reinforcing Bar Exports
Concrete reinforcing bar exports from Turkey dropped remarkably to 285K tons in January 2024, waning by -23.6% on December 2023 figures. In general, exports recorded a slight curtailment. The pace of growth appeared the most rapid in June 2023 when exports increased by 44% against the previous month.
In value terms, concrete reinforcing bar exports contracted remarkably to $166M (IndexBox estimates) in January 2024. Overall, exports showed a perceptible decline. The most prominent rate of growth was recorded in June 2023 with an increase of 39% month-to-month.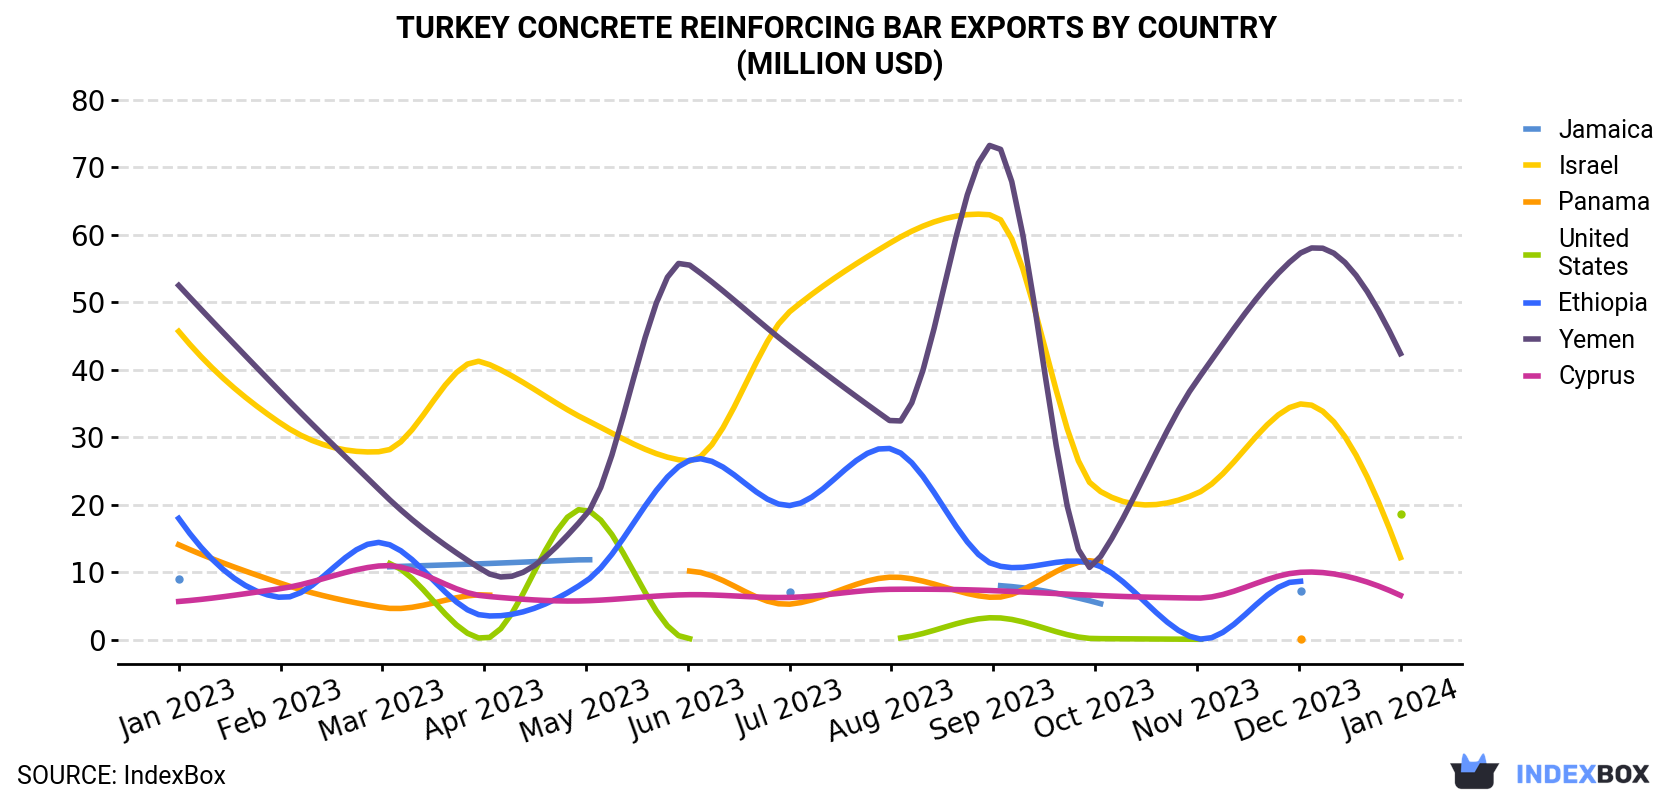
| COUNTRY | Export Value of Concrete Reinforcing Bar in Turkey (million USD) | ||||||||||||
|---|---|---|---|---|---|---|---|---|---|---|---|---|---|
| Jan 2023 | Feb 2023 | Mar 2023 | Apr 2023 | May 2023 | Jun 2023 | Jul 2023 | Aug 2023 | Sep 2023 | Oct 2023 | Nov 2023 | Dec 2023 | Jan 2024 | |
| Yemen | 52.5 | 36.7 | 21.8 | 10.2 | 18.5 | 55.7 | 43.5 | 32.3 | 73.5 | 11.2 | 38.4 | 57.1 | 42.4 |
| United States | 21.0 | < 0.1 | 11.5 | 0.2 | 19.3 | 0.2 | < 0.1 | 0.2 | 3.3 | 0.2 | 0.1 | < 0.1 | 18.7 |
| Israel | 45.7 | 32.1 | 27.9 | 41.1 | 32.6 | 26.5 | 48.6 | 58.9 | 62.9 | 22.5 | 21.7 | 34.9 | 12.2 |
| Cyprus | 5.7 | 7.6 | 11.0 | 6.5 | 5.8 | 6.7 | 6.3 | 7.5 | 7.3 | 6.6 | 6.2 | 10.0 | 6.6 |
| Jamaica | 9.0 | N/A | 10.8 | 11.3 | 11.9 | < 0.1 | 7.1 | < 0.1 | 8.1 | 5.6 | < 0.1 | 7.2 | N/A |
| Panama | 14.1 | 8.4 | 4.8 | 6.7 | N/A | 10.2 | 5.3 | 9.3 | 6.3 | 11.7 | < 0.1 | 0.1 | < 0.1 |
| Ethiopia | 18.0 | 6.3 | 14.4 | 3.6 | 8.7 | 26.5 | 19.9 | 28.3 | 11.2 | 11.2 | 0.2 | 8.7 | N/A |
| Others | 46.7 | 60.9 | 60.1 | 52.8 | 56.9 | 87.2 | 88.5 | 98.4 | 74.0 | 114 | 103 | 94.7 | 86.2 |
| Total | 213 | 152 | 162 | 132 | 154 | 213 | 219 | 235 | 247 | 183 | 170 | 213 | 166 |
Exports by Country
Yemen (75K tons) was the main destination for concrete reinforcing bar exports from Turkey, with a 26% share of total exports. Moreover, concrete reinforcing bar exports to Yemen exceeded the volume sent to the second major destination, the United States (33K tons), twofold. The third position in this ranking was taken by Israel (20K tons), with a 7.2% share.
From January 2023 to January 2024, the average monthly growth rate of volume to Yemen was relatively modest. Exports to the other major destinations recorded the following average monthly rates of exports growth: the United States (-0.0% per month) and Israel (-9.5% per month).
In value terms, Yemen ($42M) remains the key foreign market for concrete reinforcing bar exports from Turkey, comprising 26% of total exports. The second position in the ranking was taken by the United States ($19M), with an 11% share of total exports. It was followed by Israel, with a 7.3% share.
From January 2023 to January 2024, the average monthly rate of growth in terms of value to Yemen stood at -1.8%. Exports to the other major destinations recorded the following average monthly rates of exports growth: the United States (-1.0% per month) and Israel (-10.4% per month).
Export Prices by Country
In January 2024, the concrete reinforcing bar price stood at $584 per ton (FOB, Turkey), increasing by 2.2% against the previous month. In general, the export price, however, saw a mild shrinkage. The most prominent rate of growth was recorded in March 2023 an increase of 4.4% m-o-m. Over the period under review, the average export prices attained the maximum at $713 per ton in April 2023; however, from May 2023 to January 2024, the export prices stood at a somewhat lower figure.
Average prices varied noticeably for the major external markets. In January 2024, the highest price was recorded for prices to the UK ($611 per ton) and Romania ($609 per ton), while the average price for exports to Syrian Arab Republic ($504 per ton) and Lebanon ($513 per ton) were amongst the lowest.
From January 2023 to January 2024, the most notable rate of growth in terms of prices was recorded for supplies to Syrian Arab Republic (-0.3%), while the prices for the other major destinations experienced a decline.
This report provides an in-depth analysis of the concrete reinforcing bar market in Turkey. Within it, you will discover the latest data on market trends and opportunities by country, consumption, production and price developments, as well as the global trade (imports and exports). The forecast exhibits the market prospects through 2030.
Product coverage:
- Prodcom 2410T241 - Concrete reinforcing bars
- Prodcom 24106210 - Hot-rolled concrete reinforcing bars
Country coverage:
- Turkey
Data coverage:
- Market volume and value
- Per Capita consumption
- Forecast of the market dynamics in the medium term
- Trade (exports and imports) in Turkey
- Export and import prices
- Market trends, drivers and restraints
- Key market players and their profiles
Reasons to buy this report:
- Take advantage of the latest data
- Find deeper insights into current market developments
- Discover vital success factors affecting the market
This report is designed for manufacturers, distributors, importers, and wholesalers, as well as for investors, consultants and advisors.
In this report, you can find information that helps you to make informed decisions on the following issues:
- How to diversify your business and benefit from new market opportunities
- How to load your idle production capacity
- How to boost your sales on overseas markets
- How to increase your profit margins
- How to make your supply chain more sustainable
- How to reduce your production and supply chain costs
- How to outsource production to other countries
- How to prepare your business for global expansion
While doing this research, we combine the accumulated expertise of our analysts and the capabilities of artificial intelligence. The AI-based platform, developed by our data scientists, constitutes the key working tool for business analysts, empowering them to discover deep insights and ideas from the marketing data.
-
1. INTRODUCTION
Making Data-Driven Decisions to Grow Your Business
- REPORT DESCRIPTION
- RESEARCH METHODOLOGY AND AI PLATFORM
- DATA-DRIVEN DECISIONS FOR YOUR BUSINESS
- GLOSSARY AND SPECIFIC TERMS
-
2. EXECUTIVE SUMMARY
A Quick Overview of Market Performance
- KEY FINDINGS
- MARKET TRENDS This Chapter is Available Only for the Professional Edition PRO
-
3. MARKET OVERVIEW
Understanding the Current State of The Market and Its Prospects
- MARKET SIZE
- MARKET STRUCTURE
- TRADE BALANCE
- PER CAPITA CONSUMPTION
- MARKET FORECAST TO 2030
-
4. MOST PROMISING PRODUCT
Finding New Products to Diversify Your Business
This Chapter is Available Only for the Professional Edition PRO- TOP PRODUCTS TO DIVERSIFY YOUR BUSINESS
- BEST-SELLING PRODUCTS
- MOST CONSUMED PRODUCT
- MOST TRADED PRODUCT
- MOST PROFITABLE PRODUCT FOR EXPORT
-
5. MOST PROMISING SUPPLYING COUNTRIES
Choosing the Best Countries to Establish Your Sustainable Supply Chain
This Chapter is Available Only for the Professional Edition PRO- TOP COUNTRIES TO SOURCE YOUR PRODUCT
- TOP PRODUCING COUNTRIES
- TOP EXPORTING COUNTRIES
- LOW-COST EXPORTING COUNTRIES
-
6. MOST PROMISING OVERSEAS MARKETS
Choosing the Best Countries to Boost Your Exports
This Chapter is Available Only for the Professional Edition PRO- TOP OVERSEAS MARKETS FOR EXPORTING YOUR PRODUCT
- TOP CONSUMING MARKETS
- UNSATURATED MARKETS
- TOP IMPORTING MARKETS
- MOST PROFITABLE MARKETS
7. PRODUCTION
The Latest Trends and Insights into The Industry
- PRODUCTION VOLUME AND VALUE
8. IMPORTS
The Largest Import Supplying Countries
- IMPORTS FROM 2012–2023
- IMPORTS BY COUNTRY
- IMPORT PRICES BY COUNTRY
9. EXPORTS
The Largest Destinations for Exports
- EXPORTS FROM 2012–2023
- EXPORTS BY COUNTRY
- EXPORT PRICES BY COUNTRY
-
10. PROFILES OF MAJOR PRODUCERS
The Largest Producers on The Market and Their Profiles
This Chapter is Available Only for the Professional Edition PRO -
LIST OF TABLES
- Key Findings In 2023
- Market Volume, In Physical Terms, 2012–2023
- Market Value, 2012–2023
- Per Capita Consumption In 2012-2023
- Imports, In Physical Terms, By Country, 2012–2023
- Imports, In Value Terms, By Country, 2012–2023
- Import Prices, By Country Of Origin, 2012–2023
- Exports, In Physical Terms, By Country, 2012–2023
- Exports, In Value Terms, By Country, 2012–2023
- Export Prices, By Country Of Destination, 2012–2023
-
LIST OF FIGURES
- Market Volume, In Physical Terms, 2012–2023
- Market Value, 2012–2023
- Market Structure – Domestic Supply vs. Imports, In Physical Terms, 2012-2023
- Market Structure – Domestic Supply vs. Imports, In Value Terms, 2012-2023
- Trade Balance, In Physical Terms, 2012-2023
- Trade Balance, In Value Terms, 2012-2023
- Per Capita Consumption, 2012-2023
- Market Volume Forecast to 2030
- Market Value Forecast to 2030
- Products: Market Size And Growth, By Type
- Products: Average Per Capita Consumption, By Type
- Products: Exports And Growth, By Type
- Products: Export Prices And Growth, By Type
- Production Volume And Growth
- Exports And Growth
- Export Prices And Growth
- Market Size And Growth
- Per Capita Consumption
- Imports And Growth
- Import Prices
- Production, In Physical Terms, 2012–2023
- Production, In Value Terms, 2012–2023
- Imports, In Physical Terms, 2012–2023
- Imports, In Value Terms, 2012–2023
- Imports, In Physical Terms, By Country, 2023
- Imports, In Physical Terms, By Country, 2012–2023
- Imports, In Value Terms, By Country, 2012–2023
- Import Prices, By Country Of Origin, 2012–2023
- Exports, In Physical Terms, 2012–2023
- Exports, In Value Terms, 2012–2023
- Exports, In Physical Terms, By Country, 2023
- Exports, In Physical Terms, By Country, 2012–2023
- Exports, In Value Terms, By Country, 2012–2023
- Export Prices, By Country Of Destination, 2012–2023


